Bearish on $GBPCHF1. We have structure shift on H1 (MSS)
2. We have Buyside purge within the entry pd array
3. We have draw on liquidities as the trendline liq and inversion fair value gap
4. We have price purging a major daily buyside liquidity
CHFGBP trade ideas

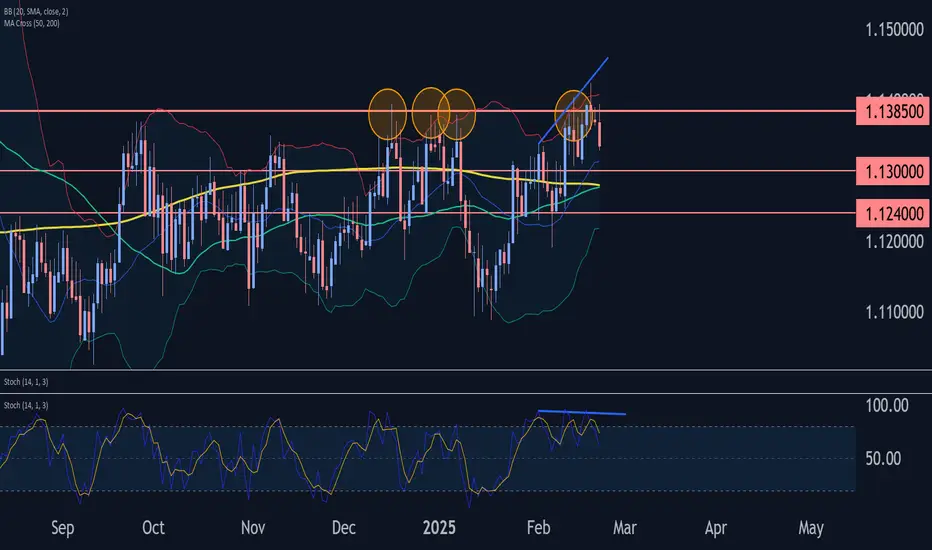
GBPCHF Wave Analysis – 21 February 2025
- GBPCHF reversed from resistance zone
- Likely to fall to support level 1.1300
GBPCHF currency pair recently reversed down from the resistance zone between the multi-month resistance level 1.1385 (which has been reversing the price from July) and the upper daily Bollinger Band.
The downward reversal from this resistance zone stopped impulse wave 5 of the intermediate upward impulse sequence (C) from January.
Given the strength of the resistance level 1.1385 and the triple bearish divergence on the daily Stochastic, GBPCHF currency pair can be expected to fall to the next support level 1.1300 (low of the previous minor correction 4).
GBPCHF sideways consolidation below resistance The GBPCHF currency pair price action sentiment appears neutral, supported by the longer-term prevailing sideways consolidation price range.
The key trading level is at 1.1425, current swing high. An overbought pullback from the current levels and a bearish rejection from the 1.1425 level could target the downside support at 1.1310 followed by 1.1245 and 1.1165 levels over the longer timeframe.
Alternatively, a confirmed breakout above 1.1425 resistance and a daily close above that level would change the outlook to bullish opening the way for further rallies higher and a retest of 1.1450 resistance followed by 1.1470 and 1.1500 levels.
This communication is for informational purposes only and should not be viewed as any form of recommendation as to a particular course of action or as investment advice. It is not intended as an offer or solicitation for the purchase or sale of any financial instrument or as an official confirmation of any transaction. Opinions, estimates and assumptions expressed herein are made as of the date of this communication and are subject to change without notice. This communication has been prepared based upon information, including market prices, data and other information, believed to be reliable; however, Trade Nation does not warrant its completeness or accuracy. All market prices and market data contained in or attached to this communication are indicative and subject to change without notice.

POTENTIAL SHORT TRADE SET UP FOR GBPCHFAnalysis: Utilizing chart patterns, highs & lows, and impulses & corrections, the focus is on identifying a continuation corrective structure following a breakout.
Entry: The price approached the previous HTF swing high zone with an ascending structure on the mid time frame (MTF), forming a double top pattern at the peak of the swing high area. Subsequently, the price broke below the lower time frame ascending structure, signaling a bearish shift, and formed another bearish continuation-like pattern.
Expectation: A downward move is anticipated, targeting the base of the mid time frame (MTF) ascending structure.
⚠️ Reminder: Conduct your own analysis and implement proper risk management, as forex trading carries no guarantees. This is a high-risk endeavor, and past performance does not predict future outcomes. Trade responsibly!

#GBPCHF 4HGBPCHF (4H Timeframe) Analysis
Market Structure:
The price is forming a rising wedge pattern, which is typically a bearish reversal pattern. This suggests that the upward momentum is weakening, and a potential downside move could follow if the price breaks below the lower trendline.
Forecast:
A sell opportunity may arise if the price confirms a breakdown from the rising wedge pattern, signaling increased selling pressure.
Key Levels to Watch:
- Entry Zone: A sell position can be considered after a confirmed breakdown below the wedge support.
- Risk Management:
- Stop Loss: Placed above the recent swing high to minimize risk.
- Take Profit: Target key support levels based on previous price action.
Market Sentiment:
The rising wedge indicates potential bearish momentum. A confirmed breakdown with strong price action can provide better validation for the sell setup.

+200 pips Best Level to Short GBPCHF from Resistance🔸Hello traders, let's review the H6 chart for GBPCHF today. Trading
near premium prices of the multiweek range, closing in on heavy S/R
Currently risk/reward is shifting in bears favor, so it's recommended
to look for sell side setups in GBPCHF.
🔸Heavy overhead mirror S/R zone at 1440/1460 expecting reversal
from overhead resistance. current bid is 1380so final push required
before we can get a decent entry on sell side.
🔸Recommended strategy for GBPCHF traders: short any rips/rallies near S/R 1440/1460 price is currently trading near premium levels and is almost maxed out already, limited upside. TP1 bears 1260 TP2 bears 1230 pips final exit 1230 +200 pips. This is a swing trade setup so naturally will take more time to complete / hit targets. good luck traders!
🎁Please hit the like button and
🎁Leave a comment to support our team!
RISK DISCLAIMER:
Trading Futures , Forex, CFDs and Stocks involves a risk of loss.
Please consider carefully if such trading is appropriate for you.
Past performance is not indicative of future results.
Always limit your leverage and use tight stop loss.

GBP/CHF BEARS ARE STRONG HERE|SHORT
Hello, Friends!
Previous week’s green candle means that for us the GBP/CHF pair is in the uptrend. And the current movement leg was also up but the resistance line will be hit soon and upper BB band proximity will signal an overbought condition so we will go for a counter-trend short trade with the target being at 1.129.
✅LIKE AND COMMENT MY IDEAS✅

GBPCHF longThere is an upward trend with no deviation on the RSI
The pull back to the 0.68 Fib is an ideal entry
R:R is 1:1

Short GBP / CHFDaily liquidity has been swept on the upside. Price is ranging for some time within a tight range. It is getting rejection from this liquidity area where previously there was heavy selling. We can enter into a short trade. There is also an RSI divergence which is acting as an extra confluence.
Price: 1.13797
TP: 1.12148
SL: 1.14387

17-02-2025 _ Short Term Bearish Idea _ GBPCHF H11- Divergence
2- Followed by Convergence
3- Pullback has happened.
4- One can expect continuation to the downside.

THOUGHTS ON GBP/CHFGBP/CHF 4H - Price is quite evidently bullish on the higher timeframes and therefore has given us the bias to buy into this market, I have gone ahead and found an area of Demand for price to pullback down and into.
We want to see price come and correct itself, trading us lower in the market, this will give us the ability to capitalise in long positions and trade along side the prevailing trend.
Because we have an area of Demand marked out we are able to get involved with a refined entry will give us better RR odds on the trades we do place. You can see the higher timeframe low set to the left of our screen, that was to clear orders.
Seeing price show weakness to the upside here gives me the confluence to suggest that price is going to put in this fractal correction so I feel this trade set up will be ready to execute in the coming days.

GBPCHF - Long active !!Hello traders!
‼️ This is my perspective on GBPCHF.
Technical analysis: Here we are in a bullish market structure from 4H timeframe perspective, so I expect bullish price action after price filled almost all the imbalance and rejected from bullish trendline + institutional big figure 1.13000. Also we have hidden divergence for buy.
Like, comment and subscribe to be in touch with my content!

GBPCHF resistance at 1.1425 swing highThe GBPCHF currency pair price action sentiment appears neutral, supported by the longer-term prevailing sideways consolidation price range.
The key trading level is at 1.1425, current swing high. An overbought pullback from the current levels and a bearish rejection from the 1.1425 level could target the downside support at 1.1310 followed by 1.1245 and 1.1165 levels over the longer timeframe.
Alternatively, a confirmed breakout above 1.1425 resistance and a daily close above that level would change the outlook to bullish opening the way for further rallies higher and a retest of 1.1450 resistance followed by 1.1470 and 1.1500 levels.
This communication is for informational purposes only and should not be viewed as any form of recommendation as to a particular course of action or as investment advice. It is not intended as an offer or solicitation for the purchase or sale of any financial instrument or as an official confirmation of any transaction. Opinions, estimates and assumptions expressed herein are made as of the date of this communication and are subject to change without notice. This communication has been prepared based upon information, including market prices, data and other information, believed to be reliable; however, Trade Nation does not warrant its completeness or accuracy. All market prices and market data contained in or attached to this communication are indicative and subject to change without notice.

GBPCHF FORECASTThis pair guys has reached the higher timeframe value area! And it is where I was looking for the price to go and grab volume. Price has reached that potential area with clear structures, adding the probability for this trade to play out. Let's look this with a close eye and see how price is going to play out

GBPCHF: Bullish Trap & Pullback 🇬🇧🇨🇭
GBPCHF formed a confirmed bullish trap after a test
of a key horizontal resistance on an hourly.
I expect a retracement at least to 1.1384
❤️Please, support my work with like, thank you!❤️


GBPCHF ENTRY CHARTWe are BEARISH on this Pair, first the CHF is Strong,also the POUND is showing a sign of weakness, but on the GBPCHF chart, we have a SHIFT in TREND to the DOWNSIDE, we also have some confluences as that area is hitting the dynamic resistance+BB , while it mid-term is still BEARISH, We saw our LTF confirmation and decided to take the Trade, IF this matches with ypur TRADE IDEA, you can join us too, Update will be shared in the comment/update sections. THANK YOU.

GBPCHF is in the Selling from ResistanceHello Traders
In This Chart GBPCHF HOURLY Forex Forecast By FOREX PLANET
today GBPCHF analysis 👆
🟢This Chart includes_ (GBPCHF market update)
🟢What is The Next Opportunity on GBPCHF Market
🟢how to Enter to the Valid Entry With Assurance Profit
This CHART is For Trader's that Want to Improve Their Technical Analysis Skills and Their Trading By Understanding How To Analyze The Market Using Multiple Timeframes and Understanding The Bigger Picture on the Charts

GBPCHF LongRetail sentiment is 85% short for this pair. Key resistance level. Planning on a potential breakout from this price. Should see a nice close above the resistance zone if it does break.

GBP/CHFOn Daily,
This pair is going sideway for months. However, any time it reached the upper side of the box, it bounced back down. It seems Sellers are pretty strpong at that point.
On 1H chaart,
we can clearly notice a sharp "V" formation with a nice presize neck. (blue lines).
the target for bearish move can be around 1.12500.

GBPCHF - Head and Shoulders SetupHello traders,
On the daily timeframe GBPCHF has been consolidating in a range. Now it is at the resistance level of the range and so we should be looking for shorting opportunities.
On the lower timeframes, the 4H and 2H, it has formed a head and shoulders pattern which is a great reversal pattern.
Add to this the RSI divergence which in many occasions foreshadows the change in trend.
I will be entering when we get a close below the neckline on the 2H timeframe.


GBP correlation upAs the correlation for GBP is Up higer the chances for market to go up on the respected pairs
