CHFJPY - Downtrend to Continue?Swiss franc looking on its heels ahead of inflation figures later this week. Opposite, Yen may have buyers with recent hawkish rhetoric relative to past signals. I like the swing into previous support here. So I am take a short position with a wait-and-see stance. Looking for 40 pips or better depending on the market action.
CHFJPY trade ideas
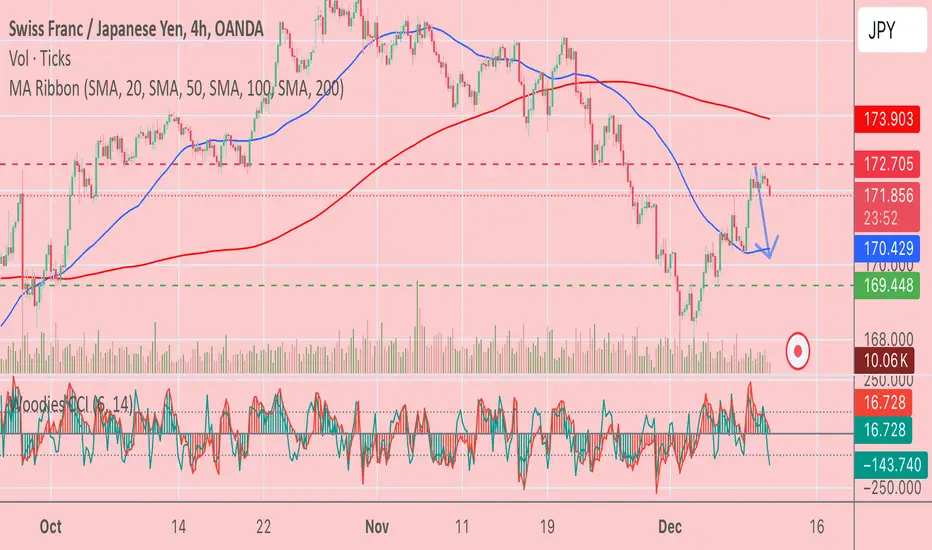
CHF-JPY Bearish Bias! Sell!
Hello,Traders!
CHF-JPY has retested a
Horizontal resistance
Of 172.868 and as the
Pair is locally overbought
We will be expecting a
Local bearish correction
Sell!
Comment and subscribe to help us grow!
Check out other forecasts below too!

CHFJPY TRADE UPDATECHFJPY looks promising, and our strategy is to wait for the SOS signal to occur on the 4-hour timeframe, along with confirmation of a pullback. Let's allow the price to develop further while we monitor for the SOS indication. It’s crucial to let the price action unfold before making any decisions.

SELL view on CHFJPYSelling CHF/JPY could be based on several macroeconomic and technical assumptions. Here’s a rationale based on both real-world factors and potential market dynamics:
1. Swiss National Bank (SNB) Policy
Monetary Policy Divergence: If the Swiss National Bank (SNB) maintains a dovish stance, perhaps due to concerns about inflation being too low or economic growth faltering, it may continue to hold interest rates lower for longer or engage in monetary easing. This could weaken the Swiss franc (CHF), making CHF/JPY a good candidate for a sell.
Interventions: The SNB is known for intervening to prevent excessive CHF appreciation, especially since a stronger franc can hurt Switzerland's export-dependent economy. This intervention could lead to CHF depreciation, favoring short positions.
2. Bank of Japan (BoJ) Shift
Potential Policy Shift: If the Bank of Japan (BoJ) signals a shift away from its ultra-loose monetary policy—possibly by reducing bond purchases or raising rates slightly—this would support a stronger yen (JPY). Recent inflation pressures in Japan have prompted discussions about tighter policy, which could drive yen appreciation.
Inflation and Wages: Japan has seen modest inflation, driven by rising wages and cost-push inflation, which could encourage the BoJ to adjust its policies more aggressively in the future, strengthening JPY.
3. Risk Sentiment and Safe Haven Flows
Shifts in Global Risk Appetite: Both CHF and JPY are considered safe-haven currencies, but JPY tends to outperform CHF in times of heightened risk aversion, especially with Asian investors and markets playing a larger role in global trade. A sudden rise in geopolitical tensions or market risk could favor the yen over the franc, creating downward pressure on CHF/JPY.
4. Technical Analysis
Overbought Conditions: If CHF/JPY has been in a prolonged uptrend and technical indicators such as the Relative Strength Index (RSI) or MACD suggest overbought conditions, this could signal an upcoming correction or reversal, making it a good time to sell.
Resistance Levels: Price approaching a strong resistance level, where CHF/JPY has previously reversed, might be another technical signal to initiate a sell trade. Combined with weak fundamentals, this could increase the likelihood of a pullback.
5. Switzerland’s Economic Slowdown
Slower Economic Growth: If Switzerland’s economic indicators, such as GDP growth, export performance, or business confidence, show signs of slowing down, it may reduce demand for the franc as investors anticipate lower returns or a more stagnant economy.
6. Japanese Trade Surplus
Strength in Japanese Exports: Japan's trade balance has been improving, driven by strong exports, especially in high-tech and automobile sectors. A growing trade surplus supports JPY strength, which could pressure CHF/JPY downward.
By combining these factors—particularly monetary policy divergence, risk sentiment, and potential technical signals—a sell position on CHF/JPY could be strategically viable.

CHF_JPY RISKY SHORT|
✅CHF_JPY is going up to retest a horizontal resistance of 173.000
Which makes me locally bearish biased
And I think that we will see a pullback
And a move down from the level
Towards the target below at 171.806
SHORT🔥
✅Like and subscribe to never miss a new idea!✅


Bullish Crab on CHFJPYLooking a nice buy here as price has completed the Crab pattern at the D entry point. This D entry point, along with the break and retest of the red horizontal line, gives us added confluence to enter the buy....a little late on this one but better late and confirmed.

CHFJPY long ideaprice goes up and break the zone after lil consolidation SL is at the bottom of that range and i will wait for it to touch 171.773

CHFJPY - Bullish TrendFollowing are the factors involved in Bullish Continuation:
1. Series of HH and HL
2. Divergence Diluted


CHFJPY Smart Money Concepts (SMC)In modern trading, especially within the Smart Money Concepts (SMC) methodology, terms such as Order Blocks, Imbalances, Breaker Blocks, and Inverted FVG (Fair Value Gaps) are widely used. Below is a detailed explanation of each:
---
1. Order Blocks
An Order Block is a zone on the chart where large institutional investors have left "traces" of their operations, meaning a place where there was a concentration of buying or selling activity. It is typically the last candle before a significant price movement.
Bullish Order Block: The last bearish candle before a strong upward movement.
Bearish Order Block: The last bullish candle before a strong downward movement.
How to use:
Price often returns to order blocks before continuing the trend.
Order blocks are used as potential entry or exit zones.
Example:
If the market is falling and a sharp reversal upwards begins, the last red candle before this rise is the bullish order block.
---
2. Imbalances
An Imbalance is a zone on the chart where demand and supply were sharply uneven, creating "gaps" in the market structure.
These zones are often referred to as FVG (Fair Value Gaps)—an area between the wicks of the first and last candles of three consecutive candles, where the middle candle does not overlap with the first or third.
It is believed that the market tends to fill these gaps, meaning the price often returns to these zones before continuing its movement.
How to use:
Imbalances can serve as a reference for identifying potential retracement zones.
Enter a position when the gap is filled.
Example:
In an uptrend, if the price rises sharply, creating a gap between the wicks of candles, traders can expect the price to return to this area.
---
3. Breaker Blocks
A Breaker Block is a zone that forms when the market breaks a key support or resistance level and begins moving in the opposite direction. They appear where an order block was "broken."
Breaker Blocks indicate that the previously dominant trend has been broken, and the market is preparing for a new movement.
They can also be used to filter valid order blocks.
How to use:
After an order block is broken, the former support/resistance zone can serve as an entry point after a retest.
Used to identify trend reversals.
Example:
In an uptrend, if the price breaks below the previous bullish order block, it becomes a bearish breaker block.
---
4. Inverted FVG (Inverted Fair Value Gap)
An Inverted FVG is a zone where the market provides excessive liquidity in the opposite direction, creating an opportunity for "smart money" to trap traders in the wrong movement.
An Inverted FVG occurs when the market "absorbs" liquidity, making traders believe the trend is continuing, but it is actually a manipulation before a reversal.
It is used to analyze price manipulation and find entry points against the "trap."
How to use:
Enter after the price has covered the FVG zone and confirmed a reversal.
Inverted FVGs often appear in zones that collect stop losses.
Example:
In an uptrend, the price sharply breaks a resistance zone (creating an FVG) but then reverses back and moves downward.
---
Conclusion
Order Blocks and Breaker Blocks help identify zones where large players may enter the market.
Imbalances highlight areas where the price might return to balance demand and supply.
Inverted FVGs help traders avoid traps set by large players and enter the market more strategically.
These elements are especially useful for traders following SMC principles, as they provide a deeper understanding of the actions of major market participants.

SELL CHFJPY - Selling JPY pairs, JPY strength to continueTrader Tom, a technical analyst with over 15 years’ experience, explains his trade idea using price action and a top down approach. This is one of many trades so if you would like to see more then please follow us and hit the boost button.
We are proud to be an OFFICIAL Trading View partner so please support the channel by using the link below and unleash the power of trading view today!
www.tradingview.com

CHFJPYThe potential sell scenario for the pair this week:
A strong opportunity to sell CHFJPY from the current levels.

CHFJPY Opportunity Presenting Itself Just have to be patientAs we navigate these pairs, it’s important that we take our time to thoughtfully develop our strategy. Currently, our time frames are aligned; however, we do need to see the price on the 4-hour chart turn bearish. This movement will help guide the price back to the daily area of interest (AOI).
Once we observe the price shifting back to a bullish trend, we will patiently await a pullback on the 4-hour chart. This will provide us an opportunity to analyze the lower time frames for a sign of strength (SOS) before proceeding with our trade. It’s essential to remember that exercising patience often yields the best results, and a more measured approach can lead to success.

Preparing chfjpy sellFrom weekly timeframe to 4hr timeframe and wait for breakouts and pullback of that my minor zone.

CHFJPY Wave AnalysisThe trend seems to have ended in this timeframe and we should wait for the start of a downtrend
Trade Entry: Range 171.150
Stop Loss: 172.750
Take Profit: 167.540
This offer has a risk/reward ratio of around 2.5
Make sure to involve less than 2-3% of your total capital and stick to money management principles
This is just a suggestion for consideration

CHFJPY - Downside move !!Hello traders!
‼️ This is my perspective on CHFJPY.
Technical analysis: Here we are in a bearish market structure from daily timeframe perspective, so I look for a short. I expect bearish price action after price filled the imbalance and rejected from bearish OB.
Fundamental news: Upcoming week on Thursday (GMT+2) we will see results of Interest Rate on CHF. News with high impact on currency.
Like, comment and subscribe to be in touch with my content!

CHF JPYCHF JPY is making higher highs and higher lows and is currently on trend line. A long position can be considered with SL below last higher low.

CHF/JPY confirmation with entering ascending channelHi dear investors, our next opportunity that we would look into is the CHF/JPY, with it's past attemp to touch the strong support level , there has been a lot of support which came from buyers which pushed the pair into an ascending channel, the lower Strong Support level was not able to be touched this is why we are seing a trend reversal.
The RSI recently got out of the 30 level and we would set up our targets into the upper level of the RSI at the 51 and 60 marks.
Entry : 169.550
Target 1 : 170.630
Target 2 : 171.810
SL level : 168.155
When target 2 is reached we would look for additional confirmations so we can set up our 3rd target at the level of - 174.06
As always my friends happy trading!
P.S. If you have questions or inquiries about one of my existing set-ups or personal questions / 1 on 1 sessions consider joining my channel so you can follow up with me in private!

CHFJPY trade ideaAfter giving us a double bottom rejection to change direction. we had a break of structure and a break above a key zone followed by a retest to confirm to us a change of direction. we have a retest to a key zone and a rejection. anticipating a further movement to the upside

CHFJPY: Bearish wave of Channel Down unfolding.CHFJPY is bearish on its 1D technical outlook (RSI = 41.014, MACD = -1.180, ADX = 47.694) as it is more than halfway on the new bearish wave of the 5 month Channel Down. Having crossed under both the 1D MA50 and MA200, the 1D RSI appears to technically be on a level much like the July 25th rebound. This indicates that we are on an ideal sell entry. Short and target (TP = 164.300) the full -7.43% extension (the decline of the July-Aug bearish wave).
## If you like our free content follow our profile to get more daily ideas. ##
## Comments and likes are greatly appreciated. ##

chfjpy longchfjpy is long , as it has made a bullish divergence on 4h and a retracemnet for the bearish really is pending. so we aim fro the target of the fib 0.5 and hope for the best inshallha

