chfjpy looks like retracingbut looking from CHF group, most pair not yet make higher low
waiting market to calm down
CHFJPY trade ideas

CHFJPY is BearishPrice was in a strong uptrend, however now it seems that bulls are exhausted, the notion is further validated by a double top reversal pattern with bearish divergence. If previous higher low is broken with good volume, then we can expect a bearish reversal as per Dow theory. Targets are mentioned on the chart.


chfjpy (SHORT)
Both CHF and JPY are safe heavens on Market but...
Japan weakens its currency during winter coming close to Summer holidays in Europe to attract more tourist as a cheap holiday destination.
Its summer holidays now

Chfjpy looks good buy A abuy of chf now at 184.600 area looks a nice prospect i can see a take profit as high as 185.305 and possibly a small pullback from there before further advance towards 185.900 is possible.

CHFJPY Looks Toppy… Is a 500 Pip Crash Coming?CHFJPY Has Exploded Past 180 — But Is the Top Already In?
After blowing clean through the key 180 resistance level, CHFJPY has continued surging into July — a month historically known for thin liquidity as traders hit holiday mode. These low-volume environments often lead to exaggerated price moves, much like we see in late December.
From a structural standpoint, this pair looks seriously overextended and ripe for a sharp pullback — with potential downside targets around 180 and 178 over the coming weeks.
If I were a bull, I’d want to see a clear break and weekly/monthly close above 186 before considering further upside.
As it stands, I’m gradually building into a short position, eyeing that 180 handle as my first key level.
Let me know your thoughts in the comments — agree, disagree, or seeing something I’m not?
*This is my personal analysis shared for educational purposes only. Always do your own research — never blindly follow anyone’s trades.*

CHFJPY SELL TRADE PLAN🔥 CHFJPY TRADE PLAN 🔥
📅 Date: 22 July 2025
📋 Trade Plan Overview
Type Direction Confidence R:R Status
Swing Sell ⭐⭐⭐⭐ (82%) 4.0:1 Awaiting Confirmation
Guidance: Focus on Scenario A Primary Plan – high confluence bearish rejection zone after extended bullish run. Scenario B remains tactical, lower probability unless impulsive breakdown.
Total risk: 1.2% (standard swing).
Primary Trade Plan: Swing Sell
📈 Market Bias & Trade Type
Bias: Bearish
Trade Type: Reversal - Post-Parabolic Exhaustion
🔰 Confidence Level
⭐⭐⭐⭐ (82%)
Reason:
D1 parabolic exhaustion + rejection wicks.
H4 strong bearish engulfing.
H1 impulsive breakdown from 185.40 zone.
Volume spike on H1 selling.
Fib 61.8% rejection.
Sentiment stretched overbought JPY weakness.
Breakdown:
Price Structure: 30%
Candlestick Patterns: 20%
Volume / Fib / RSI: 22%
Macro / Sentiment: 10%
📌 Status
Awaiting Confirmation
📍 Entry Zones
🟥 Primary Sell Zone:
184.45 – 184.75 (H4 bearish order block + imbalance + prior rejection)
👉 Status: Waiting for rejection wick / bearish engulfing / LTF breakdown.
🟧 Secondary Sell Zone:
185.20 – 185.45 (H4 final supply zone; riskier short).
❗ Stop Loss
185.65 (above secondary zone wick + structure + 1.2x ATR).
🎯 Take Profit Targets
🥇 TP1: 183.10 (H1 imbalance fill; 125 pips; ~2.0:1 R:R)
🥈 TP2: 182.20 (liquidity pool, structure target; 210 pips; ~3.5:1 R:R)
🥉 TP3: 180.90 (deeper swing pullback; H4 demand zone; ~4.8:1 R:R) – Optional trail.
📏 Risk:Reward
TP1: 2.0:1
TP2: 3.5:1
TP3: 4.8:1
🧠 Management Strategy
Risk 1.2% of $ ($ , lots).
Move SL to breakeven after TP1 hit.
Close 60% at TP1, 30% at TP2, leave 10% runner for TP3 (trail SL).
If impulsive bullish reclaim above 185.00, exit manually.
Portfolio Risk capped at 3% max open trades.
⚠️ Confirmation Checklist
H1 bearish engulfing OR rejection wick in primary zone.
H1/H4 volume spike during London or NY session.
RSI divergence (optional).
No major JPY risk events upcoming.
⏳ Validity
H4 Swing: Valid for 2–4 days (expires 26 July 2025).
❌ Invalidation
4H candle close above 185.65
Bullish BOS on H1 beyond secondary zone.
🌐 Fundamental & Sentiment Snapshot
COT: CHF neutral / JPY oversold.
DXY: Rangebound.
Retail: 77% buyers CHFJPY (contrarian bearish bias).
Cross-Pair: EURJPY and AUDJPY showing topping signs.
Cross-Market: Risk sentiment fragile (SP500 fading).
Macro: No major CHF/JPY news.
Sentiment Score: +7/10 bearish CHFJPY.
📋 Final Trade Summary
Sell CHFJPY targeting reversal after extended bullish run.
Focus is on rejection from 184.45–184.75 with strict SL above 185.65.
Patience mandatory for confirmation candlesticks.
Aggressive scaling only if H1 breaks down from current price.
PAIRS WITH JPY QOUTES MOVING THE SAME IN RECENT DAYSSo in my previous analyses, i did talk talk about shorting all jpy quote pairs and yen gaining strength this week. this chart shows the similar movements accross all board

CHFJPY Alert!
🚨 CHFJPY Alert 🚨
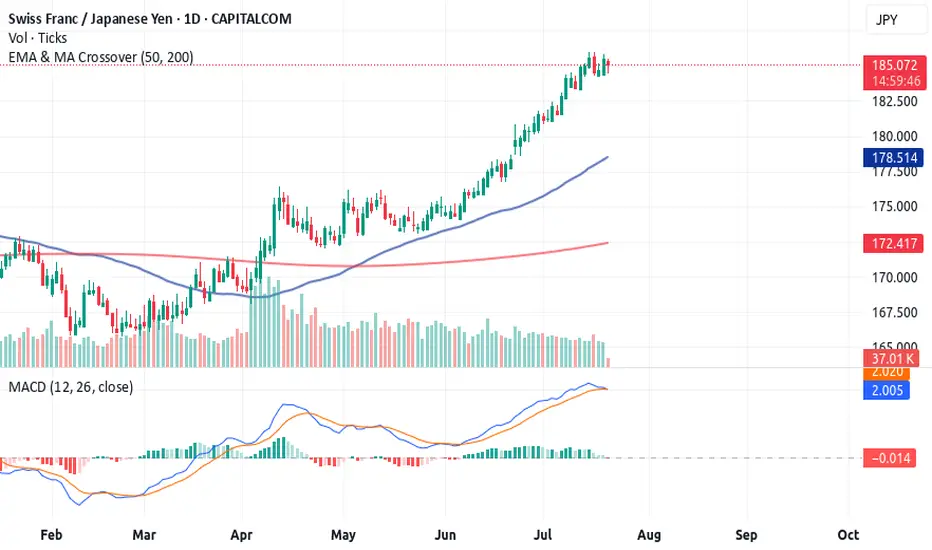
Don't catch a falling knife... 🔪 However, price always returns to moving averages, and CHFJPY could be starting its descent.
Personally, I think price may form one last bullish move up and then come crashing down. However, the 1-hour is forming a descending triangle. A break below the triangle could be the start of the daily retracement.
Thoughts?
CMCMARKETS:CHFJPY

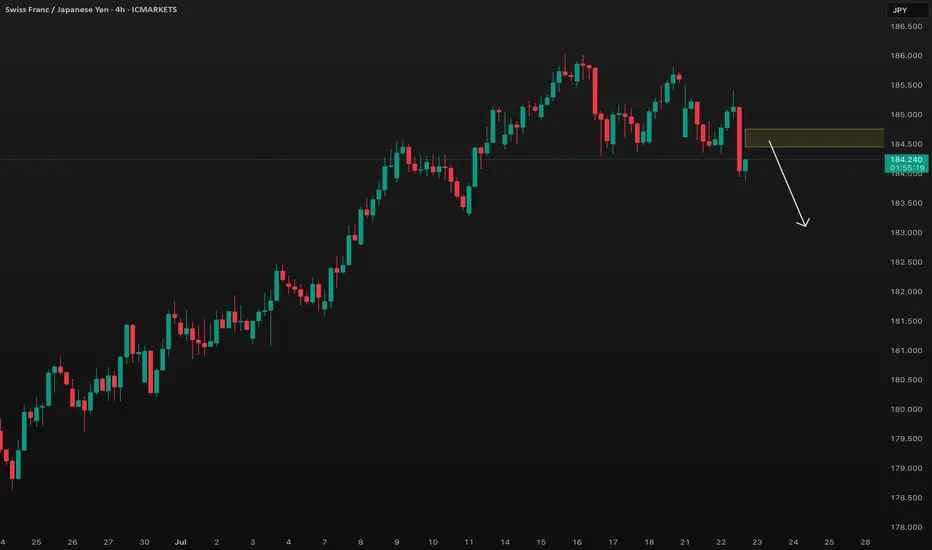
-CHFJPY (185,175 to 184,510CHFJPY will decline in today's market session. Price is providing entry opportunities as it reaches higher into the resistance.

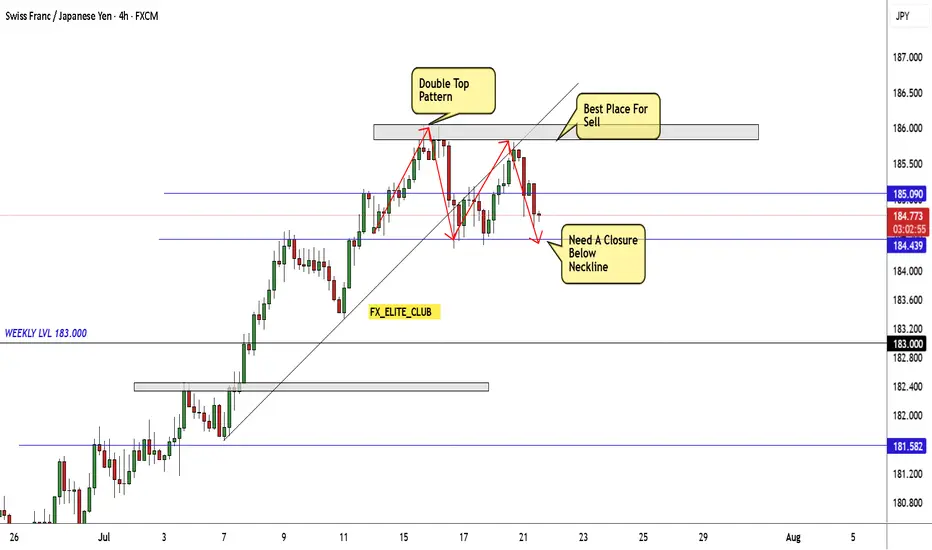
CHF/JPY Creating Double Top Reversal Pattern , Ready To Sell ?Here is my opinion on CHF/JPY 4H Chart , if we take a look we will see that the price moved tp upside very hard without any correction and now finally we have a reversal pattern but still not confirmed , so we have 2 places to sell this pair , first one is highest one around 185.800 To 186.000 and the second one if the price confirmed the pattern and closed below the neckline then we can enter a sell trade and targeting the nearest support . if we have not a closure below the neckline to confirm the pattern then this setup not valid .
short chfjpyplan is to short CHFJPY and other pairs with JPY as quote as similar patterns prevails. that is USDJPY, CADJPY, EURJPY, NZDJPY, AUDJPY, etc and hold for 2 or 3 days. it could go as low as the 2.618 fib level but let's start locking profit at 1.618.

Why CHFJPY is the #1 Forex Pair Right NowWhy CHFJPY is the #1 Forex Pair Right Now (And How to Trade It with the Rocket Booster Strategy)
In the ever-evolving world of Forex, where volatility and opportunity go hand in hand, traders are constantly on the
lookout for the next big mover. As of 2025, one currency pair is stealing the spotlight: CHFJPY (Swiss Franc vs. Japanese Yen). But
what makes this pair the top pick for savvy traders? And how can you capitalize on its momentum with the Rocket Booster Strategy?
Let’s break it down.
🔥 Why CHFJPY is the #1 Forex Pair Right Now
1. Safe-Haven Power Duo
Both the Swiss Franc (CHF) and the Japanese Yen (JPY) are traditionally viewed as safe-haven currencies. However, recent
geopolitical and inflationary trends have pushed CHF to dominate the Yen. Investors are choosing the Franc over the Yen for capital preservation due to:
Stronger Swiss economic fundamentals
Negative interest rate policies easing in Switzerland
Japan's continued loose monetary policy
2. Clear Bullish Trend
CHFJPY has shown consistent higher highs and higher lows on daily and weekly charts — a sign of institutional buying. The pair
has been on a clean bullish trajectory, offering excellent trend-following opportunities.
3. Low Correlation With USD
CHFJPY gives traders a break from the noise of USD-related pairs. This is ideal for portfolio diversification and avoiding dollar-index-related whipsaws.
4. Volatility with Direction
Unlike other volatile pairs that move erratically, CHFJPY delivers measured moves with directional conviction — perfect for momentum traders.
🚀 The Rocket Booster Strategy: Your Weapon for CHFJPY
The Rocket Booster Strategy is designed to identify strong momentum trades before they explode. It’s a 3-step system that filters out weak setups and locks in on potential high-profit
trades.
✅ The 3 Rocket Booster Steps
1. Price Above the 50 EMA
This tells us the short-term momentum is bullish. CHFJPY often rides above the 50 EMA for days or even weeks during strong trends.
2. Price Above the 200 EMA
This confirms the long-term trend is also bullish. When price is above both 50 EMA and 200 EMA, we have alignment — just like a rocket getting clearance from both control towers.
3. Volume Oscillator Confirmation
This is the ignition. We look for the Volume Oscillator to tick up or reverse from a dip, indicating renewed trader interest and the potential for price acceleration.
📘 Bonus Tip from Steve Nison: Volume confirms conviction. A breakout without volume = caution.
📊 Example CHFJPY Rocket Booster Setup
Rocket Booster Checklist Status
Price above 50 EMA ✅ Confirmed
Price above 200 EMA ✅ Confirmed
Volume Oscillator rising ✅ Confirmed
MACD shows bullish momentum ✅ Strong impulse
Candlestick Pattern ✅ Bullish Engulfing on 4H
This alignment means: Launch is ready.
🚀 Final Thoughts
CHFJPY is not just a currency pair — it’s a financial jet engine right now. Its blend of safety, momentum, and clarity makes it the #1 pick for traders in 2025. But without a proven system, even the best pair can leave you behind.
That’s where the Rocket Booster Strategy comes in.
When you combine a trending pair like CHFJPY with a strategy designed to identify high-probability entries, you’re not just trading — you’re flying.
💬 Ready to launch your next CHFJPY trade? Use the Rocket Booster Strategy and experience the power of momentum, clarity, and smart entries.
⚠️ Disclaimer
This content is for educational purposes only and not financial advice. Forex trading carries risk.
Always test strategies on a demo (simulation) account before trading with real money.
CHF-JPY Resistance Ahead! Sell!
Hello,Traders!
CHF-JPY keeps growing in
An uptrend and the pair is
Locally oversold so after the
Retest of the horizontal
Resistance of 186.000
From where we will be
Expecting a local bearish
Pullback on Monday
Sell!
Comment and subscribe to help us grow!
Check out other forecasts below too!
Disclosure: I am part of Trade Nation's Influencer program and receive a monthly fee for using their TradingView charts in my analysis.

What to expect next on CHFJPYTrend remains strongly bullish from the higher timeframe. Monthly, & weekly. Daily timeframe is slightly bullish but currently loosing some momentum. Therefore, from the H4 timeframe, we’re likely to see either a break above the current resistance to form a new high or were to see a decline below the key level.

CHFJPY SELL CHFJPY is on the sell side. Here, we can see the divergence in the RSI, and the rally is on the mature side, so we can assume that we can make the trade on the sell side

CHF/JPY MISSED MOVEWe started watching this market on Wednesday for a pullback and trigger, it happened but it was late at night....yawn....i was sleeping. No chance to get in this market even with a limit order...sometimes the market just takes off like that, this is why i use the volume and momentum indicators...if both of them line up along with a price structure pattern, it can produce a strong move


SYMMETRY
Hello awesome traders! 👋
Hope you’ve managed to grab some solid pips from the markets this week. As we head into the weekend, I’m wrapping things up by dropping a few clean chart setups for you to review and reflect on.
Enjoy the weekend, recharge well — and I’ll see you sharp and ready next week for more structure-led opportunities.
📌 Pattern Breakdown
This setup delivered exactly what we watch for:
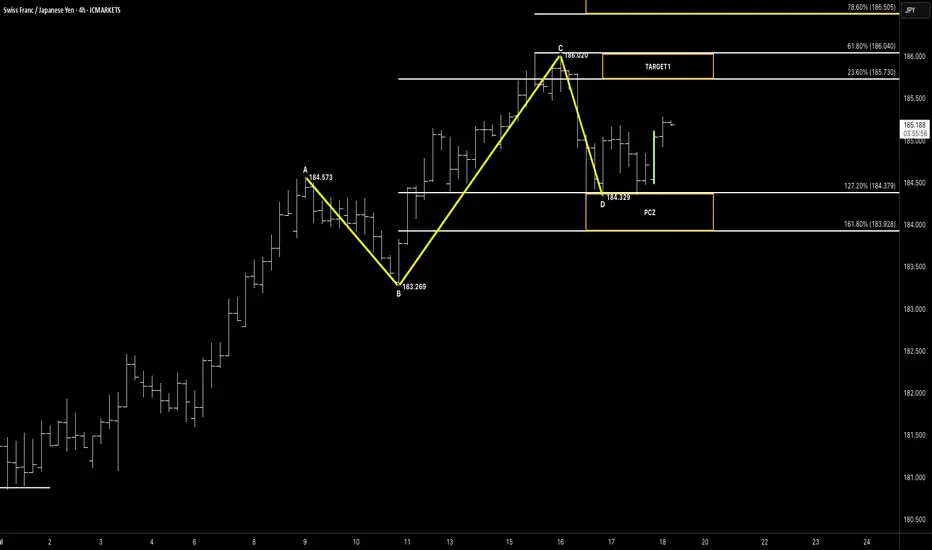
🔹 Classic ABC structure with clean symmetry
🔹 CD leg completed directly into the Potential Completion Zone (PCZ)
• 127.2% BC = 184.379
• 161.8% BC = 183.928
🔹 Price tagged 184.329 and showed a strong, clean bullish rejection right from the zone
It’s a confirmation of intent — but the job’s not done just yet.
🎯 Next Levels in Focus
🚫 Target 1 has not yet been hit, but structure is holding well.
🎯 Target 1 Range: 185.73 – 186.04
🎯 Target 2 (extension): 186.50 – 187.10
As we head into close, this becomes a management decision:
🔸 Let partials run if you’re in
🔸 Stay flat if you missed entry — wait for next week’s confirmation or pullback opportunity
🧠 Key Concepts in Play
✅ Symmetry-based ABC pattern
✅ PCZ precision and confirmed bullish rejection
✅ Momentum building, but still below TP1
✅ Structure-based trade with defined targets and invalidation
🗝 Final Thoughts
This is a textbook end-of-week setup: clean structure, clear reaction, and patience now required.
Don’t force the next move — we’ve got rejection confirmation, now we let price follow through.
Target 1 is well-defined — and price is on its way. We'll reassess early next week for continuation toward the higher fib extensions.
“Rejection starts the move — but discipline finishes the trade.”
CHF/JPY BEST PLACE TO SELL FROM|SHORT
Hello, Friends!
CHF/JPY pair is in the uptrend because previous week’s candle is green, while the price is evidently rising on the 2H timeframe. And after the retest of the resistance line above I believe we will see a move down towards the target below at 184.005 because the pair overbought due to its proximity to the upper BB band and a bearish correction is likely.
Disclosure: I am part of Trade Nation's Influencer program and receive a monthly fee for using their TradingView charts in my analysis.
✅LIKE AND COMMENT MY IDEAS✅

CHFJPY Short Swing TradeOANDA:CHFJPY Short Trade, with my back testing of this strategy, it hits multiple possible take profits, manage your position accordingly.
This is good trade, don't overload your risk like greedy, be disciplined trader.
I manage trade on daily basis.
Use proper risk management
Looks like good trade.
Lets monitor.
Use proper risk management.
Disclaimer: only idea, not advice

CHFJPY | BullishCHFJPY has displayed bullish divergence on one hour timeframe.The stoploss has been defined.

CHFJPY Bullish FlagBulls are slowly regaining control across all JPY pairs. A liquidity grab down below to fill up bullish orders can be anticipated before a bullish continuation into the supply area.
