NZDCHF - Basic Fibo retracementBasic fibo reversal trades based on 2 entries
1st entry: Fibo 0.5 level - RR 1:3.2 - Risk: 100$
2nd entry: Fibo 0.618 level - RR 1:7.6 - Risk: 100$
Total Risk: 200$
Total Profit: 1000$
Total RR 1:5
CHFNZD trade ideas

NZD-CHF Short From Resistance! Sell!
Hello,Traders!
NZD-CHF is going up now
But will soon retest a
Horizontal resistance
Of 0.5487 from where
We a local bearish move
Is to be expected
Sell!
Like, comment and subscribe to help us grow!
Check out other forecasts below too!

NZDCHF bearisch ideaIdea based on the bearisch trend and supply zone.
I am not sure about, that, risk not too much :)
Good luck!

NZDCHF BUYI like the set up on this pair. Trend continuation.
The chart explains my analysis.
Happy First Day of Summer!

NZD/CHF BULLS ARE GAINING STRENGTH|LONG
Hello,Friends!
NZD/CHF downtrend evident from the last 1W red candle makes longs trades more risky, but the current set-up targeting 0.553 area still presents a good opportunity for us to buy the pair because the support line is nearby and the BB lower band is close which indicates the oversold state of the NZD/CHF pair.
✅LIKE AND COMMENT MY IDEAS✅

NZD-CHF Bullish Bias! Buy!
Hello,Traders!
NZD-CHF has retested
The horizontal support
Of 0.5399 and we are already
Seeing a bullish rebound
So I will be expecting
A further move up
Buy!
Like, comment and subscribe to help us grow!
Check out other forecasts below too!

Bullish NZDCHFAfter a testing a Major Weekly Supply/Demand zone NZD has a had a beautiful bullish candle close out of the consolidation on the 1HR time frame I’m bullish on this pair. Beautiful 0.618 Weekly Fibonacci Retracement. Long for a long time !

NZDCHF: Price Action Analysis & Bullish OutlookNZDCHF has formed two bullish patterns: initially, it was trading within a descending expanding wedge pattern, followed by the formation of a cup and handle pattern within this structure.
To consider buying the pair, it is advisable to wait for a breakout above the neckline of the cup and handle formation on the 4-hour chart.
A confirmation would be a 4-hour candle closing above 0.5433. If this occurs, a bullish trend continuation could be anticipated towards the levels of 0.5448 and 0.5460.

NZD/CHF For Bearish after finish pull-backwait for finish pull-back and creating lower high and then go short
or
wait for break current support at green arrow and then can go short
- General Trend is Down
- Current wave is pull-back for correction and creating lower high at red arrow or between fibo levels (50:61)

NZDCHF Bullish ReversalI am entering long on NZDCHF for the following reasons:
- We are in a current downtrend.
- The previous daily close is a bullish candle, a long lower shadow and tiny upper shadow.
- Price is predicted to pullback to the trendline here, at the very least.
My trade is Entry 0.54340, Stop Loss 0.54040, Take Profit 0.54650, 1:1 RR. This is considered to be a swing trade.

NZDCHF: Will Keep Growing! Here is Why
Balance of buyers and sellers on the NZDCHF pair, that is best felt when all the timeframes are analyzed properly is shifting in favor of the buyers, therefore is it only natural that we go long on the pair.
❤️ Please, support our work with like & comment! ❤️

PREMIUM We’re looking at a Bearish trend all through the coming week since price is at a monthly premium zone with no indication of it going past that point we’re looking for a reversal to push price lower

NZDCHFTo provide a detailed analysis and trading strategy for NZD/CHF moving towards daily support:
Analysis
Current Market Context: NZD/CHF is approaching a significant support zone on the daily chart.
Support Range: 0.54324 to 0.54150.
Stop-Loss: Recommended to place the stop-loss slightly below the support to avoid premature exit due to potential price wicks.
Trading Strategy
Entry Point: Consider entering a buy position within the range of 0.54324 to 0.54150.
Stop-Loss: Place the stop-loss slightly below the support range, for instance, around 0.54000. This will help to avoid being stopped out by minor market fluctuations.
Take-Profit: For a conservative target, aim for the next significant resistance level. For more aggressive targets, consider multiple take-profit levels as the price progresses.

NZDCHF On The Rise! BUY!
My dear friends,
Please, find my technical outlook for NZDCHF below:
The instrument tests an important psychological level 0.5459
Bias - Bullish
Technical Indicators: Supper Trend gives a precise Bullish signal, while Pivot Point HL predicts price changes and potential reversals in the market.
Target - 0.5514
Recommended Stop Loss - 0.5427
About Used Indicators:
Super-trend indicator is more useful in trending markets where there are clear uptrends and downtrends in price.
———————————
WISH YOU ALL LUCK

NZDCHF A Fall Expected! SELL!
My dear friends,
Please, find my technical outlook for NZDCHF below:
The instrument tests an important psychological level 0.5534
Bias - Bearish
Technical Indicators: Supper Trend gives a precise Bearish signal, while Pivot Point HL predicts price changes and potential reversals in the market.
Target - 0.5506
About Used Indicators:
Super-trend indicator is more useful in trending markets where there are clear uptrends and downtrends in price.
———————————
WISH YOU ALL LUCK

NZDCHF LONGPrice Action Day Trading
H4 Bias: Bullish
H4 created a new high and higher low breaking and closing about previous swing high.
H1 TF, Price retrace back to H1 support level targeting Daily Swing high.
Setup: H1 support & broken bearish Trendline confluence area is a good spot for set up for long trade. Targeting Daily swing high 1:10 RR with SL slightly below the support level

NZDCHF Short Term Buy IdeaH4 - Bullish trend pattern
Currently it looks like a pullback is happening
Until the strong support zone holds my short term view remains bullish here.

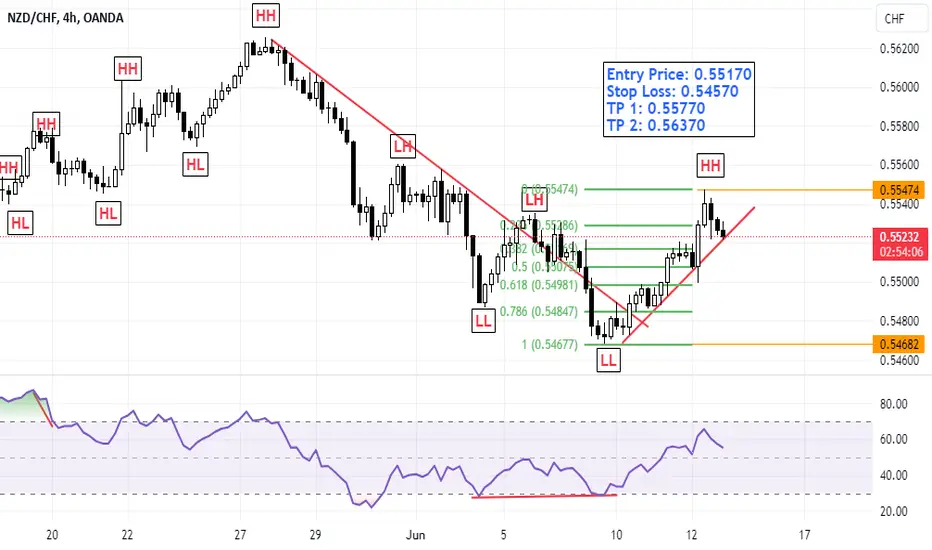
NZDCHF-Position for LongThe pair broke it's downtrend on 4H timeframe and made a HH. Currently the pair is on it's way to print it's HL at 0.38 fib retracement (high probability). After hitting the fib level wait for some bullish candle foramtion before taking an entry. The mentioned levels are of fib retracement with SL and TP.
NZD/CHF For Bearish you can go short now and take any target
- General Trend is Down
- Price Created Lower High
- Price Finish pull-back
- CHF is Strong
have fun :)

The NZDCHF IS A SHORTDo to the fact that NZDCHF finance record from price action shows that it as always been weak .. and its recent up move from last year August was built on a random economics event.. and finally the CHF economics news exposed it's weak accounting shown on the price action

Heading into an overlap resistance, could it reverse from here?NZD/CHF is rising towards the pivot which has been identified as an overlap resistance and could reverse to the 1st support.
Pivot: 0.55294
1st Support: 0.54666
1st Resistance: 0.55747
Risk Warning:
Trading Forex and CFDs carries a high level of risk to your capital and you should only trade with money you can afford to lose. Trading Forex and CFDs may not be suitable for all investors, so please ensure that you fully understand the risks involved and seek independent advice if necessary.
Disclaimer:
The above opinions given constitute general market commentary, and do not constitute the opinion or advice of IC Markets or any form of personal or investment advice.
Any opinions, news, research, analyses, prices, other information, or links to third-party sites contained on this website are provided on an "as-is" basis, are intended only to be informative, is not an advice nor a recommendation, nor research, or a record of our trading prices, or an offer of, or solicitation for a transaction in any financial instrument and thus should not be treated as such. The information provided does not involve any specific investment objectives, financial situation and needs of any specific person who may receive it. Please be aware, that past performance is not a reliable indicator of future performance and/or results. Past Performance or Forward-looking scenarios based upon the reasonable beliefs of the third-party provider are not a guarantee of future performance. Actual results may differ materially from those anticipated in forward-looking or past performance statements. IC Markets makes no representation or warranty and assumes no liability as to the accuracy or completeness of the information provided, nor any loss arising from any investment based on a recommendation, forecast or any information supplied by any third-party.

NZD CHF - Long Set UpLooks like a reversal on 1H TF. Have my entry on break of HH. Have my buy stop / entry at 0.54989.
Entry 0.54989
Stoploss 0.54863
TP-1 0.55119
TP-2 0.55247
#Trading #Technical #Crypto #Stocks #commodities

shortAfter a new lower low we are currently retesting the resistance zone with at the some zone the fib lvl
