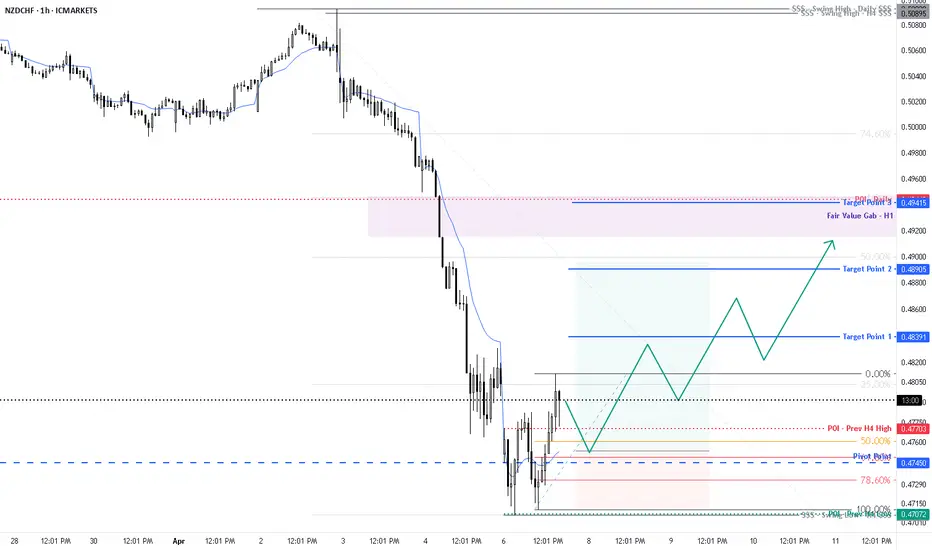
NZDCHDFundamental bias bullish
Technical analysis ;breached the resistance area heading to next resistance level
Bias bullish BUY
levels mentioned in charts
good luck
CHFNZD trade ideas

NZD-CHF Bullish Breakout! Buy!
Hello,Traders!
NZD-CHF made a bullish
Breakout of the key horizontal
Level of 0.4880 which is now
A support and as the breakout
Is confirmed we are locally
Bullish biased and we will
Be expecting further growth
After a potential local pullback
Buy!
Comment and subscribe to help us grow!
Check out other forecasts below too!
Disclosure: I am part of Trade Nation's Influencer program and receive a monthly fee for using their TradingView charts in my analysis.

NZD/CHF For Bullish as Pull-Backwait for pull-back near by entry point and then go long
general trend is down trend
current phase is pull-back
have fun :)

NZDCHF market outlookFX:NZDCHF
NZDCHF has came back and reached above its neck level of the QM pattern the second time, also having several demand zones reached and respected, pushing price upwards and forming a compression. We can keep an eye out on this pair and make decisions when it reaches the resistance zone once again. There are two possible scenarios that could happen, if it’s able to break above the resistance zone and close bullish candles, we can look for long opportunities and buy it to resistance 2 which is at 0.49630. If there is a strong rejection from resistance, we can then look for pullback and enter on shorts.
However, due to the fact that NZDCHF is still very bearish on the H4 and Daily timeframes, our bias should be bearish and prioritize selling opportunities. On sell trades, we may be able to hold the position longer and target different take profit levels.

NZDCHFCrab pattern daily engulfing: look for buy opportunities on a smaller time frame. The market will fill the order block.

NZD/CHF "Kiwi-Franc" Forex Bank Heist Plan (Scalping/Day Trade)6 hours ago
🌟Hi! Hola! Ola! Bonjour! Hallo! Marhaba!🌟
Dear Money Makers & Robbers, 🤑 💰💸✈️
Based on 🔥Thief Trading style technical and fundamental analysis🔥, here is our master plan to heist the NZD/CHF "Kiwi vs Franc" Forex Market. Please adhere to the strategy I've outlined in the chart, which emphasizes long entry. Our aim is to escape near the high-risk ATR Zone. Risky level, overbought market, consolidation, trend reversal, trap at the level where traders and bearish robbers are stronger. 🏆💸"Take profit and treat yourself, traders. You deserve it!💪🏆🎉
Entry 📈 : "The heist is on! Wait for the MA breakout (0.48700) then make your move - Bullish profits await!"
however I advise to Place Buy stop orders above the Moving average (or) Place buy limit orders within a 15 or 30 minute timeframe most recent or swing, low or high level for Pullback entries.
📌I strongly advise you to set an "alert (Alarm)" on your chart so you can see when the breakout entry occurs.
Stop Loss 🛑: "🔊 Yo, listen up! 🗣️ If you're lookin' to get in on a buy stop order, don't even think about settin' that stop loss till after the breakout 🚀. You feel me? Now, if you're smart, you'll place that stop loss where I told you to 📍, but if you're a rebel, you can put it wherever you like 🤪 - just don't say I didn't warn you ⚠️. You're playin' with fire 🔥, and it's your risk, not mine 👊."
📍 Thief SL placed at the recent/swing low level Using the 30mins timeframe (0.47600) Day trade basis.
📍 SL is based on your risk of the trade, lot size and how many multiple orders you have to take.
🏴☠️Target 🎯: 0.49900 (or) Escape Before the Target
🧲Scalpers, take note 👀 : only scalp on the Long side. If you have a lot of money, you can go straight away; if not, you can join swing traders and carry out the robbery plan. Use trailing SL to safeguard your money 💰.
💰💵💸NZD/CHF "Kiwi vs Franc" Forex Market Heist Plan (Scalping/Day) is currently experiencing a bullishness,., driven by several key factors. 👇👇👇
📰🗞️Get & Read the Fundamental, Macro, COT Report, Quantitative Analysis, Sentimental Outlook, Intermarket Analysis, Future trend targets and Overall outlook score..., go ahead to check 👉👉👉🔗
⚠️Trading Alert : News Releases and Position Management 📰 🗞️ 🚫🚏
As a reminder, news releases can have a significant impact on market prices and volatility. To minimize potential losses and protect your running positions,
we recommend the following:
Avoid taking new trades during news releases
Use trailing stop-loss orders to protect your running positions and lock in profits
💖Supporting our robbery plan 💥Hit the Boost Button💥 will enable us to effortlessly make and steal money 💰💵. Boost the strength of our robbery team. Every day in this market make money with ease by using the Thief Trading Style.🏆💪🤝❤️🎉🚀
I'll see you soon with another heist plan, so stay tuned 🤑🐱👤🤗🤩

NZD/CHF For Bullish as Pull-back wavewait for pull-back near by entry point and then go long
general trend is up trend
current phase is pull-back
have fun :)


NZDCHF💡Chart analysis of the NZD/CHF currency pair (4-hour timeframe). The price is in a strong demand zone. The trader is waiting for a bullish candle to close to confirm the entry. The target is to reach previous resistance areas (swing highs). MACD indicator: The selling momentum on the indicator is beginning to weaken, supporting the bullish trend.
⛔️Not investment advice. For educational purposes only.

NZDCHF BUY?RSI on daily time frame is showing oversold which could be a sign of exhaustion.
Based on Daily & 4HR TF, the market seems to be forming a possible reversal pattern which could lead to a possible reversal.
We could see BUYERS coming in strong should the current level hold.
Disclaimer:
Please be advised that the information presented on TradingView is solely intended for educational and informational purposes only.The analysis provided is based on my own view of the market. Please be reminded that you are solely responsible for the trading decisions on your account.
High-Risk Warning
Trading in foreign exchange on margin entails high risk and is not suitable for all investors. Past performance does not guarantee future results. In this case, the high degree of leverage can act both against you and in your favor

Bullish bounce?NZD/CHF is falling towards the pivot and could bounce to the 1st resistance.
Pivot: 0.47071
1st Support: 0.46347
1st Resistance: 0.47992
1st Resistance: 1.1089
Risk Warning:
Trading Forex and CFDs carries a high level of risk to your capital and you should only trade with money you can afford to lose. Trading Forex and CFDs may not be suitable for all investors, so please ensure that you fully understand the risks involved and seek independent advice if necessary.
Disclaimer:
The above opinions given constitute general market commentary, and do not constitute the opinion or advice of IC Markets or any form of personal or investment advice.
Any opinions, news, research, analyses, prices, other information, or links to third-party sites contained on this website are provided on an "as-is" basis, are intended only to be informative, is not an advice nor a recommendation, nor research, or a record of our trading prices, or an offer of, or solicitation for a transaction in any financial instrument and thus should not be treated as such. The information provided does not involve any specific investment objectives, financial situation and needs of any specific person who may receive it. Please be aware, that past performance is not a reliable indicator of future performance and/or results. Past Performance or Forward-looking scenarios based upon the reasonable beliefs of the third-party provider are not a guarantee of future performance. Actual results may differ materially from those anticipated in forward-looking or past performance statements. IC Markets makes no representation or warranty and assumes no liability as to the accuracy or completeness of the information provided, nor any loss arising from any investment based on a recommendation, forecast or any information supplied by any third-party.

NZD/CHF For Bullish as Pull-backyou can go long now
or
wait for pull-back near by entry point and then go long
general trend is down trend
current phase is pull-back
have fun :)

NZDCHF May Drop, Here is WHY 🇳🇿🇨🇭
NZDCHF is trading in a strong bearish trend on a daily.
After a yesterday's pullback caused by FOMC,
the price reached a key horizontal resistance.
After a consolidation on that, the pair leaves clear bearish clues.
I see a formation of a bearish imbalance candle and a remaining
bearish pressure after US CPI.
Chances are high that the pair will drop at least to 0.4712
❤️Please, support my work with like, thank you!❤️

NZD/CHF For Bullishyou can go long now
general trend is down trend
current phase is pull-back
have fun :)

NZDCHF: Intraday Bearish PatternNZDCHF has good potential for further decline. After a strong bearish wave, the pair was consolidating within a horizontal range on an 4H time frame.
The support of this range was recently broken, signaling the strength of sellers and a likely continuation of bearish momentum.
I believe the pair could soon reach the 0.4621 level. On the 4-hour time frame, I will be monitoring the price action closely.

NZDCHF Is About To DROP 300+ Pips!!!Based On My Trading Algorithms NZDCHF Is About To DROP 300+ Pips!!!

NZD/CHF Ready To Go Down Hard , Don`t Miss 250 Pips !Here is my chart on NZD/CHF And it`s very clear short setup after this amazing bearish closure below my second support , so i think this pair will go down hard for the next days and weeks , let`s sell this pair and see what will happen !
This Is An Educational + Analytic Content That Will Teach Why And How To Enter A Trade
Make Sure You Watch The Price Action Closely In Each Analysis As This Is A Very Important Part Of Our Method
Disclaimer : This Analysis Can Change At Anytime Without Notice And It Is Only For The Purpose Of Assisting Traders To Make Independent Investments Decisions.

Carry Trade Imbalance NZD/CHFNZD has a high interest rate (around 5.5% as of 2025), as New Zealand is battling inflation and maintaining tight monetary policy.
CHF has a very low or even negative interest rate (Switzerland traditionally keeps rates low due to deflationary tendencies and currency stability).
📉 Current Imbalance:
The NZD/CHF currency pair is at historically low levels, meaning the Swiss franc is too strong relative to the New Zealand dollar.
This is a fundamental imbalance, because NZD should be stronger (higher yield = more attractive asset). and gain big SWAP
💼 Carry Trade:
This is a perfect setup for a carry trade: borrow CHF at low interest and invest in NZD at high interest.
When this type of trading becomes popular, it puts upward pressure on the pair – NZD is bought, CHF is sold.
📈 Conclusion:
NZD/CHF has potential to rise:
To correct the fundamental imbalance.
Because the market may shift toward carry trades.
If central banks (especially SNB) remain dovish, while RBNZ stays hawkish.

NZDCHF LONG POSITIONLooking at a long poition on this pair, we have cleared internal liquidity which we are now expecting a run to the upside.

NZDCHF: Will Start Falling! Here is Why:
The recent price action on the NZDCHF pair was keeping me on the fence, however, my bias is slowly but surely changing into the bearish one and I think we will see the price go down.
Disclosure: I am part of Trade Nation's Influencer program and receive a monthly fee for using their TradingView charts in my analysis.
❤️ Please, support our work with like & comment! ❤️

NZD/CHF For Bullishwait for pull-back near by entry point and then go long
general trend is up trend
have fun :)

NzdChf-GbpNzdThere is a small correlation between the two. If the zones hold and the highs/lows are broken then the analysis holds.
