CHF/SGD 4-HOUR TIMEFRAME LONGPrices on the CHF/SGD broke out of a interim downtrend on the daily chart, and we can anticipate further upwards movement. Price could find support on the 1.3650 if it forms a correctional structure in the form of a bear flag pattern, and then continue higher. Proper risk management is key especially when trading exotic currencies since there are huge margin requirements and they can be very volatile.
CHFSGD trade ideas


CHFSGD SHORT IDEAThis little setup caught my eye.
I personally wont trade this pair, as i dont trade exotics...
Thought i would just share if anyone else out there had a bearish view on this pair.
This isnt intended as a signal, just an idea.
Thank you.

CHFSGD LongTested the support in the 1.3435 area and broke the previous maximum. The direction is upward towards the target in area 1.39.
Here too I see the appreciation of the Swiss franc well this time against the Singapore dollar. The Heikin Ashi spark plugs are confirming me both in the daily and in the weekly a trend reversal and a start of a new bullish phase.


SDGCHF +300 Pips Short, Low risk high probabilityAnalysis should indicate loads of signs to go short
Feel free to ask any questions


SGD/CHF - Long Term ShortSGD/CHF is not holding strong and broke under the 50 EMA on the daily timeframe.
MACD daily has also crossed the zero line and we have convergence down.
AS the pair goes down, we will see how strong the bearish move is and wheter we can keep holding to the next TPs.
First TP: 0.7153
Second TP: 0.7105
Third TP: 0.7055
You must leave enough space for your SL. That is, put it above the daily 50 EMA, or simply, above the last daily candle close with a little bit of space to it.
Trade safe.

Ichimoku short setupOn the daily TF, price is making a lower high and a lower low. We have a rejection candle off the daily kijun and we have our entry confirmation from %R. We are expecting a bearish kumo twist in the next few days which could add further confirmation to our short trade. Furthermore, daily tenkan is currently pointing downward which suggests short term bearish momentum.

Ichimoku short setup: SGDCHFOn the daily TF, we have a rejection candle bouncing off the kijun sen. Chikou span is already below the price and we are expecting a bearish kumo twist within the next few days. The tenkan sen is angling downward which suggests long term bearish momentum. On the H1 TF, enter a short trade once prices closes below the support level drawn by the red line.
EP: 0.72120
SL: 0.72390
TP1: 0.71960
TP2: 0.71580


CHF/SGD 1H Chart: Slight downside potentialDownside risks have dominated the CHF/SGD currency pair since the end of September, and the pair breached a medium-term ascending channel north at the middle of October.
As apparent on the chart, the pair is being pressured by the 55-, 100– and 200-period SMAs on the 4H time frame. It is expected the pair continues to decline. An important support level to look out for is the Fibonacci 38.20% retracement at 1.3672.
If given level holds, most likely, the pair surges towards the Fibonacci 61.80% at 1.3895.


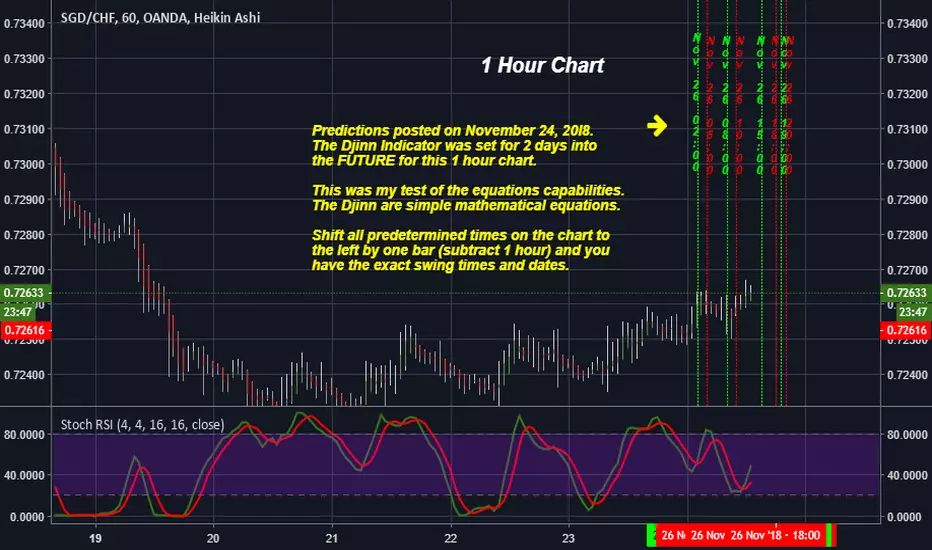
Mixed results test for 1 hour chartPredictions posted on November 24, 20I8.The Djinn Indicator was set for 2 days into the FUTURE for this 1 hour chart.
This was my test of the equations capabilities. The Djinn are simple mathematical equations.
Shift all predetermined times on the chart to the left by one bar (subtract 1 hour) and you have the exact swing times and dates.
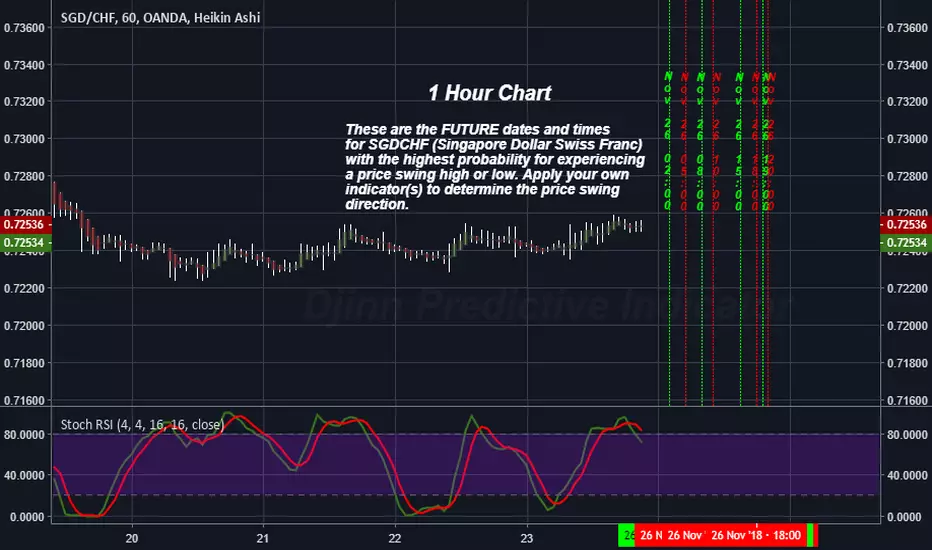
The FUTURE High / Low price swing dates and times for SGDCHFThese are the FUTURE dates and times for SGDCHF (Singapore Dollar Swiss Franc) with the highest probability for experiencing a price swing high or low. Apply your own indicator(s) to determine the price swing direction.
SGD/CHf Update To Last Post As expected bounced of support at 0.72882. Macd was also confirmed green bar under the zero line. Simple analysis that works come and follow me for more profitable trades.

SGD/CHF TRIPPLE BOTTOM 1HThis will be interesting. 0.72882 has been support three times recently. I be waiting for a bounce then go long on a lower time frame (15min)
