Bearish continuation for the Swissie?The price is rising towards the pivot which is a pullback resistance and could reverse to the pullback support.
Pivot: 0.8156
1st Support: 0.8054
1st Resistance: 0.8238
Risk Warning:
Trading Forex and CFDs carries a high level of risk to your capital and you should only trade with money you can afford to lose. Trading Forex and CFDs may not be suitable for all investors, so please ensure that you fully understand the risks involved and seek independent advice if necessary.
Disclaimer:
The above opinions given constitute general market commentary, and do not constitute the opinion or advice of IC Markets or any form of personal or investment advice.
Any opinions, news, research, analyses, prices, other information, or links to third-party sites contained on this website are provided on an "as-is" basis, are intended only to be informative, is not an advice nor a recommendation, nor research, or a record of our trading prices, or an offer of, or solicitation for a transaction in any financial instrument and thus should not be treated as such. The information provided does not involve any specific investment objectives, financial situation and needs of any specific person who may receive it. Please be aware, that past performance is not a reliable indicator of future performance and/or results. Past Performance or Forward-looking scenarios based upon the reasonable beliefs of the third-party provider are not a guarantee of future performance. Actual results may differ materially from those anticipated in forward-looking or past performance statements. IC Markets makes no representation or warranty and assumes no liability as to the accuracy or completeness of the information provided, nor any loss arising from any investment based on a recommendation, forecast or any information supplied by any third-party.
CHFUSD trade ideas

UsdchfI posted this trade few days ago and this is the out come of the market we are close to tp lol back to back tp

USDCHF resistance retest at 0.8195 The USD/CHF pair is currently trading with a bearish bias, aligned with the broader downward trend. Recent price action shows a retest of the falling resistance, suggesting a temporary relief rally within the downtrend.
Key resistance is located at 0.8195, a prior consolidation zone. This level will be critical in determining the next directional move.
A bearish rejection from 0.8195 could confirm the resumption of the downtrend, targeting the next support levels at 0.8100, followed by 0.8065 and 0.8035 over a longer timeframe.
Conversely, a decisive breakout and daily close above 0.8195 would invalidate the current bearish setup, shifting sentiment to bullish and potentially triggering a move towards 0.8215, then 0.8240.
Conclusion:
The short-term outlook remains bearish unless the pair breaks and holds above 0.8195. Traders should watch for price action signals around this key level to confirm direction. A rejection favours fresh downside continuation, while a breakout signals a potential trend reversal or deeper correction.
This communication is for informational purposes only and should not be viewed as any form of recommendation as to a particular course of action or as investment advice. It is not intended as an offer or solicitation for the purchase or sale of any financial instrument or as an official confirmation of any transaction. Opinions, estimates and assumptions expressed herein are made as of the date of this communication and are subject to change without notice. This communication has been prepared based upon information, including market prices, data and other information, believed to be reliable; however, Trade Nation does not warrant its completeness or accuracy. All market prices and market data contained in or attached to this communication are indicative and subject to change without notice.

USDCHF – Short Setup Following 5-Wave CompletionUSDCHF Sell Limit
Entry: 0.8185
Target: 0.8117
Stop Loss: 0.8210
Duration: Intraday
Expires : 24/06/2025 08:00
Technical Overview
A 5-wave bullish Elliott Wave sequence appears to have completed at 0.8216, suggesting a corrective phase may follow.
Price is testing bespoke resistance at 0.8185, where we anticipate fresh selling interest.
Although mild early-session buying is possible, upside is expected to be limited, and the broader view favors further downside.
We prefer to initiate short positions early, targeting a move back toward 0.8117.
Two key U.S. PMI reports (Manufacturing & Services) are scheduled for 16:45 UTC, potentially adding short-term volatility.
Key Technical Levels
Resistance: 0.8185 / 0.8210 / 0.8216
Support: 0.8140 / 0.8117 / 0.8085
Disclosure: I am part of Trade Nation's Influencer program and receive a monthly fee for using their TradingView charts in my analysis.

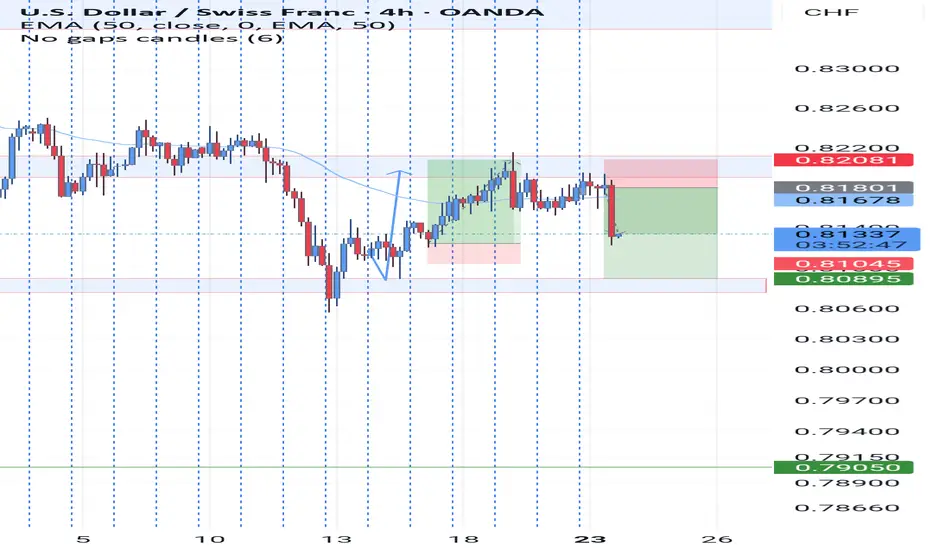
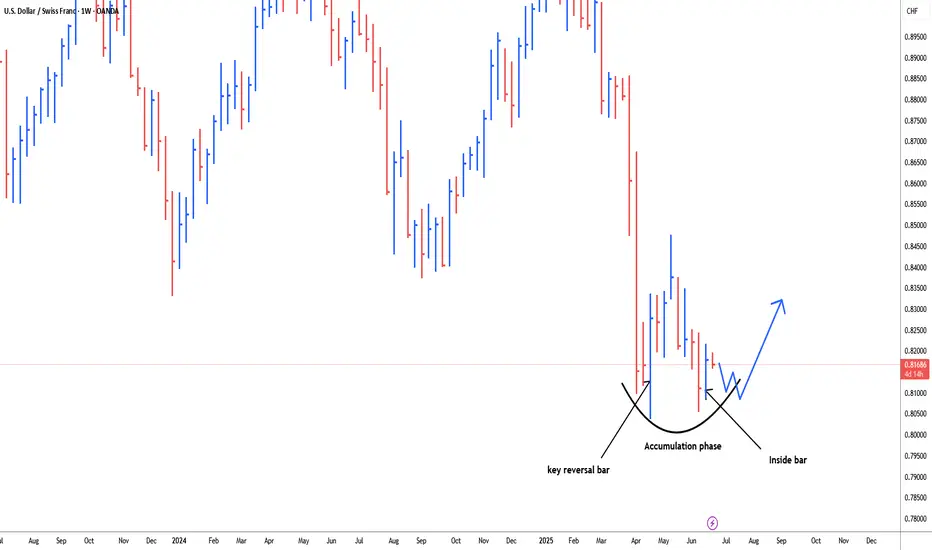
USDCHF weekly accumulation phase for bullish reversal#usdchf 21st weekly bar is a key reversal bar, made a new low closed towards high. 16th June weekly inside bar range confined within the range of the previous previous bar i.e. did not make high or low by the previous bar. need a lot of patience for good profit in usdchf long position reason trend is quite bearish. market takes time to neutralize the trend and to reverse it. 0.8137-0.8120 is 4h demand zone within the weekly chart. 0.8220-0.8250 need to break to the upside for further confirmation of trend change.
USDCHF LONGI check the support and resistance and the trend line that brake.
the situation of market and conflicts shows that usd wants to move Up.

USD/CHF H4 | Potential bounce off a pullback supportUSD/CHF is falling towards a pullback support and could potentially bounce off this level to climb higher.
Buy entry is at 0.8145 which is a pullback support that aligns with the 38.2% Fibonacci retracement.
Stop loss is at 0.8085 which is a level that lies underneath a swing-low support and the 61.8% Fibonacci retracement.
Take profit is at 0.8238 which is a multi-swing-high resistance that aligns with the 61.8% Fibonacci retracement.
High Risk Investment Warning
Trading Forex/CFDs on margin carries a high level of risk and may not be suitable for all investors. Leverage can work against you.
Stratos Markets Limited (tradu.com ):
CFDs are complex instruments and come with a high risk of losing money rapidly due to leverage. 63% of retail investor accounts lose money when trading CFDs with this provider. You should consider whether you understand how CFDs work and whether you can afford to take the high risk of losing your money.
Stratos Europe Ltd (tradu.com ):
CFDs are complex instruments and come with a high risk of losing money rapidly due to leverage. 63% of retail investor accounts lose money when trading CFDs with this provider. You should consider whether you understand how CFDs work and whether you can afford to take the high risk of losing your money.
Stratos Global LLC (tradu.com ):
Losses can exceed deposits.
Please be advised that the information presented on TradingView is provided to Tradu (‘Company’, ‘we’) by a third-party provider (‘TFA Global Pte Ltd’). Please be reminded that you are solely responsible for the trading decisions on your account. There is a very high degree of risk involved in trading. Any information and/or content is intended entirely for research, educational and informational purposes only and does not constitute investment or consultation advice or investment strategy. The information is not tailored to the investment needs of any specific person and therefore does not involve a consideration of any of the investment objectives, financial situation or needs of any viewer that may receive it. Kindly also note that past performance is not a reliable indicator of future results. Actual results may differ materially from those anticipated in forward-looking or past performance statements. We assume no liability as to the accuracy or completeness of any of the information and/or content provided herein and the Company cannot be held responsible for any omission, mistake nor for any loss or damage including without limitation to any loss of profit which may arise from reliance on any information supplied by TFA Global Pte Ltd.
The speaker(s) is neither an employee, agent nor representative of Tradu and is therefore acting independently. The opinions given are their own, constitute general market commentary, and do not constitute the opinion or advice of Tradu or any form of personal or investment advice. Tradu neither endorses nor guarantees offerings of third-party speakers, nor is Tradu responsible for the content, veracity or opinions of third-party speakers, presenters or participants.

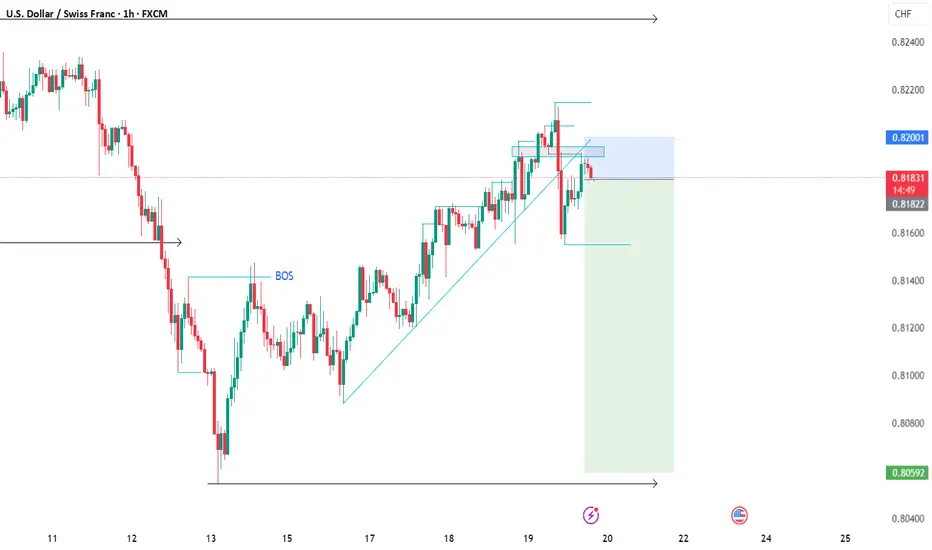
OANDA:USDCHF Sell SetupUSDCHF Sell Setup – Liquidity Grab & Trend Continuation
The USDCHF pair remains in a well-defined downtrend, characterized by a series of lower highs and lower lows. Recently, price pushed above a local structure high, triggering a liquidity grab—a classic move to sweep out stop losses and entice breakout buyers before reversing direction.
This fake-out aligns with the broader bearish trend and signals potential continuation to the downside as institutional players reclaim control post-liquidity hunt.
Market Insight:
Price manipulated above recent highs to collect liquidity
Bearish rejection confirms the move as a trap for late buyers
Momentum now favors a continuation toward lower demand zones
Trade Setup:
Entry: 0.81840 (Confirmed bearish rejection after liquidity sweep)
Stop Loss: Above the swing highs (protective buffer against further manipulation)
Target Levels:
Take Profit 1: 0.81643
Take Profit 2: 0.81575
Take Profit 3: 0.80694
Maintain proper risk management and allow the trade room to breathe, especially with stops placed above manipulated highs. This setup offers a strong risk-to-reward profile aligned with both market structure and institutional behavior.
Feel free to share your analysis or feedback in the comments. If you find this helpful, don’t forget to boost and follow for more trade breakdowns. Trade smart and stay consistent!

USDCHF H4 AnalysisUSDCHF Showing a Bearish Flag. If it breaks this zone above, Most probably can fly up to 0.82512 and higher to 0.83491. If no, Can rally between 0.80552 or even lower. Trading Analysis from 23-06-25 to 27-06-25. Take your risk under control and wait for market to break support or resistance on smaller time frame. Best of luck everyone and happy trading.🤗

USDCHF ED is coming to an end soon well i you see that this sideways on the pair of USDCHF is coming to an end soon i hope thats the pattern that in play . will update this one if the pattern is invalidated but i think it will not :) .
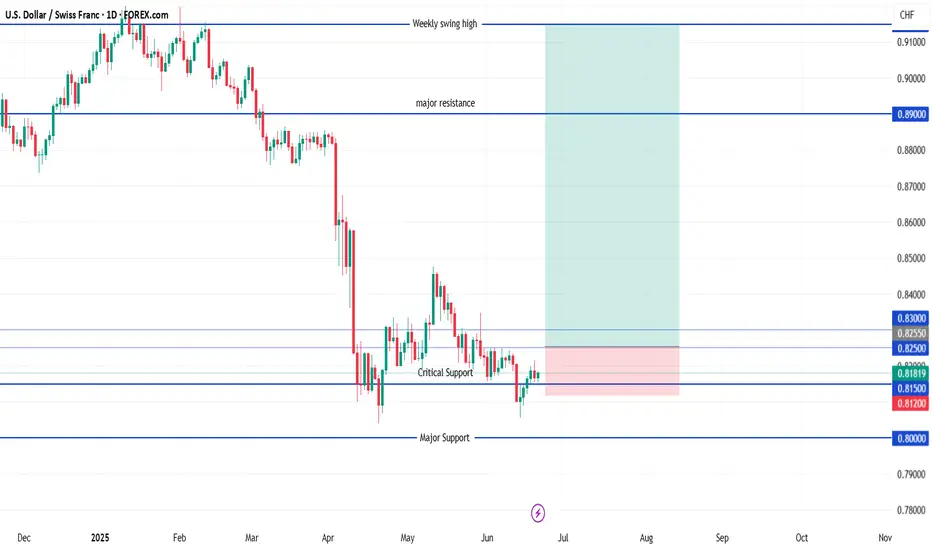
USD/CHF Buy🎯 Long Entry Strategy
🔸 Standard (Conservative) Breakout Entry
Entry: 0.8255 (daily close above key compression + reclaim zone)
Stop Loss: 0.8120 (below 0.8150 structure + most recent wick low)
Target 1: 0.8300 (minor resistance)
Target 2: 0.8900 (major weekly resistance)
Target 3 (Optional Hold): 0.9150 (weekly swing high)
✅ Best if you want confirmation. Higher probability but less RR.
🔸 Aggressive Limit Entry (Inside Range)
Entry: 0.8155 (retest of support zone)
Stop Loss: 0.8040 (below April + June wick lows)
Target 1: 0.8300
Target 2: 0.8900
Target 3: 0.9150
⚠️ Best for RR, but higher chance of drawdown or stop-out.
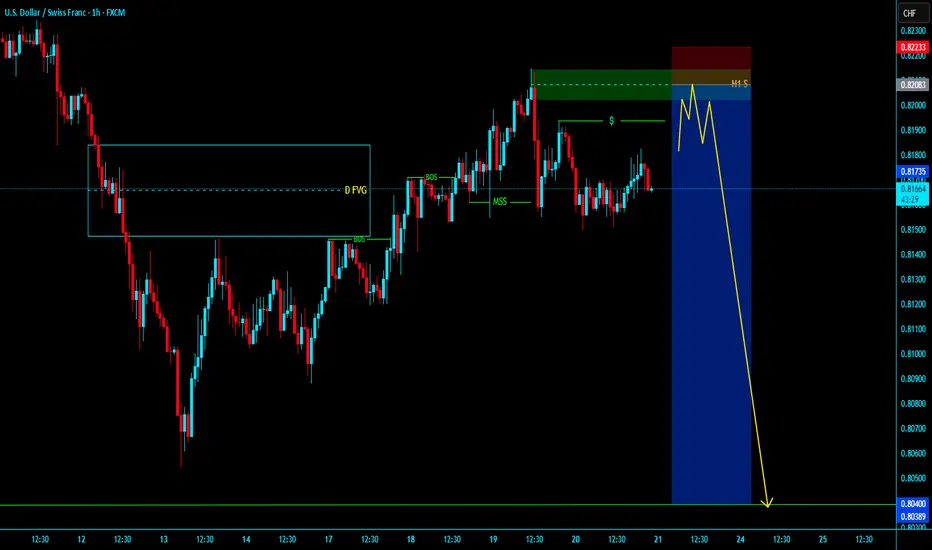
USDCHF 15M ANALYSISThe analysis of my next trade works like this
Our entry is: BULLISH
(1) The 4H trendline broke
(2) We retested the 4H support
(3) We wait for a break and retest of our most recent 15 minute support
(4) We comfirm the bullish direction with our volume indicator (we want to see big volume that surprasses the 20 ema that is included in the volume indicator) and a bullish candlestick close.
IF YOU LIKED THE ANALYSIS PLEASE DROP A FOLLOW

Trade Idea: Sell USD/CHF
**Why Sell?**
**CHF (Swiss Franc):**
* Still strong this year — up 11% vs USD.
* SNB cut rates, but franc hasn’t weakened much.
* Inflation is low, and growth is weak — SNB might cut again, but no big surprise expected.
* Risk of intervention if the franc gets too strong.
**USD (U.S. Dollar):**
* U.S. economy is slowing down.
* Inflation is still high but not rising.
* Fed is on pause — no hikes expected soon.
* Traders are already betting against the dollar.
---
**Market Mood:**
* USD/CHF is calm but slowly drifting lower.
* No big moves yet, but pressure is building on the dollar.
---
**Outlook:**
This pair could slide lower if the dollar stays weak. It’s not a fast mover, but the setup favors more downside.
---
**Note:**
> *“Not a flashy setup, but dollar looks heavy. Could drop more if momentum builds.”*

USDCHF-bias long Bullish indications:
Major support respected.
Inverted hammer in daily
Trend line resistance is broken.
IHS formation from the support.
formed IHS in higher low in 5 min.
4 hr : inverted hammer candle .
Bearish indications:
LLLH
Trade plan bias long @ 0.81701
SL:0.8154
TP1:0.8186
TP2:0.8201

USD/CHF Very Near Buying Area , Let`s Get This 200 Pips !Here is my opinion on USD/CHF , The price very near support area that forced the price to go up last time more than 500 pips , so it`s a very strong Area to buy it again if the price give us a good bullish price action , and we can targeting 250 pips .

# USDCHF H1 SUPPLY WITH LIQUIDITY # USDCHF H1 Supply with valid liquidity entry with proper SL and target HTF SSL
Usdchf I posted this trade few days ago but I didn't have entry but we had entry after the broke out and it was pretty great but am expecting a bearish movement soon to the down side

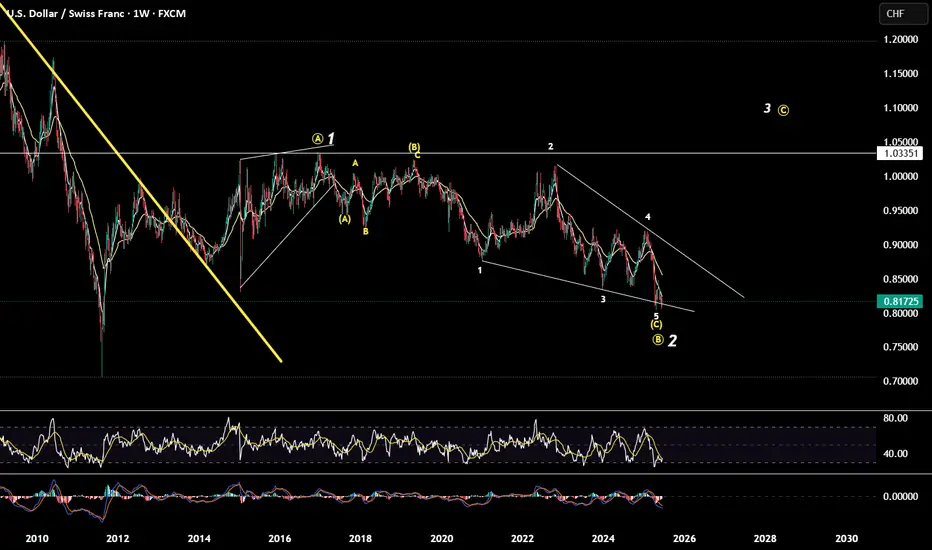
USDCHF || Grab trade before its end" – Upgrade Suggestions:" USDCHF correcting into demand zone 📉 Wave (C) incoming! Watch for the final leg before the reversal. Don’t miss this precision setup. 💥 #ElliottWave #USDCHF #ForexSetup"
🟢 Technical Breakdown:
Triangle Formation (ABCDE) completed near the top.
Price action shows a breakdown from Wave (B), suggesting a corrective leg is underway.
You’ve marked:
Wave (A) and (B) already formed.
Wave (C) is expected to reach the highlighted demand zone (blue box around 0.81000).
The current price is around 0.81633, indicating an ideal entry area for a short setup targeting the blue zone.

USDCHF H4 I Bullish Bounce Off the 50% FibBased on the H4 chart analysis, we can see that the price is falling toward our buy entry at 0.8145, which is an overlap support that aligns closely with the 38.2% Fib retracement.
Our take profit will be at 0.8208, an overlap resistance level.
The stop loss will be placed at 0.8088, which is a swing high low level.
High Risk Investment Warning
Trading Forex/CFDs on margin carries a high level of risk and may not be suitable for all investors. Leverage can work against you.
Stratos Markets Limited (tradu.com ):
CFDs are complex instruments and come with a high risk of losing money rapidly due to leverage. 63% of retail investor accounts lose money when trading CFDs with this provider. You should consider whether you understand how CFDs work and whether you can afford to take the high risk of losing your money.
Stratos Europe Ltd (tradu.com ):
CFDs are complex instruments and come with a high risk of losing money rapidly due to leverage. 63% of retail investor accounts lose money when trading CFDs with this provider. You should consider whether you understand how CFDs work and whether you can afford to take the high risk of losing your money.
Stratos Global LLC (tradu.com ):
Losses can exceed deposits.
Please be advised that the information presented on TradingView is provided to Tradu (‘Company’, ‘we’) by a third-party provider (‘TFA Global Pte Ltd’). Please be reminded that you are solely responsible for the trading decisions on your account. There is a very high degree of risk involved in trading. Any information and/or content is intended entirely for research, educational and informational purposes only and does not constitute investment or consultation advice or investment strategy. The information is not tailored to the investment needs of any specific person and therefore does not involve a consideration of any of the investment objectives, financial situation or needs of any viewer that may receive it. Kindly also note that past performance is not a reliable indicator of future results. Actual results may differ materially from those anticipated in forward-looking or past performance statements. We assume no liability as to the accuracy or completeness of any of the information and/or content provided herein and the Company cannot be held responsible for any omission, mistake nor for any loss or damage including without limitation to any loss of profit which may arise from reliance on any information supplied by TFA Global Pte Ltd.
The speaker(s) is neither an employee, agent nor representative of Tradu and is therefore acting independently. The opinions given are their own, constitute general market commentary, and do not constitute the opinion or advice of Tradu or any form of personal or investment advice. Tradu neither endorses nor guarantees offerings of third-party speakers, nor is Tradu responsible for the content, veracity or opinions of third-party speakers, presenters or participants.

USD/CHF Breaks Channel USD/CHF has successfully broken out of its descending channel and retested the upper boundary near 0.81679.
As long as this level holds, bullish continuation is favored.
Potential upside targets:
📍 First: 0.82154
📍 Second: 0.82510
📍 Extension: 0.84608 (if momentum accelerates)
A drop below 0.81292 would invalidate the bullish structure.
This is a technical analysis idea – not financial advice.


USDCHF SELLWe have officially gotten a change of trend as proven by the transition from a sequence of higher highs and higher lows to a lower low and lower high. Stacked on top of this sequence is a pullback for a retest of a key level confirming our setup.