USDCHF Buy Setup 19-06-2025It appears that USD/CHF has broken above the downtrend and is expected to remain bullish following a period of consolidation.
TP and SL are marked.
Risk no more than 1%.
Swing trade setup, so stay patience
CHFUSD trade ideas

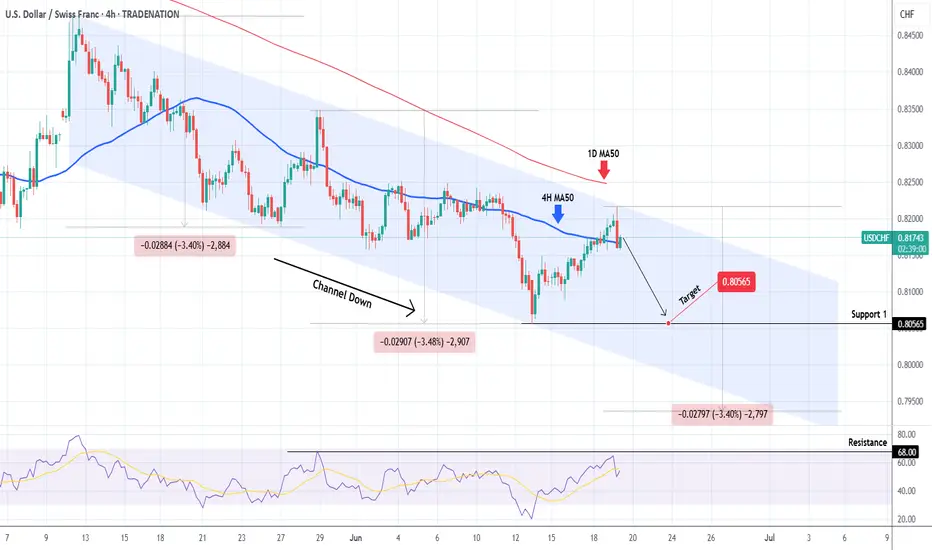
USDCHF Channel Down reached its top. Sell signal.The USDCHF pair has been trading within a Channel Down pattern since the May 12 High and today the price hit its top again. Trading above its 4H MA50 (blue trend-line) but still below the 1D MA50 (red trend-line), that maintains the medium-term bearish trend.
This is a strong bearish signal as it technically indicates that the new Bearish Leg is about to start. Support 1 at 0.80565 is a low risk Target. The previous 2 Bearish Legs have both gone for -3.40% declines, so technically the downside can be extended beyond Support 1.
-------------------------------------------------------------------------------
** Please LIKE 👍, FOLLOW ✅, SHARE 🙌 and COMMENT ✍ if you enjoy this idea! Also share your ideas and charts in the comments section below! This is best way to keep it relevant, support us, keep the content here free and allow the idea to reach as many people as possible. **
-------------------------------------------------------------------------------
Disclosure: I am part of Trade Nation's Influencer program and receive a monthly fee for using their TradingView charts in my analysis.
💸💸💸💸💸💸
👇 👇 👇 👇 👇 👇
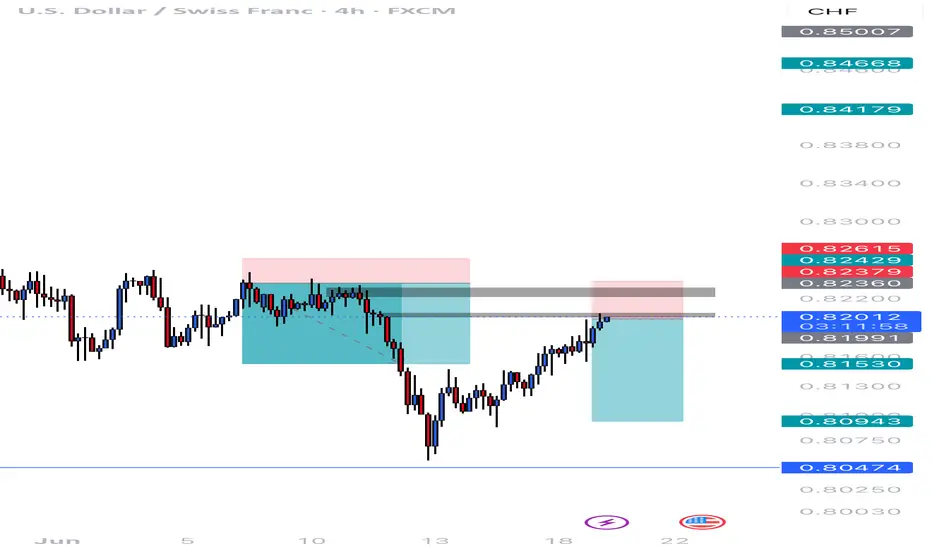
USD/CHF Breaks Channel USD/CHF has broken out of its descending channel and successfully retested the broken trendline.
Now trading above key support at 0.81679 – 0.81750, the pair may continue upward if this zone holds.
Bullish targets lie at 0.82154 and 0.82510.
A break below 0.81292 would invalidate this scenario and expose downside risk.

Long USDCHF on a dovish SNBWe got the SNB central bank rate decision later on today. Switzerland YoY inflation is in negative territory at -0.10%.
tradingeconomics.com
The strength of the CHF is an issue for the SNB. They are scheduled to cut rate by 25 BPS (to 0.0%) with a probability of 77% but there is 23% chance of a 50 BPS cut (to -0.25%) which would be very dovish for the Swiss Franc.
If we get a surprise 50 BPS cut, I will get into USDCHF long.
The negative is pretty much priced in for the USD. The economy is holding and the Fed is expecting a surge in inflation from tariffs.
ibb.co
Here is the 2Y/10Y Yield differentials on USDCHF. It is pointing to the upside.
The biggest risk for the trade is of course risk off sentiment from the war in the middle east. If US gets involve, we could see some flow in the CHF but USD could see some flow too.
Pay close attention to the SNB meeting later.
USDCHF daily Cls model 1 Target sl setUSDCHF Trade Setup Alert 🚨
Entry Confirmed ✅ | Target Locked In 🎯 | SL in Place for Risk Control 🛡️
We’ve set our eyes on the next move for USDCHF – trade smart, not emotional.
🔹 Target: [86034
🔹 Stop Loss: 80030
Watch the price action closely — let the strategy play out! 📊📈
#USDCHF #ForexSignals #TradingSetup #RiskManagement #TradingView
USDCHF BULLISHTrade Setup Details for USD/CHF (4H Chart)
Overview
Pair: USD/CHF (US Dollar / Swiss Franc)
Timeframe: 4H (4-hour chart)
Date of Analysis: April 23, 2022
Current Price: 0.82920 (as shown on the chart)
Market Sentiment: Bullish (indicated by "Bullish Divergence" on the RSI)
Trade Setup
Trade Type: Buy
Entry Point: 0.82792
The entry is marked just above the recent low, suggesting a potential reversal after the price broke below a descending trendline and retested a key support zone around 0.82790–0.82960.
Stop Loss: 0.80312
The stop loss is placed below the recent swing low, providing a buffer against further downside. This gives a risk of approximately 248 pips from the entry point.
Take Profit: 0.85265
The take profit is set at a key resistance level, aligning with previous highs around 0.85265. This offers a potential reward of approximately 247 pips from the entry point.
Risk-to-Reward Ratio: Approximately 1:1 (247 pips reward / 248 pips risk)
Technical Analysis
Price Action: The price has been in a downtrend, as indicated by the descending trendline. However, a break below this trendline followed by a retest suggests a potential reversal. The price is now approaching a key support zone between 0.82790 and 0.82960.
Support/Resistance:
Support: 0.82790–0.82960 (recent price action shows a bounce from this zone).
Resistance: 0.85265 (previous high, marked as the take profit level).
Indicators:
RSI (Relative Strength Index): The RSI is at 52.61, showing neutral momentum. However, a "Bullish Divergence" is noted, where the price made a lower low, but the RSI formed a higher low, indicating weakening bearish momentum and a potential reversal.
The RSI is also trending upward, supporting the bullish outlook.
Trendline: The descending trendline (drawn on the chart) has been broken, and the price is retesting this breakout area, which often acts as support after a breakout.
Trade Rationale
The setup is based on a combination of price action and technical indicators:
The break of the descending trendline suggests the downtrend may be losing steam.
Bullish divergence on the RSI indicates a potential reversal, as momentum shifts in favor of buyers.
The price is approaching a key support zone, which has historically held, increasing the likelihood of a bounce.
The take profit at 0.85265 aligns with a significant resistance level, providing a logical target for the trade.
Risk Management
The stop loss at 0.80312 ensures that the trade is invalidated if the price continues to decline significantly, protecting against larger losses.
Traders should consider position sizing to ensure the 248-pip risk aligns with their risk tolerance (e.g., risking 1–2% of their account on this trade).
Additional Notes
Monitor for confirmation of the reversal, such as a strong bullish candlestick pattern (e.g., engulfing or pin bar) at the support zone.
Be cautious of any fundamental news (e.g., US or Swiss economic data) that could impact USD/CHF volatility during the trade.

USDCHF Continuation of Sells Price is very bearish & trend is your friend,we have a unmitigated zone on our 1hr,I’d say this is a b+ trade
trend line breakout trend line brekout trade when the price retraces take a position when u see bullish candle

Bullish rise?The Swissie (USD/CHF) has reacted off the pivot which is a pullback support and could rise to the 1st resistance.
Pivot: 0.8156
1st Support: 0.8197
1st Resistance: 0.8260
Risk Warning:
Trading Forex and CFDs carries a high level of risk to your capital and you should only trade with money you can afford to lose. Trading Forex and CFDs may not be suitable for all investors, so please ensure that you fully understand the risks involved and seek independent advice if necessary.
Disclaimer:
The above opinions given constitute general market commentary, and do not constitute the opinion or advice of IC Markets or any form of personal or investment advice.
Any opinions, news, research, analyses, prices, other information, or links to third-party sites contained on this website are provided on an "as-is" basis, are intended only to be informative, is not an advice nor a recommendation, nor research, or a record of our trading prices, or an offer of, or solicitation for a transaction in any financial instrument and thus should not be treated as such. The information provided does not involve any specific investment objectives, financial situation and needs of any specific person who may receive it. Please be aware, that past performance is not a reliable indicator of future performance and/or results. Past Performance or Forward-looking scenarios based upon the reasonable beliefs of the third-party provider are not a guarantee of future performance. Actual results may differ materially from those anticipated in forward-looking or past performance statements. IC Markets makes no representation or warranty and assumes no liability as to the accuracy or completeness of the information provided, nor any loss arising from any investment based on a recommendation, forecast or any information supplied by any third-party.

USD/CHF H1 | Upward trajectory to extend higher?USD/CHF could fall towards an overlap support and potentially bounce off this level to climb higher.
Buy entry is at 0.8169 which is an overlap support that aligns with the 23.6% Fibonacci retracement.
Stop loss is at 0.8130 which is a level that lies underneath an overlap support and the 38.2% Fibonacci retracement.
Take profit is at 0.8235 which is a multi-swing-high resistance.
High Risk Investment Warning
Trading Forex/CFDs on margin carries a high level of risk and may not be suitable for all investors. Leverage can work against you.
Stratos Markets Limited (tradu.com ):
CFDs are complex instruments and come with a high risk of losing money rapidly due to leverage. 63% of retail investor accounts lose money when trading CFDs with this provider. You should consider whether you understand how CFDs work and whether you can afford to take the high risk of losing your money.
Stratos Europe Ltd (tradu.com ):
CFDs are complex instruments and come with a high risk of losing money rapidly due to leverage. 63% of retail investor accounts lose money when trading CFDs with this provider. You should consider whether you understand how CFDs work and whether you can afford to take the high risk of losing your money.
Stratos Global LLC (tradu.com ):
Losses can exceed deposits.
Please be advised that the information presented on TradingView is provided to Tradu (‘Company’, ‘we’) by a third-party provider (‘TFA Global Pte Ltd’). Please be reminded that you are solely responsible for the trading decisions on your account. There is a very high degree of risk involved in trading. Any information and/or content is intended entirely for research, educational and informational purposes only and does not constitute investment or consultation advice or investment strategy. The information is not tailored to the investment needs of any specific person and therefore does not involve a consideration of any of the investment objectives, financial situation or needs of any viewer that may receive it. Kindly also note that past performance is not a reliable indicator of future results. Actual results may differ materially from those anticipated in forward-looking or past performance statements. We assume no liability as to the accuracy or completeness of any of the information and/or content provided herein and the Company cannot be held responsible for any omission, mistake nor for any loss or damage including without limitation to any loss of profit which may arise from reliance on any information supplied by TFA Global Pte Ltd.
The speaker(s) is neither an employee, agent nor representative of Tradu and is therefore acting independently. The opinions given are their own, constitute general market commentary, and do not constitute the opinion or advice of Tradu or any form of personal or investment advice. Tradu neither endorses nor guarantees offerings of third-party speakers, nor is Tradu responsible for the content, veracity or opinions of third-party speakers, presenters or participants.

USDCHF UPDATE Usdchf has pulled back to our Fibonacci level for an entry to the sell side. We await to the reaction of the market. The trade just became active and can be entered with the parameters as shown in the picture above

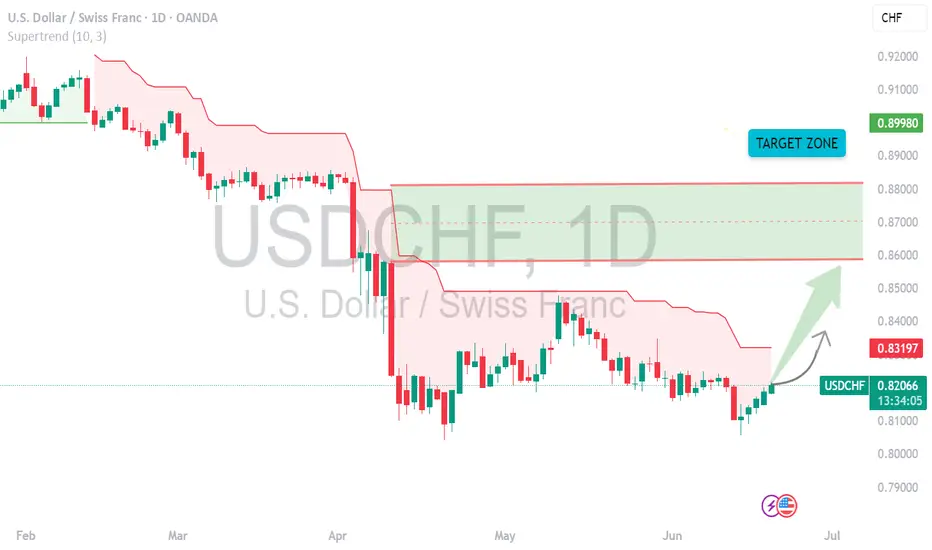
USDCHF OUTLOOK - SWING SETUPExpecting a bullish dollar in the next few months, which in turn will be bullish for USDCHF.
Note: ****I forgot to publish/share the trade setup after annotation.
"May fortune attend thee, and thy trade prosper." .......L2Earned

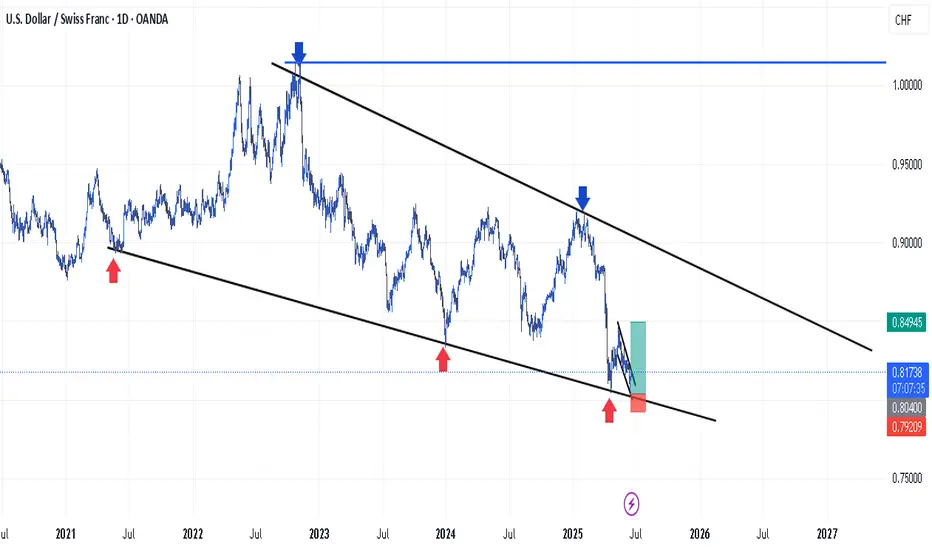
Lingrid | USDCHF long Trading Opportunity from Strong SupportThe price perfectly fulfills my previous idea . FX:USDCHF just printed a new lower low at the bottom of a wide downward channel, completing a textbook bearish leg from the triangle breakdown. The price is showing signs of local accumulation with a possible double bottom forming near 0.8078 support. If a bullish bounce holds, the next target lies near the confluence of the upward trendline and 0.8200 zone.
📈 Key Levels
Buy zone: 0.8060–0.8080
Sell trigger: breakdown below 0.8050
Target: 0.8200
Buy trigger: strong bullish engulfing above 0.8125
💡 Risks
Break below 0.8050 reopens path to 0.7980
Weak recovery could form another lower high
Downward channel remains dominant until confirmed breakout
Traders, if you liked this idea or if you have your own opinion about it, write in the comments. I will be glad 👩💻

Major resistance ahead?USD/CHF is rising towards the resistance level which is a pullback resistance that aligns with the 50% Fibonacci retracement and could reverse from this level too ur take profit.
Entry: 0.8197
Why we like it:
There is a pullback resistance level hat lines up with the 50% Fibonacci retracement.
Stop loss: 0.8313
Why we like it:
There is a pullback resistance level that lines up with the 61.8% Fibonacci retracement.
Take profit: 0.8066
Why we like it:
There is a pullback support level.
Enjoying your TradingView experience? Review us!
Please be advised that the information presented on TradingView is provided to Vantage (‘Vantage Global Limited’, ‘we’) by a third-party provider (‘Everest Fortune Group’). Please be reminded that you are solely responsible for the trading decisions on your account. There is a very high degree of risk involved in trading. Any information and/or content is intended entirely for research, educational and informational purposes only and does not constitute investment or consultation advice or investment strategy. The information is not tailored to the investment needs of any specific person and therefore does not involve a consideration of any of the investment objectives, financial situation or needs of any viewer that may receive it. Kindly also note that past performance is not a reliable indicator of future results. Actual results may differ materially from those anticipated in forward-looking or past performance statements. We assume no liability as to the accuracy or completeness of any of the information and/or content provided herein and the Company cannot be held responsible for any omission, mistake nor for any loss or damage including without limitation to any loss of profit which may arise from reliance on any information supplied by Everest Fortune Group.

USDCHFIs USDCHF on the rise? 📈 Don't be fooled by the calm, this currency pair is keeping us all on edge. Keep a close watch and stay ahead of the game with these tips

USDCHF: Pullback From Resistance 🇺🇸🇨🇭
USDCHF is going to retrace from a key daily horizontal resistance cluster.
As a confirmation, I spotted a bearish breakout of a support line of a rising
wedge pattern on an hourly time frame.
We see its retest now.
Goal - 0.815
❤️Please, support my work with like, thank you!❤️
I am part of Trade Nation's Influencer program and receive a monthly fee for using their TradingView charts in my analysis.

USD_CHF SHORT SIGNAL|
✅USD_CHF made a nice
Rebound from the support
Below just as we predicted in
Our previous analysis but is now
About to retest the horizontal
Resistance of 0.8200 from where
We can go short with the TP
Of 0.8124 and the SL of 0.8207
SHORT🔥
✅Like and subscribe to never miss a new idea!✅
Disclosure: I am part of Trade Nation's Influencer program and receive a monthly fee for using their TradingView charts in my analysis.

USD/CHF is on the beginning of a bull runFrom the chart, you can see that usd/chf have just reach the end of the bearish trendline, and its about to fly up.
Reasons
1; double bottom pattern
2; completion of the inner descending triangle
3; pattern inside pattern, which is signal for strong trade
4; formation of outer descending triangle

Buy idea on usdchfLittle bullish movement heading to a rejection. Target is the tip of the harmonic pattern.
Published a bit late but there's a bit of a move left

USD/CHF SHORT USD/CHF SHORT " break of a support area and retest it + 61.8% fib retracement + 50 ema dynamic resistance + down trendline "

USDCHF in DowntrendPending a confirmation from AB=CD harmonics pattern, we may see a downtrend continuation from the 4H bearish FVG and 1D bearish FVG overlap. However, if this FVG fails, we might see a reversal from the 0.8188 level, which would be a 0.718 FIB retracement level.
Sell Stop
Entry Price 0.8147
Stop Loss 0.8178
TP1 0.8057
Risk 1%
Lot Size 0.66

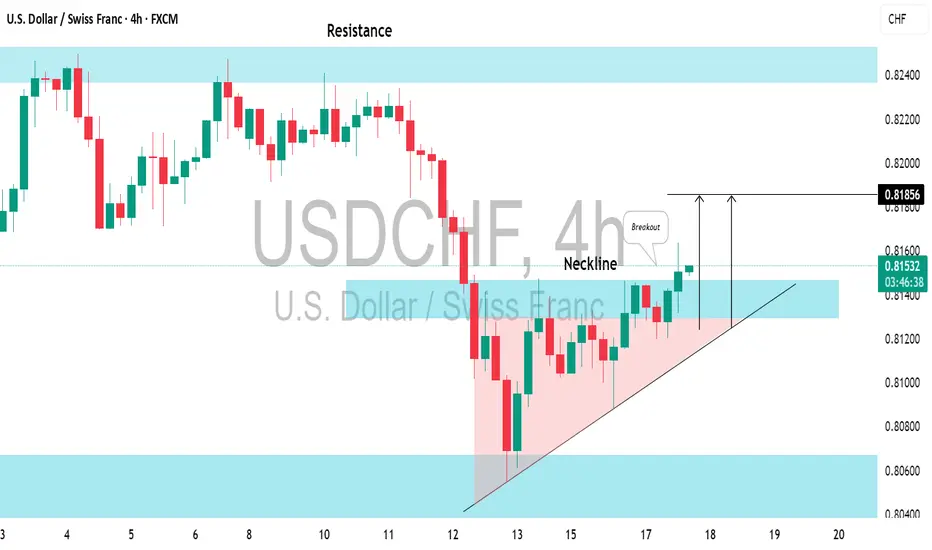
USDCHF: Bullish Move From Key LevelI see a solid bullish signal on 📈USDCHF following a test of significant support.
The price formed an ascending triangle pattern on the 4-hour chart and has broken above its neckline.
I anticipate that the price will soon reach the 0.8193 level.