USD/CHF - Triangle Breakout (06.06.2025)The USD/CHF pair on the M30 timeframe presents a Potential Buying Opportunity due to a recent Formation of a Triangle Pattern. This suggests a shift in momentum towards the upside and a higher likelihood of further advances in the coming hours.
Possible Long Trade:
Entry: Consider Entering A Long Position around Trendline Of The Pattern.
Target Levels:
1st Resistance – 0.8263
2nd Resistance – 0.8227
🎁 Please hit the like button and
🎁 Leave a comment to support for My Post !
Your likes and comments are incredibly motivating and will encourage me to share more analysis with you.
Best Regards, KABHI_TA_TRADING
Thank you.
Disclosure: I am part of Trade Nation's Influencer program and receive a monthly fee for using their TradingView charts in my analysis.
CHFUSD trade ideas

USD/CHF Head and Shoulders Pattern Signals Bearish ReversalThe USD/CHF 4-hour chart shows a clear Head and Shoulders pattern, a classic reversal signal. The Left Shoulder, Head, and Right Shoulder are well-formed, suggesting bearish momentum. The price is currently consolidating below the neckline, indicating a potential breakout to the downside. The Ichimoku cloud confirms resistance above the current price level, adding further bearish bias. If the price breaks below the neckline decisively, a significant downward move is expected.
Entry point: 0.82080
First target: 0.80638
Second target: 0.79500
If you found this analysis helpful, don’t forget to drop a like and comment . Your support keeps quality ideas flowing—let’s grow and win together! 💪📈

USDCHF Will Go Higher! Long!
Here is our detailed technical review for USDCHF.
Time Frame: 9h
Current Trend: Bullish
Sentiment: Oversold (based on 7-period RSI)
Forecast: Bullish
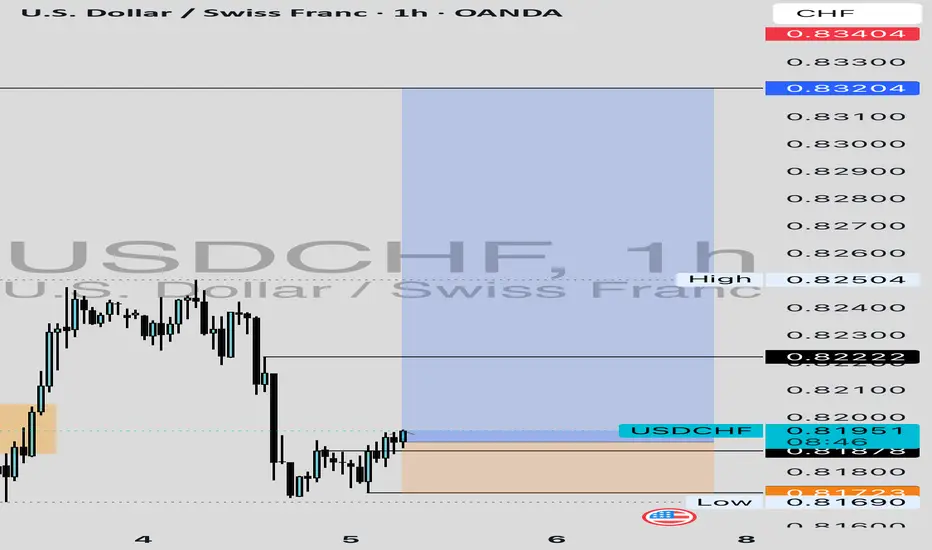
The market is approaching a significant support area 0.819.
The underlined horizontal cluster clearly indicates a highly probable bullish movement with target 0.831 level.
P.S
Overbought describes a period of time where there has been a significant and consistent upward move in price over a period of time without much pullback.
Disclosure: I am part of Trade Nation's Influencer program and receive a monthly fee for using their TradingView charts in my analysis.
Like and subscribe and comment my ideas if you enjoy them!

USDCHF: Bearish Wave Ahead 🇺🇸🇨🇭
Quick update for USDCHF.
Earlier on Monday, I shared a bearish forecast based on a
confirmed violation of a neckline of a head and shoulders pattern on a daily.
We got quite a deep retest of that and bears finally showed their presence.
I remain bearish bias and expect a bearish continuation soon.
❤️Please, support my work with like, thank you!❤️
I am part of Trade Nation's Influencer program and receive a monthly fee for using their TradingView charts in my analysis.

Time to Demand Accountability from the Swiss National Bank (SNB)For far too long, the Swiss National Bank (SNB) have operated behind closed doors, shaping global financial realities in ways that disproportionately benefit a few and burden many. Their repeated currency interventions, most notably the artificial caps on EUR/CHF and USD/CHF exchange rates, reflect a deeper issue: a system where monetary sovereignty is manipulated to protect domestic interests at the expense of global fairness. The Swiss National Bank (SNB) has used its monetary tools not just to stabilize its domestic economy, but to quietly exercise power over others. Through aggressive currency interventions, low interest rates, and strategic positioning of the Swiss franc as a "safe haven," the SNB has contributed to a financial system where many countries are locked into debt arrangements they can never realistically escape.
This didn’t start yesterday. Here’s the history they don’t talk about:
🔹 Post–World War II Era:
Switzerland remained neutral during the war and emerged with a strong financial system. It quickly became a key player in the Eurodollar market, which allowed banks (including Swiss ones) to lend US dollars offshore, outside of U.S. regulation. Many developing countries, desperate for post-war reconstruction funds, turned to these offshore lenders — often at terms that later proved unsustainable when the global interest rate environment shifted.
🔹 1970s–1980s Debt Crisis:
Swiss banks (along with others in the West) extended massive loans to developing countries — Latin America, Africa, parts of Asia — often encouraged by global institutions like the IMF and World Bank. These loans were typically denominated in Swiss francs or U.S. dollars, making repayment dependent on stable exchange rates.
But when the Swiss franc appreciated sharply in the 1980s and 1990s, many of these countries suddenly found their debts unpayable. The result: structural adjustment programs, austerity, privatization, and decades of dependency.
🔹 Eastern Europe, 2000s–2010s:
Swiss franc–denominated mortgages were pushed heavily in countries like Poland, Hungary, and Croatia, offering lower interest rates than local currencies. When the franc soared after the 2008 financial crisis and the SNB abandoned its EUR/CHF floor in 2015, borrowers saw their payments skyrocket overnight. Entire generations were trapped in personal debt — because of monetary decisions made in a country they had no vote in.
🔹 Modern Times – SNB as “Safe Haven” Weaponizer:
The SNB’s current cap on EUR/CHF (around 0.93) and its suppression of USD/CHF below 0.82 reflect the same pattern: Switzerland manipulating its currency to protect its export sector and keep foreign capital flowing in. Meanwhile, countries that borrowed in francs or depend on euro/franc parity for stability are squeezed.
Why This Matters Today
These practices aren’t just economic strategies — they are levers of control.
Countries that fall into this debt trap often lose control of monetary policy, domestic budgets, and even sovereign decision-making.
The SNB, unlike elected governments, answers to almost no one internationally. Yet its decisions affect millions beyond Swiss borders.
Let’s not stay silent just because it's Switzerland — a country with a reputation for neutrality and peace. Behind the banking halls and pristine image lies a long pattern of quiet domination through debt.

Short term buyers..The price break the resistance, so we look for the pullback up to 50% of the wick formed then continue selling as higher TF trend shows.
On 1hr tf already see the BOTS(break of trend structure) to confirm buyers jump in.. SL 20pips Tp 100+pips 🤯🤯
USDCHF H4 I Bullish Bounce OffBased on the H4 chart analysis, the price is falling toward our buy entry level at 0.8114, a pullback support.
Our take profit is set at 0.8192, a pullback resistance.
The stop loss is placed at 0.8038, a swing low support.
High Risk Investment Warning
Trading Forex/CFDs on margin carries a high level of risk and may not be suitable for all investors. Leverage can work against you.
Stratos Markets Limited (tradu.com ):
CFDs are complex instruments and come with a high risk of losing money rapidly due to leverage. 63% of retail investor accounts lose money when trading CFDs with this provider. You should consider whether you understand how CFDs work and whether you can afford to take the high risk of losing your money.
Stratos Europe Ltd (tradu.com ):
CFDs are complex instruments and come with a high risk of losing money rapidly due to leverage. 63% of retail investor accounts lose money when trading CFDs with this provider. You should consider whether you understand how CFDs work and whether you can afford to take the high risk of losing your money.
Stratos Global LLC (tradu.com ):
Losses can exceed deposits.
Please be advised that the information presented on TradingView is provided to Tradu (‘Company’, ‘we’) by a third-party provider (‘TFA Global Pte Ltd’). Please be reminded that you are solely responsible for the trading decisions on your account. There is a very high degree of risk involved in trading. Any information and/or content is intended entirely for research, educational and informational purposes only and does not constitute investment or consultation advice or investment strategy. The information is not tailored to the investment needs of any specific person and therefore does not involve a consideration of any of the investment objectives, financial situation or needs of any viewer that may receive it. Kindly also note that past performance is not a reliable indicator of future results. Actual results may differ materially from those anticipated in forward-looking or past performance statements. We assume no liability as to the accuracy or completeness of any of the information and/or content provided herein and the Company cannot be held responsible for any omission, mistake nor for any loss or damage including without limitation to any loss of profit which may arise from reliance on any information supplied by TFA Global Pte Ltd.
The speaker(s) is neither an employee, agent nor representative of Tradu and is therefore acting independently. The opinions given are their own, constitute general market commentary, and do not constitute the opinion or advice of Tradu or any form of personal or investment advice. Tradu neither endorses nor guarantees offerings of third-party speakers, nor is Tradu responsible for the content, veracity or opinions of third-party speakers, presenters or participants.


UPDATE ON USD/CHF ANALYSISUSD/CHF 30M - Back with an update for you lovely people, as you can see price has traded down and into the Demand Zone I marked out, following the story I created.
For you pre-emptive traders, you may already be in with a pending order, however I am going to wait to see if we can more confirmation before I look to enter.
As we know trading against the overall prevailing trend comes with some risk which is why we need to take extra precautions when we look to buy into this market.
This is the main reason I am waiting for a little more confirmation before entering in long with this market, if you have any questions in the meantime drop me a message or comment below!

USDCHF Sell analysis/ideaThis trade is based on multiple timeframes and executed using reversal trading and trend formation. I also used DXY analysis and movement to take this trade. Complete explanation in the video!

USDCHF Sell / Buy- Go for short term sell if want
- Don't miss the next upcoming buy (could be NFP move, will check and see by then)
- Refine entry with smaller SL for better RR, if your strategy allow
A Message To Traders:
I’ll be sharing high-quality trade setups for a period time. No bullshit, no fluff, no complicated nonsense — just real, actionable forecast the algorithm is executing. If you’re struggling with trading and desperate for better results, follow my posts closely.
Check out my previously posted setups and forecasts — you’ll be amazed by the high accuracy of the results.
"I Found the Code. I Trust the Algo. Believe Me, That’s It."

USDCHF: Short From ResistanceUSDCHF could pull back from a significant intraday horizontal resistance.
The formation of a horizontal trading range on an hourly chart and a breakout below its support level suggest this.
I anticipate a downward movement to 0.8166.

THOUGHTS ON USD/CHF TRADEUSD/CHF 1H - This market I am wanting to see a continuation in bearish structure, what we are witnessing at the moment is price correcting itself, this is in prep for the next impulsive wave to the downside.
Once we see price trade up and into the Supply Zone above, this is when I will be looking to take part in the market with short positions. Its important we are following the prevailing trend, this increases probability of success.
You can see I have drawn out a path trading us lower initially before the move higher, this is because I am trying to tell a story. A story to help you all understand the journey price takes in order to get to where it wants to be longer term.
We understand price is going to trade lower longer term as that is the bias of the market, but in order for it to have enough Supply to trade lower we must first see price introduce Supply and for Demand to be offloaded, the Demand it picks up initially will be removed and Supply will be introduced.

USDCHF is attempting to break out from a key resistanceIf price escapes this level, we could see a move toward the next supply zone near 0.82855. Watch closely for confirmation – this could be a clean transition from one range to the next.
run to another zone

Market Analysis: USD/CHF Targets Upside BreakMarket Analysis: USD/CHF Targets Upside Break
USD/CHF is rising and might aim for a move towards the 0.8250 resistance.
Important Takeaways for USD/CHF Analysis Today
- USD/CHF is showing positive signs above the 0.8200 resistance zone.
- There was a break above a connecting bearish trend line with resistance at 0.8180 on the hourly chart at FXOpen.
USD/CHF Technical Analysis
On the hourly chart of USD/CHF at FXOpen, the pair declined heavily below the 0.8250 level before the bulls appeared. The US Dollar tested 0.8160 and recently started a fresh increase against the Swiss Franc.
The pair climbed above the 0.8200 resistance zone. There was a break above the 23.6% Fib retracement level of the downward move from the 0.8337 swing high to the 0.8157 low. Besides, there was a break above a connecting bearish trend line with resistance at 0.8180.
The bulls are now facing resistance near the 50% Fib retracement level of the downward move from the 0.8337 swing high to the 0.8157 low at 0.8250. The next major resistance is 0.8295.
The main resistance is near 0.8335. If there is a clear break above 0.8335 and the RSI remains above 50, the pair could start another increase. In the stated case, it could test 0.8420.
If there is another decline, the pair might test the 0.8200 support. The first major support on the USD/CHF chart is near the 0.8160 zone. A downside break below 0.8160 might spark bearish moves. The next major support is near the 0.8120 pivot level. Any more losses may possibly open the doors for a move towards the 0.8050 level in the near term.
This article represents the opinion of the Companies operating under the FXOpen brand only. It is not to be construed as an offer, solicitation, or recommendation with respect to products and services provided by the Companies operating under the FXOpen brand, nor is it to be considered financial advice.

USDCHF SELLBy utilizing levels, historical patterns, , we can formulate a hypothesis that the market might follow a similar trajectory if bearish sentiment prevails.

USDCHF H4 | Bearish Reversal Based on the H1 chart, the price is approaching our sell entry level at 0.8257, a pullback resistance that aligns with the 50% Fib retracement.
Our take profit is set at 0.8190, a pullback support.
The stop loss is set at 0.8346, a swing high resistance.
High Risk Investment Warning
Trading Forex/CFDs on margin carries a high level of risk and may not be suitable for all investors. Leverage can work against you.
Stratos Markets Limited (tradu.com ):
CFDs are complex instruments and come with a high risk of losing money rapidly due to leverage. 63% of retail investor accounts lose money when trading CFDs with this provider. You should consider whether you understand how CFDs work and whether you can afford to take the high risk of losing your money.
Stratos Europe Ltd (tradu.com ):
CFDs are complex instruments and come with a high risk of losing money rapidly due to leverage. 63% of retail investor accounts lose money when trading CFDs with this provider. You should consider whether you understand how CFDs work and whether you can afford to take the high risk of losing your money.
Stratos Global LLC (tradu.com ):
Losses can exceed deposits.
Please be advised that the information presented on TradingView is provided to Tradu (‘Company’, ‘we’) by a third-party provider (‘TFA Global Pte Ltd’). Please be reminded that you are solely responsible for the trading decisions on your account. There is a very high degree of risk involved in trading. Any information and/or content is intended entirely for research, educational and informational purposes only and does not constitute investment or consultation advice or investment strategy. The information is not tailored to the investment needs of any specific person and therefore does not involve a consideration of any of the investment objectives, financial situation or needs of any viewer that may receive it. Kindly also note that past performance is not a reliable indicator of future results. Actual results may differ materially from those anticipated in forward-looking or past performance statements. We assume no liability as to the accuracy or completeness of any of the information and/or content provided herein and the Company cannot be held responsible for any omission, mistake nor for any loss or damage including without limitation to any loss of profit which may arise from reliance on any information supplied by TFA Global Pte Ltd.
The speaker(s) is neither an employee, agent nor representative of Tradu and is therefore acting independently. The opinions given are their own, constitute general market commentary, and do not constitute the opinion or advice of Tradu or any form of personal or investment advice. Tradu neither endorses nor guarantees offerings of third-party speakers, nor is Tradu responsible for the content, veracity or opinions of third-party speakers, presenters or participants.

USDCHF: A BUY OPPORTUNITY!!I'm going long, there's been a sweep of the previous low indicating a grab of liquidity to the downside and a break of structure to the upside indicating a continuation of the bullish trend. Price has created an internal liquidity to take out early buyers while preparing for a take off to the upside.

USD/CHF: Squeeze Risk Builds After Bullish ReversalRisk of a countertrend squeeze in USD/CHF is building after it printed a bullish engulfing candle on Tuesday, breaking out of the falling wedge it had been trading in over recent weeks.
While the price signal alone is bullish, to get excited about the prospect of a meaningful squeeze higher, USD/CHF needs to clear minor resistance overhead at .8246. If it can get a foothold above this level, it would generate a setup where longs could be established with a stop beneath for protection. .8333 looms as a potential target—a known resistance level that also has the key 50-day moving average sitting just above it.
Momentum indicators remain bearish but are starting to turn higher, suggesting the bearish flows that pushed USD/CHF to multi-week lows on Monday may be starting to ebb.
Good luck!
DS

USDCAD - Longkeeping close tabs on this one.
Price is showing signs of reversing after breaking the previous lows on the higher timeframe.
Unsure yet as to whether I will trade it. But its certainly one to watch

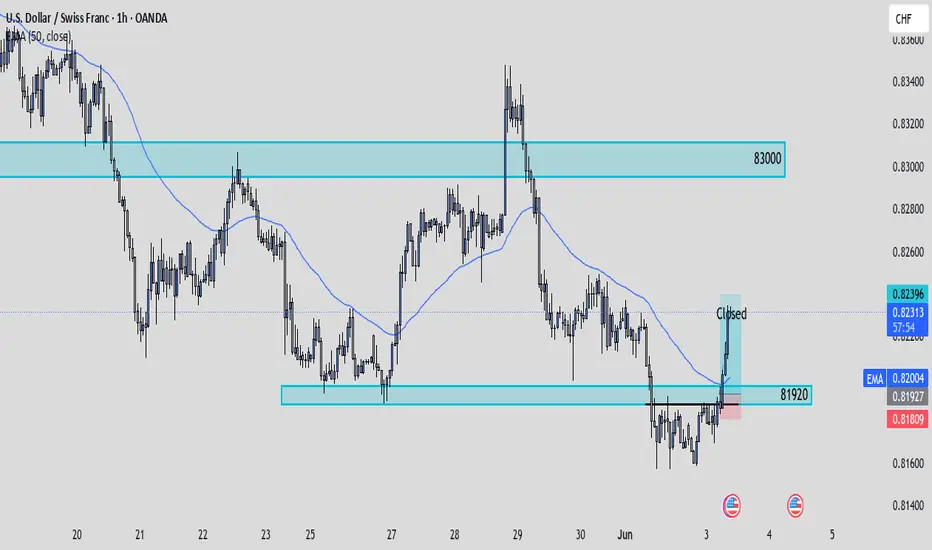
UsdChf Trade UpdateI never got to post the UC set up I was looking at this morning since everything happened so fast. UC is a bullish pair at the moment! I ended up take longs once I seen price create a new low just below a main level before breaking back to the upside. The shift of structure on the smaller time frame confirmed the bullish move which is why I decided to execute longs at 81927 with stops just below structure. I was looking to target a 1:3rr as always. Price played out beautifully where I then decided to cut profits a few pips away. I'll be looking for more longs on this pair. We could expect price to tap back into 83000.
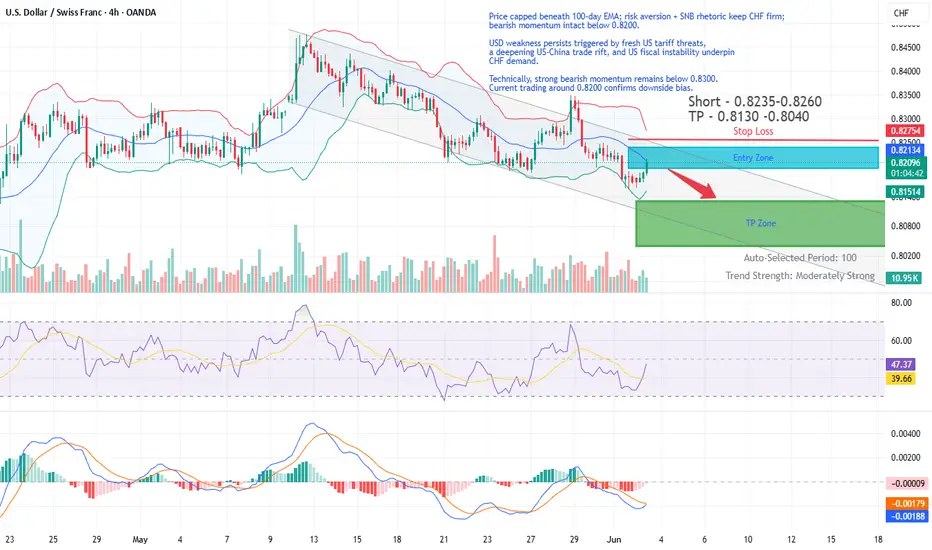
USD/CHF Short Trade Idea - UpdatedPrice capped beneath 100-day EMA; risk aversion + SNB rhetoric keep CHF firm; bearish momentum intact below 0.8200.
USD weakness persists triggered by fresh US tariff threats,
a deepening US-China trade rift, and US fiscal instability underpin
CHF demand.
Technically, strong bearish momentum remains below 0.8300.
Current trading around 0.8200 confirms downside bias.
USDCHF SELLThis is a Wyckoff upthrust text book set up for sell. Any questions please leave a comment!
