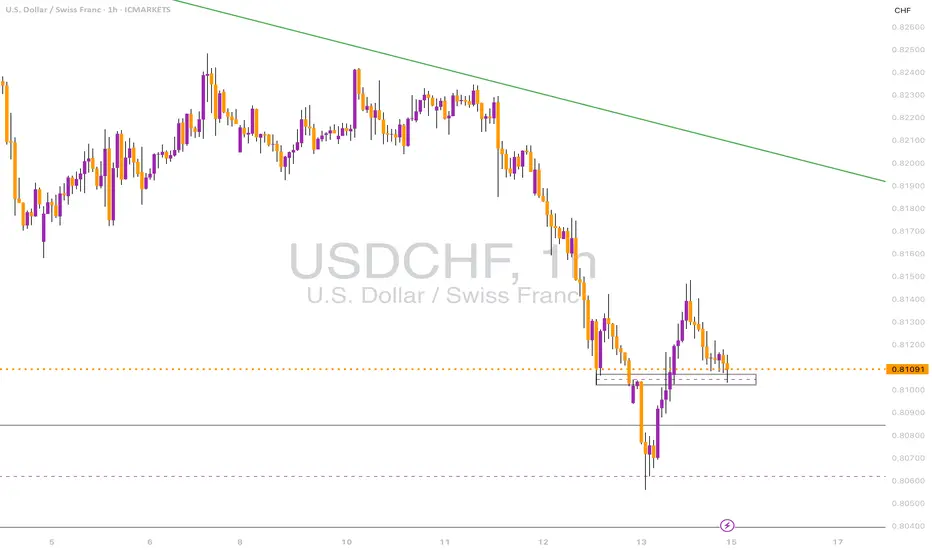
USDCHF Holding Support – Eyes on Trendline RejectionUSDCHF is respecting a key 1D support zone around 0.8100, showing some reaction after a strong downtrend.
• 1D Chart: Testing horizontal support and trendline from Jan-May range.
• 4H Chart: Weak reaction so far – no strong bullish candles yet.
• 1H & 23m Chart: Retesting small 1H order block structure.
Key Zones:
• Support: 0.8080–0.8100
• Resistance: 0.8160 / 0.8210
Bias: Watching for bullish reversal signals. Otherwise, continuation lower below 0.8080.
CHFUSD trade ideas

USDCHF Holding Support – Eyes on Trendline RejectionUSDCHF is respecting a key 1D support zone around 0.8100, showing some reaction after a strong downtrend.
• 1D Chart: Testing horizontal support and trendline from Jan-May range.
• 4H Chart: Weak reaction so far – no strong bullish candles yet.
• 1H & 23m Chart: Retesting small 1H order block structure.
Key Zones:
• Support: 0.8080–0.8100
• Resistance: 0.8160 / 0.8210
Bias: Watching for bullish reversal signals. Otherwise, continuation lower below 0.8080.
USDCHF (15/06/25)On Monday 16th June, we expect consolidation bcoz we expect no high impact news ,on Tuesday price is expected to reach the bearish daily fvg then reverse down around and below Mondays open

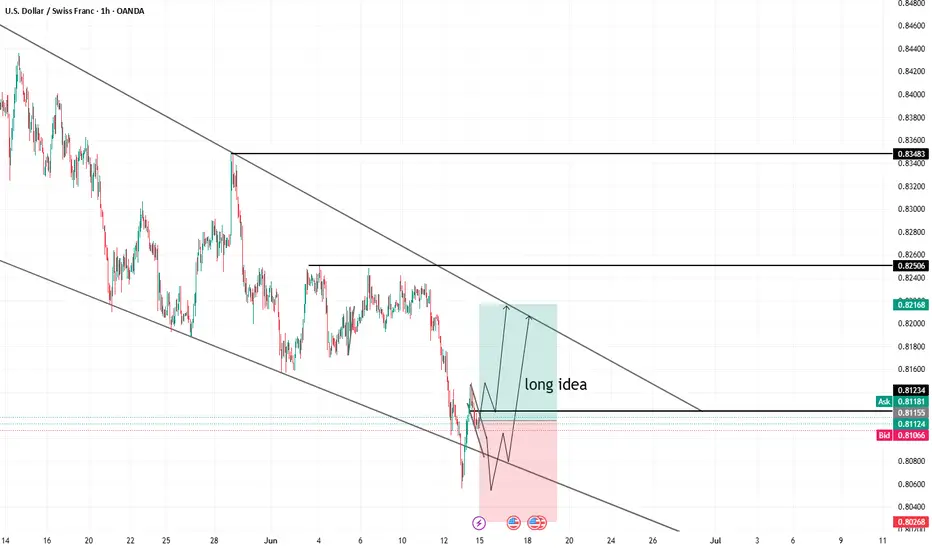
USDCHF long ideaUSDCHF long idea flag pattern and support zone retest h1 IM expecting to price go up and retest resistance area if resistance area will break succesefully then it can continue to go up to marked zones
USDCHF COT and Liquidity AnalysisHey what up traders welcome to the COT data and Liquidity report. It's always good to go with those who move the market here is what I see in their cards. I share my COT - order flow views every weekend.
🎯 Non Commercials added significant longs and closed shorts at the same time. So for that reason I see the highs as a liquidity for their longs profits taking.
📍Please be aware that institutions report data to the SEC on Tuesdays and data are reported on Fridays - so again we as retail traders have disadvantage, but there is possibility to read between the lines. Remember in the report is what they want you to see, that's why mostly price reverse on Wednesday after the report so their cards are hidden as long as possible. However if the trend is running you can read it and use for your advantage.
💊 Tip
if the level has confluence with the high volume on COT it can be strong support / Resistance.
👍 Hit like if you find this analysis helpful, and don't hesitate to comment with your opinions, charts or any questions.
Analysis done on the Tradenation Charts
Disclosure: I am part of Trade Nation's Influencer program and receive a monthly fee for using their TradingView charts in my analysis.
"Adapt what is useful, reject what is useless, and add what is specifically your own."
— David Perk aka Dave FX Hunter ⚔️

UsdchfWe are currently at the support zone and the last daily candlestick is indecision so let wait to the coming days candlestick maybe to the downward or upward side.

USD/CHF Hits Critical Support LevelsOver the last three trading sessions, USD/CHF has declined more than 1.5%, as a consistent bearish bias persists, pushing the pair back to multi-month lows. Selling pressure has remained firm amid uncertainty surrounding the escalation of political and military tensions in the Middle East. So far, the U.S. dollar has failed to act as a safe haven, while the Swiss franc has maintained its strength, reinforcing the current bearish trend. If this downward momentum continues, the selling trend could become even more dominant.
Consistent Bearish Trend
Since the beginning of the year, USD/CHF has shown consistent selling swings, leading to the formation of a strong downtrend in recent weeks. Currently, the selling pressure has been strong enough to drive the pair back to recent lows, and if the bearish momentum continues below this level, the downward trend may gain further relevance. In the absence of any significant bullish corrections, the bearish trend remains the dominant pattern in the short term.
RSI
The RSI line continues to move below the 50 level, indicating that selling impulses remain dominant in recent sessions. As long as RSI remains below the neutral zone, the bearish momentum is likely to persist.
TRIX
The TRIX line has been oscillating below the neutral level of 0, suggesting that the average strength of the exponential moving averages still reflects a bearish market bias. This may indicate that the current downtrend still has room to continue in the near term.
However, it is important to note that the price is currently sitting at a key support zone, which could serve as a launch point for potential bullish corrections in the upcoming sessions.
Key Levels to Watch:
0.84668 – Major Resistance: This level marks the recent high reached in past months. If buying momentum pushes the pair back up to this level, it may pose a threat to the current downtrend and trigger a more relevant bullish move.
0.82980 – Short-Term Barrier: This level aligns with the 50-period moving average. Bullish moves above this point could challenge the current bearish formation and introduce a neutral short-term bias.
0.80827 – Key Support: This level aligns with the chart’s recent lows. While it may trigger upside corrections, a break below it could reactivate significant selling pressure in upcoming sessions.
Written by Julian Pineda, CFA – Market Analyst

USDCHF ANALYSISOn usdchf, we're in on a bearish market. we're looking at for a pullback to fibonacci levels, from anywhere between 71% to 100% for a continuation to the downside.

USDCHF BUY TRADE PLANUSD/CHF - June 13, 2025
📋 Plan Overview
Type: Countertrend Buy
Direction: Long
Confidence: Medium-High
R:R: ~2.5:1
Status: Waiting for retracement or confirmation
📈 Market Bias & Type
Short-term reversal opportunity inside long-term bearish trend
Bias: Temporary bullish correction
Type: Reversal (LTF Bounce against HTF trend)
🔰 Confidence Level with % and Breakdown
Total: 70%
HTF Oversold/Wick Rejection: 25%
Bullish H1-H4 structure shift: 20%
Volume spike + H1 engulfing: 15%
Fundamental/Sentiment: 10%
📍 Entry Zones
Primary: 0.8110 - 0.8120 (pullback zone to broken H1 structure)
Secondary: 0.8085 (origin of impulse leg if deeper retracement happens)
❗ SL with Reasoning
SL: 0.8050
Below the low of June 13 H1 reversal candle + structural invalidation
🎯 TP1/TP2/TP3 Targets
TP1: 0.8180 (recent H1 supply flip)
TP2: 0.8225 (H4 resistance)
TP3: 0.8290 (D1 imbalance fill area)
🧠 Management Strategy
Risk: 1%
Scaling: Add on confirmation from H1 higher low (0.8140+)
Breakeven: After TP1 or on strong bullish H1 candle + volume confirmation
⚠️ Confirmation Checklist
✅ Bullish engulfing on H1
✅ Impulse breakout structure
✅ Volume rise on reversal candle
⚠️ Still awaiting H1 retest or HL (no rush entry)
⏳ Validity
H1: 12h
H4: 36–48h max (until invalidation)
❌ Invalidation Conditions
Clean break and close below 0.8050
Failure to form HL and break above 0.8145 (range trap risk)
🌐 Fundamental & Sentiment Snapshot
CHF remains firm on safe haven flow
USD broadly weaker on Fed rate pause expectations
CPI/retail sentiment suggests potential DXY weakness short-term
Safe haven profit-taking could lift USD short-term
📋 Final Trade Summary
Looking for a corrective buy in a broader USDCHF downtrend. Signs of early reversal on LTFs with clean H1 impulse leg. Entry awaits retracement into structure. Conservative targets aligned with HTF levels. Risk tightly defined; no overexposure.

USD/CHF,4h chart pattern..USD/CHF buy trade setup based on my input:
---
✅ Trade Setup:
Buy Entry: 0.81300
First Target (TP1): 0.82300
Second Target (TP2): 0.83500
---
📊 Trade Metrics:
1. TP1 Distance:
0.82300 - 0.81300 = 0.01000 (100 pips)
2. TP2 Distance:
0.83500 - 0.81300 = 0.02200 (220 pips)
---
🛑 Suggested Stop-Loss (if not defined):
A common approach would be to place it below the recent swing low or a round level for risk management. Example:
Stop-Loss (SL): 0.80800 (50 pips risk)
---
⚖ Risk-Reward Ratios (if SL = 0.80800):
To TP1: 100 / 50 = 2.0 R/R
To TP2: 220 / 50 = 4.4 R/R
---
Would you like a visual chart or technical breakdown (e.g., support zones, confirmation candles) for this pair?

USD/CHF H1 | Swing-high resistance at 50% Fibonacci retracementUSD/CHF is rising towards a swing-high resistance and could potentially reverse off this level to drop lower.
Sell entry is at 0.8141 which is a swing-high resistance that aligns closely with the 50% Fibonacci retracement.
Stop loss is at 0.8182 which is a level that sits above the 61.8% Fibonacci retracement and a pullback resistance.
Take profit is at 0.8067 which is a swing-low support.
High Risk Investment Warning
Trading Forex/CFDs on margin carries a high level of risk and may not be suitable for all investors. Leverage can work against you.
Stratos Markets Limited (tradu.com ):
CFDs are complex instruments and come with a high risk of losing money rapidly due to leverage. 63% of retail investor accounts lose money when trading CFDs with this provider. You should consider whether you understand how CFDs work and whether you can afford to take the high risk of losing your money.
Stratos Europe Ltd (tradu.com ):
CFDs are complex instruments and come with a high risk of losing money rapidly due to leverage. 63% of retail investor accounts lose money when trading CFDs with this provider. You should consider whether you understand how CFDs work and whether you can afford to take the high risk of losing your money.
Stratos Global LLC (tradu.com ):
Losses can exceed deposits.
Please be advised that the information presented on TradingView is provided to Tradu (‘Company’, ‘we’) by a third-party provider (‘TFA Global Pte Ltd’). Please be reminded that you are solely responsible for the trading decisions on your account. There is a very high degree of risk involved in trading. Any information and/or content is intended entirely for research, educational and informational purposes only and does not constitute investment or consultation advice or investment strategy. The information is not tailored to the investment needs of any specific person and therefore does not involve a consideration of any of the investment objectives, financial situation or needs of any viewer that may receive it. Kindly also note that past performance is not a reliable indicator of future results. Actual results may differ materially from those anticipated in forward-looking or past performance statements. We assume no liability as to the accuracy or completeness of any of the information and/or content provided herein and the Company cannot be held responsible for any omission, mistake nor for any loss or damage including without limitation to any loss of profit which may arise from reliance on any information supplied by TFA Global Pte Ltd.
The speaker(s) is neither an employee, agent nor representative of Tradu and is therefore acting independently. The opinions given are their own, constitute general market commentary, and do not constitute the opinion or advice of Tradu or any form of personal or investment advice. Tradu neither endorses nor guarantees offerings of third-party speakers, nor is Tradu responsible for the content, veracity or opinions of third-party speakers, presenters or participants.

USDCHF - Follow The Bears!Hello TradingView Family / Fellow Traders. This is Richard, also known as theSignalyst.
📈USDCHF has been overall bearish trading within the falling channel marked in orange. And it is currently retesting the upper bound of the channel.
Moreover, the green zone is a strong structure.
🏹 Thus, the highlighted red circle is a strong area to look for sell setups as it is the intersection of the upper orange trendline and structure.
📚 As per my trading style:
As #USDCHF approaches the red circle zone, I will be looking for bearish reversal setups (like a double top pattern, trendline break , and so on...)
📚 Always follow your trading plan regarding entry, risk management, and trade management.
Good luck!
All Strategies Are Good; If Managed Properly!
~Rich
Disclosure: I am part of Trade Nation's Influencer program and receive a monthly fee for using their TradingView charts in my analysis.

USD/CHF TrendUSD/CHF has successfully broken out of the descending channel on the 15-minute timeframe, signaling a potential short-term trend reversal. The price is now consolidating above the broken channel, showing early signs of bullish momentum. As long as the price remains above 0.8110, further upside toward the resistance levels at 0.8125 and 0.8145 is expected. A break below 0.8089 would invalidate this bullish scenario and suggest a return to the previous downtrend.

USDCHF Bullish or bearish Detail ANAYSISUSDCHF is currently setting up for a classic bearish continuation pattern. After breaking down sharply from the key support turned resistance zone around 0.81500, the pair is now in the middle of a technical retest. Price is currently hovering near 0.81 and showing signs of weakness on lower timeframes. This retest into the previous demand-turned-supply area aligns well with the expectation of a further leg to the downside. As long as the price stays below 0.81500, sellers are likely to dominate, targeting 0.8000 in the near term.
From a fundamental perspective, the bearish pressure on USDCHF is supported by growing market speculation that the Federal Reserve may begin rate cuts sooner than previously expected. With the latest US CPI data confirming disinflationary progress and unemployment claims ticking higher, dollar strength is taking a hit. Meanwhile, the Swiss Franc remains relatively stable as the SNB continues its measured approach, with inflation staying well within target and no immediate pressure to cut rates. This monetary policy divergence favors further downside in USDCHF.
Technically, momentum remains strongly bearish. The recent bounce appears corrective rather than impulsive, suggesting the bears are still in control. If price rejects the 0.81500 zone with a clear reversal candle, we can anticipate a strong continuation move toward the psychological level of 0.8000. This level also aligns with previous demand zones and Fibonacci extension targets, making it a solid downside objective.
This setup is a clean example of trend-following structure with fundamental backing. USDCHF is preparing to complete a textbook retest before its next drop, offering a high-probability short opportunity. If the rejection confirms around 0.81500, sellers can expect a solid move toward 0.8000 with favorable risk-reward. The setup is ideal for short-term swing traders tracking USD weakness across the board.

USDCHF LONG FORECAST Q2 W24 D13 Y25USDCHF LONG FORECAST Q2 W24 D13 Y25
Professional Risk Managers👋
Welcome back to another FRGNT chart update📈
Diving into some Forex setups using predominantly higher time frame order blocks alongside intraday confirmation & breaks of structure.
Let’s see what price action is telling us today! 🔥
💡Here are some trade confluences📝
✅Weekly order block rejection
✅Daily order block rejection
✅15’ order block
✅Intraday bullish breaks of structure
🔑 Remember, to participate in trading comes always with a degree of risk, therefore as professional risk managers it remains vital that we stick to our risk management plan as well as our trading strategies.
📈The rest, we leave to the balance of probabilities.
💡Fail to plan. Plan to fail.
🏆It has always been that simple.
❤️Good luck with your trading journey, I shall see you at the very top.
🎯Trade consistent, FRGNT X

USDCHF 4 hr 2025-06-13Here is a Low Risk with a possible great reward opertunity .
@4xForecaster very nice 2.0
USD_CHF RISKY LONG|
✅USD_CHF will soon retest a key support level of 0.8060
So I think that the pair will make a rebound
And go up to retest the supply level above at 0.8127
LONG🚀
✅Like and subscribe to never miss a new idea!✅
Disclosure: I am part of Trade Nation's Influencer program and receive a monthly fee for using their TradingView charts in my analysis.

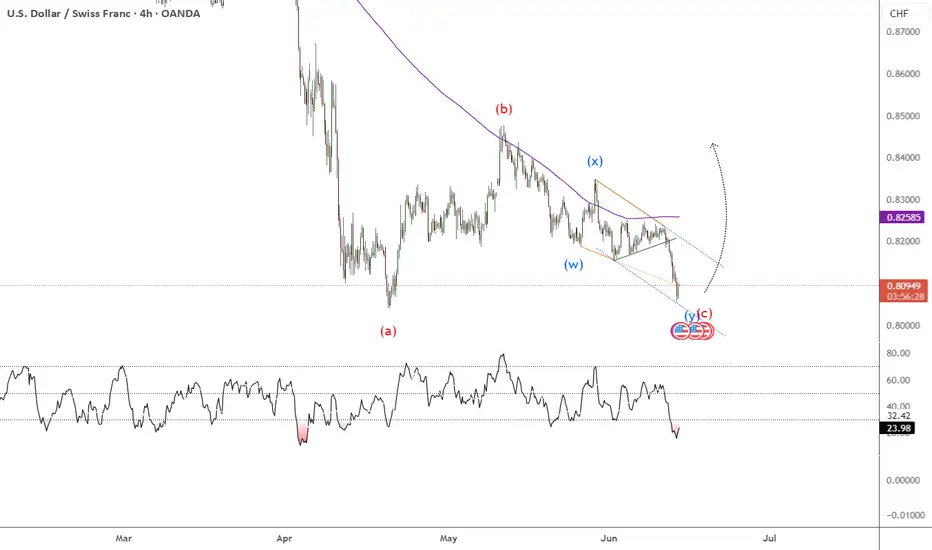
Elliott Wave Analysis: USDCHF Resumes Bearish TrendThe USDCHF currency pair has been declining since its peak on May 13, 2025. It follows a pattern that technical analysts identify as an impulsive wave with an extended structure, often referred to as a “nest.” This analysis tracks the pair’s movement through a series of waves, as observed on the 1-hour chart. It provides insight into its short-term trajectory and potential future movements.
Starting from the May 13 high, the initial decline, labeled wave 1, concluded at 0.8184. This was followed by a corrective rally in wave 2, which peaked at 0.8347. From there, the pair resumed its downward trend in wave 3. The wave 3 has unfolded with further subdivisions, forming another impulsive pattern in a lesser degree. Specifically, from the wave 2 high, the first sub-wave (i) ended at 0.8312, followed by a brief rally in wave (ii) to 0.8338. The pair then extended lower in wave (iii), reaching 0.8195, before a corrective wave (iv) rallied to 0.8249. The subsequent decline in wave (v) completed at 0.8153, finalizing wave ((i)) of the larger structure.
Following this, a recovery rally in wave ((ii)) reached 0.8250 before the pair turned lower again in wave ((iii)). Within this segment, the first sub-wave (i) ended at 0.8167, and a corrective wave (ii) rallied to 0.8248. In the near term, as long as the pair remains below 0.8250, any rallies are expected to fail after 3, 7, or 11 swings, with the pair likely to extend lower. This analysis suggests continued bearish momentum, with traders advised to monitor key levels for confirmation of further downside.

Bullish outlook Would be watching for a possible bullish reaction to the upside , taking out the structure high

Falling towards major support?USD/CHF is falling towards the pivot and could bounce to the 1st resistance.
Pivot: 0.8048
1st Support: 0.7994
1st Resistance: 0.8156
Risk Warning:
Trading Forex and CFDs carries a high level of risk to your capital and you should only trade with money you can afford to lose. Trading Forex and CFDs may not be suitable for all investors, so please ensure that you fully understand the risks involved and seek independent advice if necessary.
Disclaimer:
The above opinions given constitute general market commentary, and do not constitute the opinion or advice of IC Markets or any form of personal or investment advice.
Any opinions, news, research, analyses, prices, other information, or links to third-party sites contained on this website are provided on an "as-is" basis, are intended only to be informative, is not an advice nor a recommendation, nor research, or a record of our trading prices, or an offer of, or solicitation for a transaction in any financial instrument and thus should not be treated as such. The information provided does not involve any specific investment objectives, financial situation and needs of any specific person who may receive it. Please be aware, that past performance is not a reliable indicator of future performance and/or results. Past Performance or Forward-looking scenarios based upon the reasonable beliefs of the third-party provider are not a guarantee of future performance. Actual results may differ materially from those anticipated in forward-looking or past performance statements. IC Markets makes no representation or warranty and assumes no liability as to the accuracy or completeness of the information provided, nor any loss arising from any investment based on a recommendation, forecast or any information supplied by any third-party.

USDCHF Wave Analysis – 12 June 2025
- USDCHF broke support level 0.8170
- Likely to fall to support level 0.8050
USDCHF currency pair recently broke the key support level 0.8170, which stopped the previous waves B and 1, as can be seen below.
The breakout of the support level 0.8170 coincided with the breakout of the daily Descending Triangle from the end of April.
USDCHF currency pair can be expected to fall to the next support level 0.8050 (low of the impulse wave (1) from April).

Falling towards pullback support?USD/CHF is falling toward the support level, which is a pullback support aligning with the 100% Fibonacci projection. A bounce from this level could indicate a double bottom pattern, potentially leading to a price rise toward our take profit target.
Entry: 0.8046
Why we like it:
There is a pullback support level that aligns with the 100% Fibonacci projection.
Stop loss: 0.7996
Why we like it:
There is a support level at the 78.6% Fibonacci projection.
Take profit: 0.8161
Why we like it:
There is a pullback resistance level.
Enjoying your TradingView experience? Review us!
Please be advised that the information presented on TradingView is provided to Vantage (‘Vantage Global Limited’, ‘we’) by a third-party provider (‘Everest Fortune Group’). Please be reminded that you are solely responsible for the trading decisions on your account. There is a very high degree of risk involved in trading. Any information and/or content is intended entirely for research, educational and informational purposes only and does not constitute investment or consultation advice or investment strategy. The information is not tailored to the investment needs of any specific person and therefore does not involve a consideration of any of the investment objectives, financial situation or needs of any viewer that may receive it. Kindly also note that past performance is not a reliable indicator of future results. Actual results may differ materially from those anticipated in forward-looking or past performance statements. We assume no liability as to the accuracy or completeness of any of the information and/or content provided herein and the Company cannot be held responsible for any omission, mistake nor for any loss or damage including without limitation to any loss of profit which may arise from reliance on any information supplied by Everest Fortune Group.

USD-CHF Wide Support Ahead! Buy!
Hello,Traders!
USD-CHF keeps falling but
The pair will soon hit a
Horizontal support level
Of 0.8080 from where
We will be expecting
A local bullish rebound
Buy!
Comment and subscribe to help us grow!
Check out other forecasts below too!
Disclosure: I am part of Trade Nation's Influencer program and receive a monthly fee for using their TradingView charts in my analysis.
