USDCHF Update | ~200pipsSince the last post USDCHF sold off towards the demand zone and broke below support. Price is now pulling back towards the mid channel of the range where bulls will be tested again.
For now price looks bullish but could see another selloff later down the road.
CHFUSD trade ideas

USDCHF BULLISH?Watching for bullish momentum to continue on USD/CHF — a move toward a key resistance level could offer clarity on whether broader trend bias leans bullish or bearish.

Bullish bounce for the Swissie?The price has bounced off the support level which is a pullback support that lines up with the 61.8% Fibonacci retracement and could potentially rise from this level to our take profit.
Entry: 0.8322
Why we like it:
There is a pullback support level that lines up with the 61.8% Fibonacci retracement.
Stop loss: 0.8197
Why we like it:
There is a pullback support level.
Take profit: 0.8510
Why we like it:
There is a pullback resistance level that is slightly below the 61.8% Fibonacci retracement.
Enjoying your TradingView experience? Review us!
Please be advised that the information presented on TradingView is provided to Vantage (‘Vantage Global Limited’, ‘we’) by a third-party provider (‘Everest Fortune Group’). Please be reminded that you are solely responsible for the trading decisions on your account. There is a very high degree of risk involved in trading. Any information and/or content is intended entirely for research, educational and informational purposes only and does not constitute investment or consultation advice or investment strategy. The information is not tailored to the investment needs of any specific person and therefore does not involve a consideration of any of the investment objectives, financial situation or needs of any viewer that may receive it. Kindly also note that past performance is not a reliable indicator of future results. Actual results may differ materially from those anticipated in forward-looking or past performance statements. We assume no liability as to the accuracy or completeness of any of the information and/or content provided herein and the Company cannot be held responsible for any omission, mistake nor for any loss or damage including without limitation to any loss of profit which may arise from reliance on any information supplied by Everest Fortune Group.

USDCHF ANALYSISPrice retested weekly support and turned it into resistance. On the daily tf, price has formed HL& HH, so it could push up towards the daily resistance near 0.86000. Price is still overall bearish so be mindful when trading the counter trend. The h4 is on a bearish counter trend so I'd wait to see if price breaks h4 support for sells or break the counter trend line and retest it for buys.


DON'T DISS USDCHF, WE ARE GOING LONG!USDCHF FORECAST Q2 W21 Y25 DON'T DISS USDCHF, WE ARE GOING LONG!USDCHF FORECAST Q2 W21 Y25
Professional Risk Managers👋
Welcome back to another FRGNT chart update📈
Diving into some Forex setups using predominantly higher time frame order blocks alongside confirmation breaks of structure.
Let’s see what price action is telling us today!
💡Here are some trade confluences📝
✅Weekly order block rejection
✅Daily order block rejection
✅15’ order block
✅Intraday bullish breaks of structure
🔑 Remember, to participate in trading comes always with a degree of risk, therefore as professional risk managers it remains vital that we stick to our risk management plan as well as our trading strategies.
📈The rest, we leave to the balance of probabilities.
💡Fail to plan. Plan to fail.
🏆It has always been that simple.
❤️Good luck with your trading journey, I shall see you at the very top.
🎯Trade consistent, FRGNT X

USDCHF Buy still not too late...USDCHF Still not too late to go long... If price go down 0.8270 again, it will be priceless buy opportunity targeting 0.8760

USDCHF Starting Uptrend Within ChannelIt appears that the USDCHF chart has started moving within a channel and is beginning an upward trend. The stop-loss is set at 0.83

USDCHF bullish There's a clear descending triangle with price testing the upper resistance. A breakout is anticipated.
You can enter from FVG (Stop loss 0.83230)or wait a breakout above the triangle, then retest.
We have two targets:
-The distance from the highest point to the support line which will be at 0.8522
-Second target will be swing deal take it on weekly IFVG which will be at 0.87132

USDCHFThe latest COT data suggested relative strength in the Swissy. The price action also indicated that upside momentum has been meeting obstacles despite a seemingly strong recovery in the Dixie. I'd be interested in shorting this asset, if the opportunity presents it to me.

USDCHF 30M | Fair Value Gap Sell Setup Inside Bearish Channel📊 USD/CHF Smart Money Breakdown — May 16, 2025
Here’s a clean SMC-driven setup where price respects the bearish order flow, taps a Fair Value Gap (FVG) and rejects right at liquidity inducement levels.
Let’s break it down 👇
🔍 1. Context
Price is respecting a descending channel structure
Clean internal liquidity run up into:
✅ FVG zone from prior imbalance
✅ Top of bearish channel trendline
This is a classic liquidity sweep before expansion lower
🎯 2. Entry Plan
Entry zone: 0.8375–0.8391 (FVG zone shaded in red)
Stop loss: Just above 0.8391 (invalidates FVG zone)
Target zone:
🟢 TP1 → 0.8340 (minor inefficiency fill)
🟢 TP2 → 0.8327 (liquidity resting at the low)
➡️ RR ratio is about 1:3 on full target — clean sniper range!
📉 3. Smart Money Logic
Retail likely triggered buy orders into that FVG zone
Institutions tap FVG for premium entry
Price already printing rejection wicks — early signs of displacement
Watch for confirmation via:
Bearish engulfing candle close
Break of minor bullish structure on 5m
⚠️ Risk Notes:
Watch out for USD fundamental news that might cause a fakeout spike
Let price confirm breakdown before stacking entries
💬 Do you trust the FVG? Or think price will smash through?
🧠 Drop your confluence in the comments below and follow @ChartNinjas88 for precision setups like this every day.

USD-CHF Growth Ahead! Buy!
Hello,Traders!
USD-CHF made a bullish
Rebound from the horizontal
Support level around 0.8318
So we are locally bullish
Biased and we will be
Expecting further growth
On Monday
Buy!
Comment and subscribe to help us grow!
Check out other forecasts below too!
Disclosure: I am part of Trade Nation's Influencer program and receive a monthly fee for using their TradingView charts in my analysis.

USDCHF looks ready to resume the downtrend .the week of 19 May The area between 0.8434 and 0.8330 has been a strong support all year but got broken to the downside on 10 April. Since then, this pair gave several day trades as it pulled back to the zone (see my previous posts). As my daily chart shows, the recent retracement helped price to catch up to the 50ema and is now nicely below it.
I will be monitoring price action also on H4 to confirm if my analysis is correct and act if appropriate. We could be looking at a trade with +350 pips potential in uncertain times (due to unconventional Trumpeconomics) so I would be prepared for large swings and the need to hold the trade for extended time periods.
This is not a trade recommendation; it’s merely my own analysis. Trading carries a high level of risk so carefully managing your capital and risk is important. If you like my idea, please give a “boost” and follow me to get even more.
It’s not whether you are right or wrong, but how much money you make when you are right and how much you lose when you are wrong – George Soros

USDCHF 16 Friday 2025USDCHF I'm still looking @ further shorts as long as current supply holds.
Lower timeframe fractal highs should be swept for A+ sell continuation set up confluence then I will look for structure shift on lower timeframe.

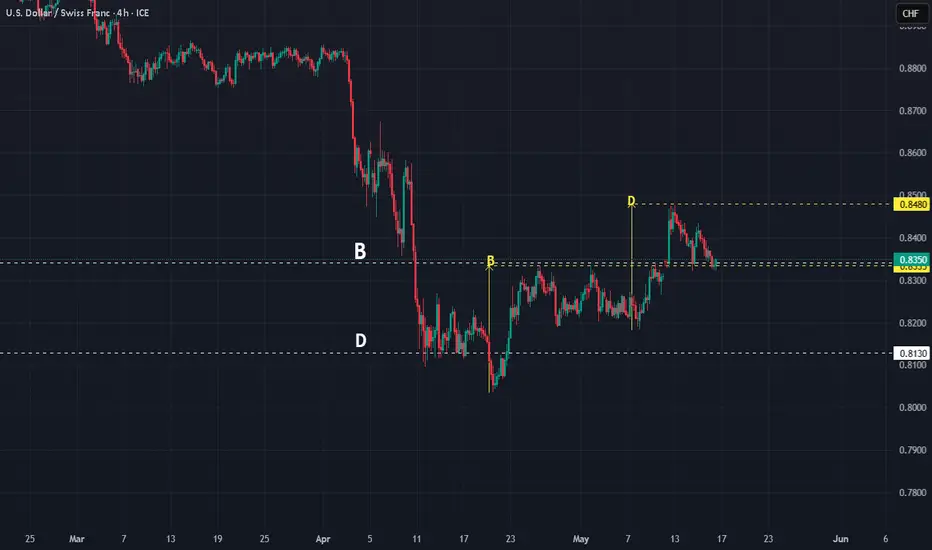
USDCHF : The fine point in playing the DSo far, I have been writing about playing the D - The D is he final point in the price movement, something which we ANTICIPATE.
What do we anticipate?
We anticipate a REVERSAL. In simple terms, we trade 'opposing' the trend.
Why?
The explanation is simple - Buy when Low. Sell when High.
Once the complete structure is complete, then we have a clear picture of price action. Our understanding is correct. Price did as we anticipated.
Now, price had bounced upward from a long term D, chances are it will go up more. Price is now a two Bs, one BIG, and another small. Not a coincidence but it is price telling us something - a confirmation of future direction.
BUY. The R/R is fantastic.
Good luck.
USDCHF 1H (BOS 5m + Demand 5m + IMB + OTE)Hello traders!
As you see price wants to close fully GAP. Near our POI(BOS 5m + Demand) - I expecting reversal from demand zone.
TP - MINIMUM to global GAP 1W.
Have a profitable day and don't forget to subscribe for updates!

USDCHF 4HHello traders welcome back
USDCHF what a nice setup if you interested more don't forget to follow me

USDCHF BUY 0.8219On the 4-hour chart, USDCHF is in a short-term shock and retreat, and the current downside target is looking at the previous demand area. If the price reaches around 0.8219, pay attention to the potential bullish bat pattern.

Bullish bounce off pullback support?The Swissie (USD/CHF) is falling towards the pivot which aligns with the 50% Fibonacci retracement and could bounce to the 1st resistance, which is also a pullback resistance.
Pivot: 0.8315
1st Support: 0.8213
1st Resistance: 0.8519
Risk Warning:
Trading Forex and CFDs carries a high level of risk to your capital and you should only trade with money you can afford to lose. Trading Forex and CFDs may not be suitable for all investors, so please ensure that you fully understand the risks involved and seek independent advice if necessary.
Disclaimer:
The above opinions given constitute general market commentary, and do not constitute the opinion or advice of IC Markets or any form of personal or investment advice.
Any opinions, news, research, analyses, prices, other information, or links to third-party sites contained on this website are provided on an "as-is" basis, are intended only to be informative, is not an advice nor a recommendation, nor research, or a record of our trading prices, or an offer of, or solicitation for a transaction in any financial instrument and thus should not be treated as such. The information provided does not involve any specific investment objectives, financial situation and needs of any specific person who may receive it. Please be aware, that past performance is not a reliable indicator of future performance and/or results. Past Performance or Forward-looking scenarios based upon the reasonable beliefs of the third-party provider are not a guarantee of future performance. Actual results may differ materially from those anticipated in forward-looking or past performance statements. IC Markets makes no representation or warranty and assumes no liability as to the accuracy or completeness of the information provided, nor any loss arising from any investment based on a recommendation, forecast or any information supplied by any third-party.

USD_CHF LOCAL BULLISH BIAS|LONG|
✅USD_CHF is making a local
Bearish correction and will
Soon retest a horizontal
Support of 0.8320 from where
We will be expecting a
Local bullish rebound
And a move up
LONG🚀
✅Like and subscribe to never miss a new idea!✅
Disclosure: I am part of Trade Nation's Influencer program and receive a monthly fee for using their TradingView charts in my analysis.

READY TO RISE TOWARDS 0.8570Dear traders, as you may notice, based on the chart, the price is moving inside a bullish pennant, while, the short-term trend is also bullish. By the breakout of the pennant, next station would be 0.8570. Let's See!

USDCHF Weekly Chart Long Positions AB=CD+ BBUSDCHF Weekly Chart Long Positions AB=CD+ BB
Price is also on Fibo E level support + RSI on 23 and Sto on 5.5
And more tools show this is the turning point

USDCHF looking to fly higher and higherHello Guys,
A recent bullish shift in USDCHF has been monitored and we are in good levels to go long and TARGET 0.8585 level.
as long as we are above 0.8250 level bias is bullish.
Regards
Rizwan Ali
