USDCHFThe latest COT data suggested relative strength in the Swissy. The price action also indicated that upside momentum has been meeting obstacles despite a seemingly strong recovery in the Dixie. I'd be interested in shorting this asset, if the opportunity presents it to me.
CHFUSD trade ideas

USDCHF 30M | Fair Value Gap Sell Setup Inside Bearish Channel📊 USD/CHF Smart Money Breakdown — May 16, 2025
Here’s a clean SMC-driven setup where price respects the bearish order flow, taps a Fair Value Gap (FVG) and rejects right at liquidity inducement levels.
Let’s break it down 👇
🔍 1. Context
Price is respecting a descending channel structure
Clean internal liquidity run up into:
✅ FVG zone from prior imbalance
✅ Top of bearish channel trendline
This is a classic liquidity sweep before expansion lower
🎯 2. Entry Plan
Entry zone: 0.8375–0.8391 (FVG zone shaded in red)
Stop loss: Just above 0.8391 (invalidates FVG zone)
Target zone:
🟢 TP1 → 0.8340 (minor inefficiency fill)
🟢 TP2 → 0.8327 (liquidity resting at the low)
➡️ RR ratio is about 1:3 on full target — clean sniper range!
📉 3. Smart Money Logic
Retail likely triggered buy orders into that FVG zone
Institutions tap FVG for premium entry
Price already printing rejection wicks — early signs of displacement
Watch for confirmation via:
Bearish engulfing candle close
Break of minor bullish structure on 5m
⚠️ Risk Notes:
Watch out for USD fundamental news that might cause a fakeout spike
Let price confirm breakdown before stacking entries
💬 Do you trust the FVG? Or think price will smash through?
🧠 Drop your confluence in the comments below and follow @ChartNinjas88 for precision setups like this every day.

USD-CHF Growth Ahead! Buy!
Hello,Traders!
USD-CHF made a bullish
Rebound from the horizontal
Support level around 0.8318
So we are locally bullish
Biased and we will be
Expecting further growth
On Monday
Buy!
Comment and subscribe to help us grow!
Check out other forecasts below too!
Disclosure: I am part of Trade Nation's Influencer program and receive a monthly fee for using their TradingView charts in my analysis.

USDCHF looks ready to resume the downtrend .the week of 19 May The area between 0.8434 and 0.8330 has been a strong support all year but got broken to the downside on 10 April. Since then, this pair gave several day trades as it pulled back to the zone (see my previous posts). As my daily chart shows, the recent retracement helped price to catch up to the 50ema and is now nicely below it.
I will be monitoring price action also on H4 to confirm if my analysis is correct and act if appropriate. We could be looking at a trade with +350 pips potential in uncertain times (due to unconventional Trumpeconomics) so I would be prepared for large swings and the need to hold the trade for extended time periods.
This is not a trade recommendation; it’s merely my own analysis. Trading carries a high level of risk so carefully managing your capital and risk is important. If you like my idea, please give a “boost” and follow me to get even more.
It’s not whether you are right or wrong, but how much money you make when you are right and how much you lose when you are wrong – George Soros

USDCHF 16 Friday 2025USDCHF I'm still looking @ further shorts as long as current supply holds.
Lower timeframe fractal highs should be swept for A+ sell continuation set up confluence then I will look for structure shift on lower timeframe.

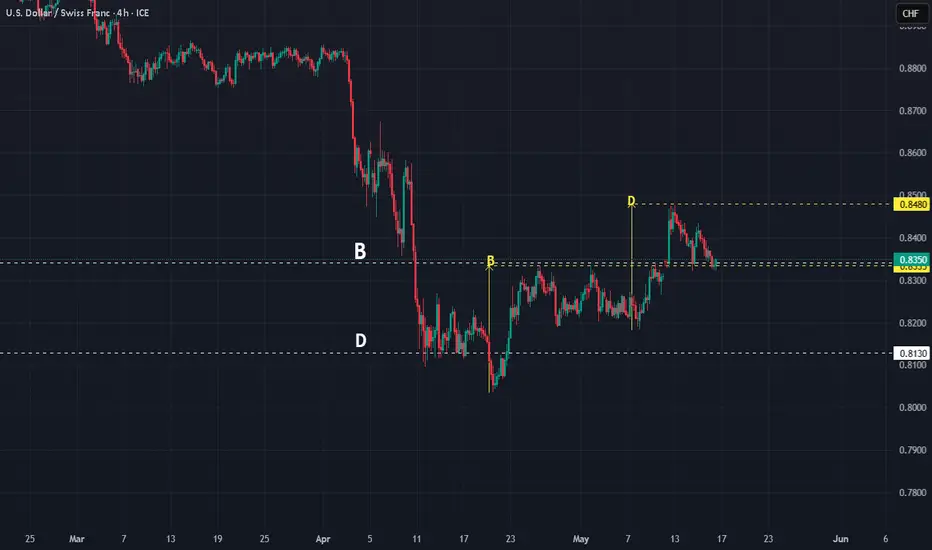
USDCHF : The fine point in playing the DSo far, I have been writing about playing the D - The D is he final point in the price movement, something which we ANTICIPATE.
What do we anticipate?
We anticipate a REVERSAL. In simple terms, we trade 'opposing' the trend.
Why?
The explanation is simple - Buy when Low. Sell when High.
Once the complete structure is complete, then we have a clear picture of price action. Our understanding is correct. Price did as we anticipated.
Now, price had bounced upward from a long term D, chances are it will go up more. Price is now a two Bs, one BIG, and another small. Not a coincidence but it is price telling us something - a confirmation of future direction.
BUY. The R/R is fantastic.
Good luck.
USDCHF 1H (BOS 5m + Demand 5m + IMB + OTE)Hello traders!
As you see price wants to close fully GAP. Near our POI(BOS 5m + Demand) - I expecting reversal from demand zone.
TP - MINIMUM to global GAP 1W.
Have a profitable day and don't forget to subscribe for updates!

USDCHF 4HHello traders welcome back
USDCHF what a nice setup if you interested more don't forget to follow me

USDCHF BUY 0.8219On the 4-hour chart, USDCHF is in a short-term shock and retreat, and the current downside target is looking at the previous demand area. If the price reaches around 0.8219, pay attention to the potential bullish bat pattern.

Bullish bounce off pullback support?The Swissie (USD/CHF) is falling towards the pivot which aligns with the 50% Fibonacci retracement and could bounce to the 1st resistance, which is also a pullback resistance.
Pivot: 0.8315
1st Support: 0.8213
1st Resistance: 0.8519
Risk Warning:
Trading Forex and CFDs carries a high level of risk to your capital and you should only trade with money you can afford to lose. Trading Forex and CFDs may not be suitable for all investors, so please ensure that you fully understand the risks involved and seek independent advice if necessary.
Disclaimer:
The above opinions given constitute general market commentary, and do not constitute the opinion or advice of IC Markets or any form of personal or investment advice.
Any opinions, news, research, analyses, prices, other information, or links to third-party sites contained on this website are provided on an "as-is" basis, are intended only to be informative, is not an advice nor a recommendation, nor research, or a record of our trading prices, or an offer of, or solicitation for a transaction in any financial instrument and thus should not be treated as such. The information provided does not involve any specific investment objectives, financial situation and needs of any specific person who may receive it. Please be aware, that past performance is not a reliable indicator of future performance and/or results. Past Performance or Forward-looking scenarios based upon the reasonable beliefs of the third-party provider are not a guarantee of future performance. Actual results may differ materially from those anticipated in forward-looking or past performance statements. IC Markets makes no representation or warranty and assumes no liability as to the accuracy or completeness of the information provided, nor any loss arising from any investment based on a recommendation, forecast or any information supplied by any third-party.

USD_CHF LOCAL BULLISH BIAS|LONG|
✅USD_CHF is making a local
Bearish correction and will
Soon retest a horizontal
Support of 0.8320 from where
We will be expecting a
Local bullish rebound
And a move up
LONG🚀
✅Like and subscribe to never miss a new idea!✅
Disclosure: I am part of Trade Nation's Influencer program and receive a monthly fee for using their TradingView charts in my analysis.

READY TO RISE TOWARDS 0.8570Dear traders, as you may notice, based on the chart, the price is moving inside a bullish pennant, while, the short-term trend is also bullish. By the breakout of the pennant, next station would be 0.8570. Let's See!

USDCHF Weekly Chart Long Positions AB=CD+ BBUSDCHF Weekly Chart Long Positions AB=CD+ BB
Price is also on Fibo E level support + RSI on 23 and Sto on 5.5
And more tools show this is the turning point

USDCHF looking to fly higher and higherHello Guys,
A recent bullish shift in USDCHF has been monitored and we are in good levels to go long and TARGET 0.8585 level.
as long as we are above 0.8250 level bias is bullish.
Regards
Rizwan Ali

USDCHF LONG FORECAST Q2 W20 D15 Y25USDCHF LONG FORECAST Q2 W20 D15 Y25
Professional Risk Managers👋
Welcome back to another FRGNT chart update📈
Diving into some Forex setups using predominantly higher time frame order blocks alongside confirmation breaks of structure.
Let’s see what price action is telling us today!
💡Here are some trade confluences📝
✅Weekly order block rejection
✅Daily order block rejection
✅15’ order block
✅Intraday bullish breaks of structure
🔑 Remember, to participate in trading comes always with a degree of risk, therefore as professional risk managers it remains vital that we stick to our risk management plan as well as our trading strategies.
📈The rest, we leave to the balance of probabilities.
💡Fail to plan. Plan to fail.
🏆It has always been that simple.
❤️Good luck with your trading journey, I shall see you at the very top.
🎯Trade consistent, FRGNT X

USD/CHF BUYAfter the price breaks out of the consolidation, it then retests and there is a pretty good rejection to hold the price back up. It is possible that the price will increase to the previous daily supply.

UPDATE ON USD/CHF ANALYSISUSD/CHF 4H - With this market we are wanting to see price break down also, we have seen that price has broken structure to the downside on the extreme higher timeframes. Price has recently come back up to test the neckline it broke.
It just so happens that there is also a FVG here, giving us multiple pieces of confluence suggest a potential area of interest for price to come and reverse from.
Now that we have seen price trade into this area, its important we wait for confirmation of a reversal as well as entry confirmation before we look to execute any short positions in the market.
Once we see price break the last protected low, we will then have the confirmation needed to suggest a reversal in this current trend, confirming the start of the next impulse to the downside. I will update you all when I have something.

USDCHF Breakout in Progress – Reversal from Key Support?#USDCHF
**Pair:** USDCHF
**Current Price:** ~0.8265
**Bias:** Bullish
---
**Analysis:**
USDCHF appears to be forming a **base structure near the 0.8265 level**, where buyers are gradually stepping in. The price has broken above a short-term consolidation zone (highlighted in red) and is now attempting to push higher.
This move suggests a potential **reversal from the recent downtrend**, especially if the price holds above the **0.8265 key support**. A successful breakout and retest scenario could propel USDCHF toward the **0.8600** and even **0.9000** levels.
---
**Technical Highlights:**
- **Support Level:** 0.8265 (established demand zone)
- **Breakout Pattern:** Consolidation breakout
- **Upside Target Zones:** 0.8600 and 0.9000
- **Invalidation:** Close below 0.8265
---
**Trade Idea (Not Financial Advice):**
Watch for a bullish retest above 0.8265 for continuation plays. Confirmation with bullish momentum may open the path to medium-term upside targets.
---
> **Disclaimer:**
> This content is for educational purposes only and does not constitute financial advice. Always perform your own analysis and manage your risk carefully. Trading involves substantial risk and is not suitable for every investor.

USDCHF-LongUSDCHF has started a bullish trend on DTF so we"ll take a long entry at the break of previous high

USDCHF BULLISH BOUNCE SUPPORT.?USDCHF market moved to bounce back towards aggressive buying this pattern support the market momentum bullish with some specific Targets.
1st Target 🎯 0.86750
Final Target 🎯 0.88500
Conclusion:
The momentum shows if the market moves according to my analysis and reached at my final target then keep holding your trades and make money millionaire.

USDCHF Short Term Buy Trade Update!!!The exchange rate of the US dollar against the Swiss franc is moving in a narrow range, trading around 0.8390 in the Asian session. After the sharp decline in April, the exchange rate is trying to bottom out and stabilize, but technical indicators suggest that the downside risk still exists. Meanwhile, the improvement in global trade relations and the change in the outlook of the Federal Reserve's policy are reshaping the market risk sentiment, thus affecting the Swiss franc, a safe - haven currency.
The Bollinger Bands indicator shows that the upper band is 0.8468, the middle band is 0.8259, and the lower band is 0.8049. The exchange rate is currently above the middle band of the Bollinger Bands, but there is still a distance from the upper band, indicating that the upward space may be limited. In addition, the CCI indicator reading is 129.7512, which has entered the overbought area, suggesting that there may be callback pressure in the short term.
you are currently struggling with losses, or are unsure which of the numerous trading strategies to follow, at this moment, you can choose to observe the operations within our channel.

USD/CHF 1H – Bearish Trend Supported by SNR Breakdown & AO Conv**Key Observations:**
1. **Support and Resistance (SNR) Dynamics:**
- The pair has breached critical support levels at **0.83952** and **0.83933**, signaling weakening bullish defense.
- Next immediate support lies at **0.83500**, followed by **0.83200**. A breakdown below these levels could accelerate bearish momentum.
- Previous supports (e.g., 0.84200–0.83952) now act as resistance, with **0.83933** serving as a key level for bears to defend.
2. **Awesome Oscillator (AO) Convergence:**
- The AO histogram shows a clear bearish shift, declining from **+0.01500** to **-0.00500**. This transition into negative territory reflects increasing downward momentum.
- The **convergence** between price action (lower lows) and the AO’s downward trajectory confirms bearish alignment.
**Bearish Outlook:**
- The breakdown below SNR levels, coupled with AO’s bearish convergence, suggests a high-probability downtrend.
- A sustained close below **0.83933** could target **0.83500** and **0.83200**. A retest of the former support-turned-resistance (0.83933–0.84200) would offer an entry opportunity for shorts.
**Risk Management:**
- A bullish invalidation would occur if price reclaims **0.84200** with AO reversing above zero.
- Place stop-loss above **0.84200** for short positions.
**Conclusion:**
USD/CHF favors bears on the 1H timeframe. Monitor SNR levels and AO for confirmation of continued downside.
**#Forex #USDCHF #TechnicalAnalysis**

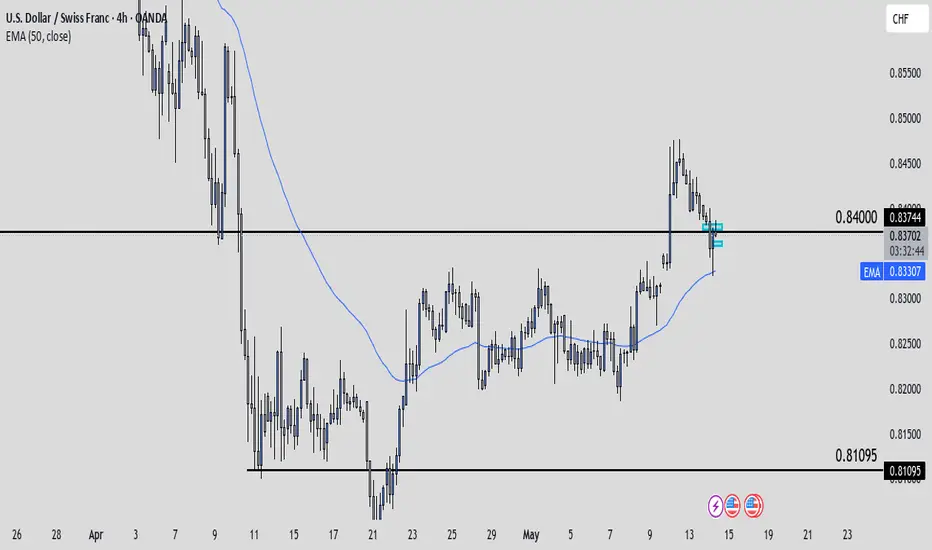
UsdChf Trade IdeaUC is currently at a higher time frame level of support. I'll personally be looking for shorts if price on the smaller time frames can give a shift in structure to support the short idea. If all goes well we could expect the low at 81095 to get tapped into again. Obviously I wouldn't be targeting that low. I'll be looking for a 1:3 - 1:4rr. We'll see what happens.