USDCHF likely to continue its bearish trendprice has completed its retracement from the .618 Fib level, also known as "golden pocket"; moreover, there is no any major sign of reversal. The projection of the bearish flag pattern s also shown on the chart. Instant selling with a marked stop loss would be good to enjoy decent profits
CHFUSD trade ideas

USDCHF INTRADAY bearish below 0.8270The USDCHF pair is exhibiting a bearish sentiment, reinforced by the ongoing downtrend. The key trading level to watch is at 0.8270, which represents the current intraday swing high and the falling resistance trendline level.
In the short term, an oversold rally from current levels, followed by a bearish rejection at the 0.8270 resistance, could lead to a downside move targeting support at 0.8040, with further potential declines to 0.7970 and 0.7900 over a longer timeframe.
On the other hand, a confirmed breakout above the 0.8270 resistance level and a daily close above that mark would invalidate the bearish outlook. This scenario could pave the way for a continuation of the rally, aiming to retest the 0.8344 resistance, with a potential extension to 0.8424 levels.
Conclusion:
Currently, the USDCHF sentiment remains bearish, with the 0.8270 level acting as a pivotal resistance. Traders should watch for either a bearish rejection at this level or a breakout and daily close above it to determine the next directional move. Caution is advised until the price action confirms a clear break or rejection.
This communication is for informational purposes only and should not be viewed as any form of recommendation as to a particular course of action or as investment advice. It is not intended as an offer or solicitation for the purchase or sale of any financial instrument or as an official confirmation of any transaction. Opinions, estimates and assumptions expressed herein are made as of the date of this communication and are subject to change without notice. This communication has been prepared based upon information, including market prices, data and other information, believed to be reliable; however, Trade Nation does not warrant its completeness or accuracy. All market prices and market data contained in or attached to this communication are indicative and subject to change without notice.

usd/chf short USD/CHF SHORT "break of a support area and retest it + 50% fib retracement + 50 ema dynamic resistance "

USDCHF: One More Bearish Wave Ahead?! 🇺🇸🇨🇭
It looks like USDCHF has successfully completed a consolidation
after quite an extended bearish rally.
A breakout of a support line of an ascending triangle pattern
on a 4H time frame provides a strong bearish confirmation.
We can expect a movement down at least to 0.81 level.
❤️Please, support my work with like, thank you!❤️
I am part of Trade Nation's Influencer program and receive a monthly fee for using their TradingView charts in my analysis.

USD/CHF H4 | Heading into a pullback resistanceUSD/CHF is rising towards a pullback resistance and could potentially reverse off this level to drop lower.
Sell entry is at 0.8130 which is a pullback resistance.
Stop loss is at 0.8277 which is a level that sits above the 38.2% Fibonacci retracement and a multi-swing-high resistance.
Take profit is at 0.7932 which is a support level that aligns with the 100.0% Fibonacci projection.
High Risk Investment Warning
Trading Forex/CFDs on margin carries a high level of risk and may not be suitable for all investors. Leverage can work against you.
Stratos Markets Limited (tradu.com):
CFDs are complex instruments and come with a high risk of losing money rapidly due to leverage. 63% of retail investor accounts lose money when trading CFDs with this provider. You should consider whether you understand how CFDs work and whether you can afford to take the high risk of losing your money.
Stratos Europe Ltd (tradu.com):
CFDs are complex instruments and come with a high risk of losing money rapidly due to leverage. 63% of retail investor accounts lose money when trading CFDs with this provider. You should consider whether you understand how CFDs work and whether you can afford to take the high risk of losing your money.
Stratos Global LLC (tradu.com):
Losses can exceed deposits.
Please be advised that the information presented on TradingView is provided to Tradu (‘Company’, ‘we’) by a third-party provider (‘TFA Global Pte Ltd’). Please be reminded that you are solely responsible for the trading decisions on your account. There is a very high degree of risk involved in trading. Any information and/or content is intended entirely for research, educational and informational purposes only and does not constitute investment or consultation advice or investment strategy. The information is not tailored to the investment needs of any specific person and therefore does not involve a consideration of any of the investment objectives, financial situation or needs of any viewer that may receive it. Kindly also note that past performance is not a reliable indicator of future results. Actual results may differ materially from those anticipated in forward-looking or past performance statements. We assume no liability as to the accuracy or completeness of any of the information and/or content provided herein and the Company cannot be held responsible for any omission, mistake nor for any loss or damage including without limitation to any loss of profit which may arise from reliance on any information supplied by TFA Global Pte Ltd.
The speaker(s) is neither an employee, agent nor representative of Tradu and is therefore acting independently. The opinions given are their own, constitute general market commentary, and do not constitute the opinion or advice of Tradu or any form of personal or investment advice. Tradu neither endorses nor guarantees offerings of third-party speakers, nor is Tradu responsible for the content, veracity or opinions of third-party speakers, presenters or participants.

USDCHF LONG FORECAST Q2 W17 D22 Y25USDCHF LONG FORECAST Q2 W17 D22 Y25
Summary
- Weekly order block
- Daily order block
- Price is currently bearish
Requirements
- Wait for a comprehensive bullish turn around in price action
- 15' break of structure
USDCHF LONG FORECAST Q2 W17 D22 Y25
FRGNT X
IG - JCFRGNT

USD/CHF Collapses to Fresh Decade+ Lows – Oversold?The U.S. dollar continues to slide against the Swiss franc, with USD/CHF falling below 0.8100 and hitting its lowest level since 2015. The technical picture remains heavily bearish:
📉 Price is well below the 50- and 200-day SMAs
⚠️ RSI is deeply oversold at 26.21, but showing no bullish divergence yet
📉 MACD is accelerating to the downside, confirming downside momentum
🔻 Support at 0.8400 was shattered and may now act as resistance
While a short-term bounce could emerge due to oversold conditions, the downtrend remains firmly intact. A close below 0.8075 opens the door to a potential test of the psychological 0.8000 handle.
-MW

Institutional Demand: USD/CHF longsHey,
Another beautiful pullback play is likely for many USDs this week.
NU, GU, EU etc are all in or near value.
Together with USD/CHF also moving towards a key area of value.
I'll patiently wait till price reaches it and then look for our 4-hour confirmation.
Kind regards,
Max Nieveld

check the trendThe downtrend is expected to continue until the specified support levels are formed. Then there is a possibility of a trend change.

USDCHF - NEW BREAKDOWN !Hello Traders !
After a huge bearish move, the USDCHF broke the support level (0.83326 - 0.84152).
This key level becomes new resistance !
So, I expect a new bearish move📉
_______________
TARGET: 0.79300🎯

USDCHF: Classic Trend-Following Trading Setup Analyzing the price movement of 📉USDCHF.
Following a significant downward trend, the price started to consolidate within a horizontal channel on a 4-hour chart.
The violation of the channel's lower boundary indicates a strong bearish indication, suggesting a likely continuation of the downward trend.
Goal - 1.4902

USDCHF H4 I Bullish Bounce OffBased on the H4 chart analysis, the price is falling toward our buy entry level at 0.8044, aligning with the 161.8% FIbo extension.
Our take profit is set at 0.8114, a pullback resistance.
The stop loss is placed at 0.8163, a pullback resistance.
High Risk Investment Warning
Trading Forex/CFDs on margin carries a high level of risk and may not be suitable for all investors. Leverage can work against you.
Stratos Markets Limited (tradu.com):
CFDs are complex instruments and come with a high risk of losing money rapidly due to leverage. 63% of retail investor accounts lose money when trading CFDs with this provider. You should consider whether you understand how CFDs work and whether you can afford to take the high risk of losing your money.
Stratos Europe Ltd (tradu.com):
CFDs are complex instruments and come with a high risk of losing money rapidly due to leverage. 63% of retail investor accounts lose money when trading CFDs with this provider. You should consider whether you understand how CFDs work and whether you can afford to take the high risk of losing your money.
Stratos Global LLC (tradu.com):
Losses can exceed deposits.
Please be advised that the information presented on TradingView is provided to Tradu (‘Company’, ‘we’) by a third-party provider (‘TFA Global Pte Ltd’). Please be reminded that you are solely responsible for the trading decisions on your account. There is a very high degree of risk involved in trading. Any information and/or content is intended entirely for research, educational and informational purposes only and does not constitute investment or consultation advice or investment strategy. The information is not tailored to the investment needs of any specific person and therefore does not involve a consideration of any of the investment objectives, financial situation or needs of any viewer that may receive it. Kindly also note that past performance is not a reliable indicator of future results. Actual results may differ materially from those anticipated in forward-looking or past performance statements. We assume no liability as to the accuracy or completeness of any of the information and/or content provided herein and the Company cannot be held responsible for any omission, mistake nor for any loss or damage including without limitation to any loss of profit which may arise from reliance on any information supplied by TFA Global Pte Ltd.
The speaker(s) is neither an employee, agent nor representative of Tradu and is therefore acting independently. The opinions given are their own, constitute general market commentary, and do not constitute the opinion or advice of Tradu or any form of personal or investment advice. Tradu neither endorses nor guarantees offerings of third-party speakers, nor is Tradu responsible for the content, veracity or opinions of third-party speakers, presenters or participants.

USDCHF SELLSPrice is still bearish therefore I’m only interested in sells for now. I’d wait for price to breakout of this h4 range then I’ll look for sells towards 0.78250 area.

USDCHF Discretionary Analysis: Bounce at 0.85Hello traders.
I'm anticipating the momentum on USDCHF to carry on. Got my eyes locked on the 0.85 area. It might turn into a strong bounce point. If the signs are there, I'm jumping in with a short.
Discretionary Trading: Where Experience Becomes the Edge
Discretionary trading is all about making decisions based on what you see, what you feel, and what you've learned through experience. Unlike systematic strategies that rely on fixed rules or algorithms, discretionary traders use their judgment to read the market in real time. It's a skill that can't be rushed, because it's built on screen time, pattern recognition, and the ability to stay calm under pressure.
There's no shortcut here. You need to see enough market conditions, wins, and losses to build that intuition—the kind that tells you when to pull the trigger or sit on your hands. Charts might look the same, but context changes everything, and that's something only experience can teach you.
At the end of the day, discretionary trading is an art, refined over time, sharpened through mistakes, and driven by instinct. It's not for everyone, but for those who've put in the work, it can be a powerful way to trade.


bullish_engulfing = close[2] < open[2] and close[1] > open[1] anbullish_engulfing = close < open and close > open and close > open
bearish_engulfing = close > open and close < open and close < open

Strong bullish bias!After a strong drop and stabilization, where the price did not make a new lower low, we are only looking for buying opportunities, assuming the price bounces from the marked lower zone.
The full analysis is shown on the chart.

USDCHF short bullish push for expect
OANDA:USDCHF in last periods strong bearish trend we are have, currently after today's and yesterdays events here expecting short bullish push.
Pattern ASCENDING TRIANGL visible.
SUP zone: 0.81200
RES zone: 0.83600

USDCHF Technicals & Fundamentals🔹 Structure:
Pivot zone marked around 0.8200 (purple line + yellow zone).
Support below at ~0.8160.
Resistance around 0.8240.
Currently trading at 0.82137, trying to reclaim the pivot zone.
🔹 Price Action Outlook:
Bearish Bias: Based on the projected path, the expectation is for USD/CHF to:
Reject near 0.823–0.824.
Retest the pivot zone and fail to hold.
Begin a slow grind down back to the 0.8160 support, and potentially break it toward 0.8080.
🔹 Volume:
Volume appears mixed but increasing slightly — indicating growing interest at this level, possibly setting up for a breakout (or breakdown).
🌍 Fundamentals
🔸 USD Side:
Recent U.S. CPI & Fed rhetoric suggest inflation is sticky.
Rate cut expectations are being delayed, which supports the dollar in general.
However, geopolitical tensions and slowing data may keep the USD volatile.
🔸 CHF Side:
Swiss Franc remains a safe-haven currency.
SNB (Swiss National Bank) has adopted a relatively dovish stance but supports stability.
If global risk sentiment worsens, CHF may strengthen despite policy stance.
🔸 Combined View:
Risk-off sentiment = CHF strength
Strong USD = resistance holding
This combo fits with the technical expectation of a fade from resistance and downtrend continuation.
NOTE:
If USD/CHF fails to stay above the pivot (0.8200), we could see a slow bearish fade back toward 0.8080, as fundamentals hint at CHF strength returning amid global uncertainties.

Daily Price Action: USDCHF Thursday 4/17/2025In this video, we will be looking into the potential price action of USDCHF.

USDCHF BUY?RSI on daily time frame is showing oversold which could be a sign of exhaustion.
Based on Daily & 4HR TF, the market seems to be forming a possible reversal pattern which could lead to a possible reversal.
We could see BUYERS coming in strong should the current level hold.
Disclaimer:
Please be advised that the information presented on TradingView is solely intended for educational and informational purposes only.The analysis provided is based on my own view of the market. Please be reminded that you are solely responsible for the trading decisions on your account.
High-Risk Warning
Trading in foreign exchange on margin entails high risk and is not suitable for all investors. Past performance does not guarantee future results. In this case, the high degree of leverage can act both against you and in your favor

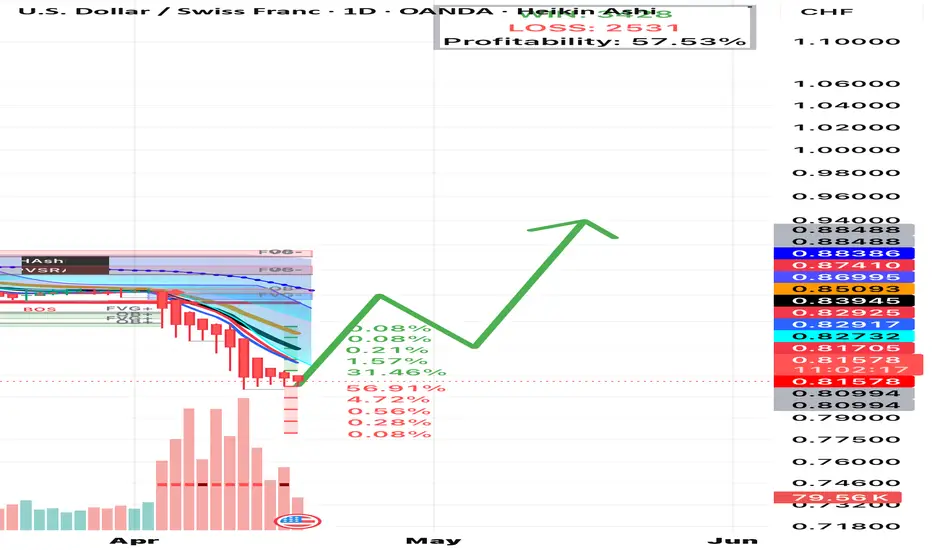
TP 0.9349 coming Very beautiful bottom formed this pair , this now ready for move higher highs to make new highs on daily time frame waiting for biggest pump ever on this pair because this is only currently bottom in lets go now moon flight ✈️
USDCHF – 15-Minute Chart Analysis (April 17, 2025)📌 Key Observations:
🔴 Supply Zone:
0.89180 – 0.89489 (approx)
Marked by the olive green box and red SL zone.
Price previously touched this zone → strong rejection → created a valid Supply Zone.
🔹Resistance Flip at 0.88800:
Clearly respected on retest after the drop.
Price came back to retest this area and failed to close above it — confirming it as a strong resistance (RTO – Return to Origin).
📉 Bearish Market Structure:
After rejecting from supply, price made lower highs and lower lows.
The recent consolidation near 0.8840–0.8850 indicates potential for another leg down.
✅ Trade Setup (Shown on Chart):
Sell Entry: Around 0.88400–0.88500
SL: Just above 0.89489 (above the last supply rejection wick).
TP: Looks to be around 0.8718 or further, possibly targeting a FVG fill or demand zone.
⚖️ Confluences Supporting the Short:
Technical Element Status
Supply zone rejection ✅ Confirmed
Bearish BOS (Break of Structure) ✅ Done
RTO at resistance ✅ Valid
Consolidation before potential drop ✅ Present
Risk:Reward ✅ Appears to be 1:4+
⚠️ Watch Out:
Agar price breaks and holds above 0.8890–0.8910, then bearish bias weaken ho sakta hai.
Aggressive NY or economic news can also spike price for liquidity grab.
