Possible Bearish Market on USDCHFUSDCHF has been moving between support and resistance levels thereby creating a sideways movement on daily and weekly timeframes, also creating some flag patterns, currently, there is a potential sells on weekly and daily timeframes,
we might see a little movement up to the resistance zone at 92081, creating a triple top pattern before starting the downward movement again.
let's watch out for the market this week.
like and share your opinion
CHFUSD trade ideas

USDCHF where will it go weekly chart for USDCHF with critical point of contact highlighted. where will it go and will it respect the key level

USDCHF bearish continuation below 0.8540Market Sentiment:
The prevailing trend for USDCHF remains bearish, with the recent price action appearing to be an oversold bounce rather than a sustained recovery.
Key Levels:
Resistance: 0.8540 (Previous consolidation zone)
Support Levels: 0.8335 followed by 0.8265 and 0.8200
Potential Scenarios:
Bearish Continuation: If USDCHF fails to break above0.8540 and faces rejection, it could resume its downtrend, targeting 0.8335 initially, followed by 0.8265 and 0.8200 over the longer term.
Bullish Breakout: A confirmed breakout and daily close above 0.8535 would shift the sentiment bullish, paving the way for a rally toward 0.8600 and potentially 0.8650
Conclusion:
USDCHF remains in a bearish structure unless a breakout above 0.8535 is confirmed. Until then, price action suggests that any rally is likely to be a short-term relief within a broader downtrend.
This communication is for informational purposes only and should not be viewed as any form of recommendation as to a particular course of action or as investment advice. It is not intended as an offer or solicitation for the purchase or sale of any financial instrument or as an official confirmation of any transaction. Opinions, estimates and assumptions expressed herein are made as of the date of this communication and are subject to change without notice. This communication has been prepared based upon information, including market prices, data and other information, believed to be reliable; however, Trade Nation does not warrant its completeness or accuracy. All market prices and market data contained in or attached to this communication are indicative and subject to change without notice.

USD/CHF For Bearishwait for pull-back near entry point and then go short
general trend is down trend
have fun :)

USDCHF and back down to the zone around 0.84000USDCHF continues its bearish trend since mid-January and all indications are that we will see a return back down to the zone around 0.84000. The pair failed to break above the EMA 200 weekly moving average, which further increased the pressure on the dollar.


USDCHFRSI indicates Bullish Divergence. Which means that at any time the market trend can change to HH and HL.

Buy usdchfStrong buy expected now
Weekly already too oversold pair
Here we r expecting strong bullish correction

Buy usdchf Our sell idea hited our both target
Now we looking for buy because already too over sold on weekly time frame
Here bullish correction expected

USDCHF: Forecast & Trading Plan
The analysis of the USDCHF chart clearly shows us that the pair is finally about to go up due to the rising pressure from the buyers.
Disclosure: I am part of Trade Nation's Influencer program and receive a monthly fee for using their TradingView charts in my analysis.
❤️ Please, support our work with like & comment! ❤️

USD/CHF Bearish Trade Setup – Supply Zone Rejection🔹 CHoCH (Change of Character) – 📉 A key shift in market structure indicating bearish momentum.
🔹 SBR + DBD Zone (Support Becomes Resistance & Drop Base Drop) – 🚧 This blue zone is a strong resistance area where sellers are likely to step in.
🔹 Stop Loss (🚨) – Positioned above 0.84742, marking a risk level if price moves against the trade.
🔹 Entry Zone (🔵) – Inside the resistance zone, where price is expected to reject and continue downward.
🔹 Target Zone (🎯) – 0.82553, indicating a potential profit of around 2.01% downward movement (-169.7 pips).
🔹 Bearish Confirmation (🔻) – Price already reacted to the zone, showing rejection.
This chart suggests a short-selling opportunity, expecting the price to drop further after rejecting resistance. 📊🔥

USD/CHF BEARS WILL DOMINATE THE MARKET|SHORT
Hello, Friends!
USD/CHF pair is in the downtrend because previous week’s candle is red, while the price is obviously rising on the 2H timeframe. And after the retest of the resistance line above I believe we will see a move down towards the target below at 0.846 because the pair is overbought due to its proximity to the upper BB band and a bearish correction is likely.
Disclosure: I am part of Trade Nation's Influencer program and receive a monthly fee for using their TradingView charts in my analysis.
✅LIKE AND COMMENT MY IDEAS✅

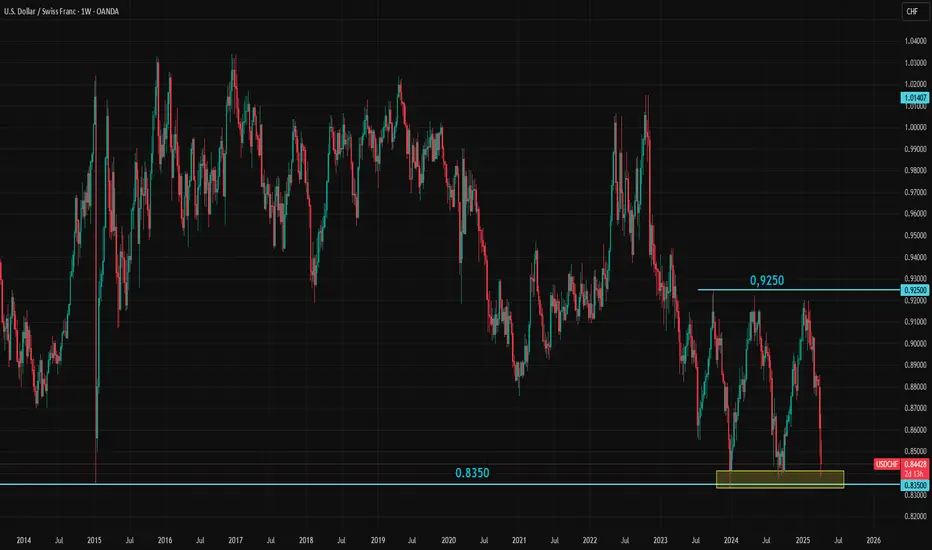
USDCHF Tests 0.8350: Break or Bounce?USDCHF is testing the critical 0.8350 support level amid rising safe haven demand. Yesterday’s chaos in the bond market highlighted how few places investors have to park their money. One of the most widely accepted safe haven assets is the Swiss franc, and current demand for CHF is clearly strong. But is it strong enough?
There hasn't been a weekly close below 0.8350 since 2011, and this level has held firm through several sharp market moves since then. Now, this major support is being tested once again.
Whether it breaks or holds, a significant swing trading opportunity could be on the horizon, especially given the heightened uncertainty surrounding the global trade environment.
USDCHF LONG FORECAST Q2 W15 D9 Y25 USDCHF LONG FORECAST Q2 W15 D9 Y25
Welcome Traders, Here's my take!

UCD/CHFDaily - Bearish
H1 order flow - Bearish
Both HT agrees with bearish narrative. Expect price to pullback into marked supply zones as POI of today.

USD/CHF Short Trade Setup: Resistance Rejection Analysis🔵 Resistance Area (Blue Box)
🟥 Stop Loss: 0.86283 🔴 (Red dot at the top)
🔹 Entry Point: 0.85993 🔵 (Blue dot in the middle)
🟢 Target Point: 0.84518 ✅ (Green dot at the bottom)
📉 Trade Plan:
📌 Short Entry at 0.85993 (Expecting rejection from resistance)
🚨 Stop Loss at 0.86283 (Above resistance to protect against breakout)
🎯 Target at 0.84518 (Potential downside move)
📊 Market Structure:
📉 Prior Downtrend: Strong bearish move before consolidation
🔄 Sideways Price Action: Price struggling in resistance
⚡ Possible Breakdown: Expecting a fall if price holds below resistance

Market Analysis: USD/CHF DivesMarket Analysis: USD/CHF Dives
USD/CHF declined and is now struggling below the 0.8615 resistance.
Important Takeaways for USD/CHF Analysis Today
- USD/CHF declined below the 0.8675 and 0.8615 support levels.
- There is a short-term bearish trend line forming with resistance near 0.8550 on the hourly chart at FXOpen.
USD/CHF Technical Analysis
On the hourly chart of USD/CHF at FXOpen, the pair started a fresh decline from well above the 0.8800 zone. The US Dollar dropped below the 0.8675 support to move into a negative zone against the Swiss Franc.
The bears pushed the pair below the 50-hour simple moving average and 0.8615. Finally, the bulls appeared near the 0.8420 level. A low was formed near 0.8421 and the pair is now consolidating losses.
On the upside, the pair could face resistance near the 0.8480 level. It is near the 23.6% Fib retracement level of the downward move from the 0.8674 swing high to the 0.8421 low. The next major resistance is near the 0.8550 level.
There is also a short-term bearish trend line forming with resistance near 0.8550. It coincides with the 50% Fib retracement level of the downward move from the 0.8674 swing high to the 0.8421 low, above which the pair could test the 0.8615 level.
If there is a clear break above the 0.8615 resistance zone, the pair could start another increase. In the stated case, it could even surpass 0.8675.
On the downside, immediate support on the USD/CHF chart is 0.8420. The first major support is near the 0.8400 level. The next major support is near 0.8350. Any more losses may possibly open the doors for a move toward the 0.8220 level in the coming days.
This article represents the opinion of the Companies operating under the FXOpen brand only. It is not to be construed as an offer, solicitation, or recommendation with respect to products and services provided by the Companies operating under the FXOpen brand, nor is it to be considered financial advice.

USDCHF Intraday Swing Idea 09/04/2025USDCHF Update – Swing Setup in Play
After a massive 150+ pip move to the downside yesterday, USDCHF is now retesting the 0.84482 zone. This level will be key for the next leg:
Sell Opportunity if 0.84482 holds as resistance
Break of 0.83981 confirms continuation to the downside
Target: 0.83366 (90+ pips from confirmation)
⚠️ A break back above 0.84482 could invalidate short-term sells, opening room for a pullback to 0.85082 before the next bearish wave.
Bias: Bearish, unless structure breaks above key levels.

USD/CHF Analysis Week 10 - Master-ShortKey Target: 0.83000 / 0.83500 (Master-Short Target)
Exciting week ahead! The analysis shows a clear downtrend – the target of 0.8300 remains in focus.
Market Situation & Structure
USD/CHF is currently at 0.88625, reflecting a decline of -0.37%.
The price has repeatedly gone through cyclical highs and lows, with the last high around 0.91500, followed by a downward movement.
The long-term structure indicates a possible continuation of the downtrend.

Buyer has coming to USDCHFThe daily timeframe shows a candle rejection, indicating that buyers have entered the market. On the 15-minute timeframe, there is a change in the main structure from bearish to bullish. Waiting for a pullback to the entry zone, with the first target at 0.86258 and the final target at 0.87664

USDCHF-Buy PlanDear Trader,
USDCHF Price now is bottom of Range Side,
and i expect price will bounce off to Targer 0.086200- 0.88000
If you enjoyed this forecast, please show your support with a like and comment. Your feedback is what drives me to keep creating valuable content."
Regards,
Alireza!

Ready to return? It seems that everything is ready, for the dollar to strengthen against the Swiss franc once again

USDCHF Forecast: Short Opportunity Detected by EASY Trading AIThe USDCHF shows a clear bearish signal according to EASY Trading AI strategy. A short entry recommendation is confirmed at the price level of 0.84681. Target for take profit is precisely set at 0.84135667 with a protective stop loss placed at 0.85635667.The EASY Trading AI system detected selling pressure building due to weakening bullish momentum, confirmed by recent resistance failures and bearish price patterns visible on shorter timeframes. Current market sentiment also aligns with selling USDCHF, supporting a likely downward move.Focus on disciplined trading, strictly respecting recommended entry, take profit, and stop loss levels.
