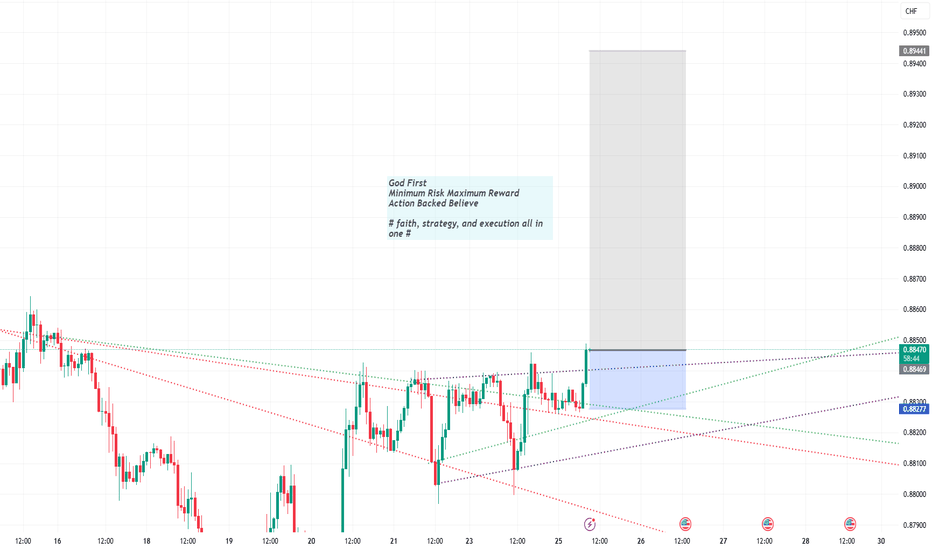
CHFUSD trade ideas
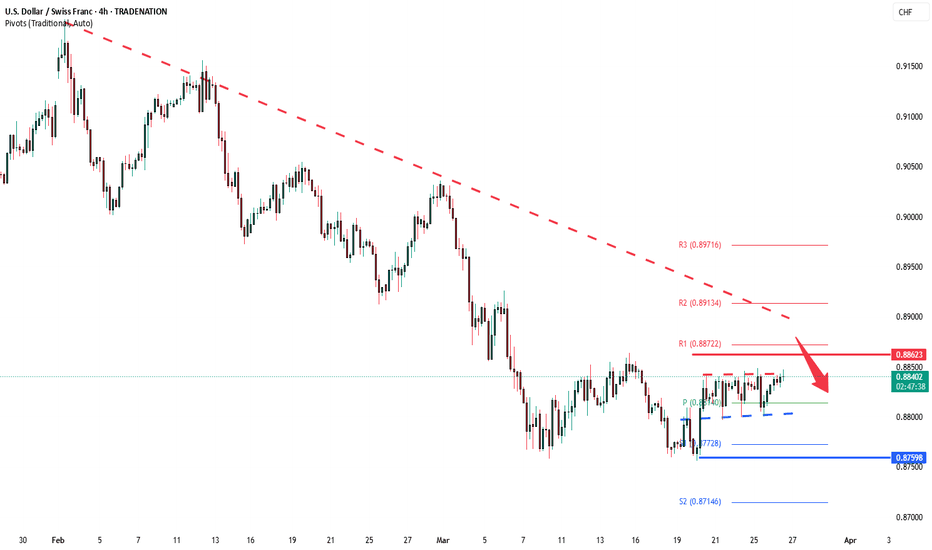
USDCHF INTRADAY sideways ranging capped by 0.8862The USD/CHF price action exhibits bearish sentiment, supported by the prevailing downtrend. The current intraday swing high at 0.8860 serves as a critical trading level, as the pair shows potential for an oversold rally before facing bearish rejection.
Key Levels to Watch:
Key Resistance: 0.8860 (current intraday swing high)
Immediate Support: 0.8760
Lower Support Levels: 0.8720, 0.8680
Upside Resistance Levels: 0.8913, 0.8970
Bearish Scenario:
An oversold rally toward the 0.8860 level, followed by a bearish rejection, could validate the downtrend and target the immediate support at 0.8760. Continued bearish momentum could extend the decline to 0.8720 and ultimately 0.8680 over the longer timeframe.
Bullish Scenario:
A confirmed breakout above the 0.8860 resistance level, accompanied by a daily close above this mark, would negate the bearish outlook. This scenario could trigger further rallies toward the next resistance levels at 0.8913 and 0.8970.
Conclusion:
The prevailing sentiment remains bearish amid the ongoing downtrend. Traders should closely monitor the 0.8860 level for potential bearish rejections or a bullish breakout. A sustained close above this resistance could signal a shift toward bullish momentum, while failure to break above would reinforce the bearish outlook.
This communication is for informational purposes only and should not be viewed as any form of recommendation as to a particular course of action or as investment advice. It is not intended as an offer or solicitation for the purchase or sale of any financial instrument or as an official confirmation of any transaction. Opinions, estimates and assumptions expressed herein are made as of the date of this communication and are subject to change without notice. This communication has been prepared based upon information, including market prices, data and other information, believed to be reliable; however, Trade Nation does not warrant its completeness or accuracy. All market prices and market data contained in or attached to this communication are indicative and subject to change without notice.
FXAN & Heikin Ashi Trade IdeaOANDA:USDCHF
In this video, I’ll be sharing my analysis of USDCHF, using FXAN's proprietary algo indicators with my unique Heikin Ashi strategy. I’ll walk you through the reasoning behind my trade setup and highlight key areas where I’m anticipating potential opportunities.
I’m always happy to receive any feedback.
Like, share and comment! ❤️
Thank you for watching my videos! 🙏
Could the Swissie bounce from here?The price has bounced off the pivot which acts as a pullback support and could rise to the 1st resistance.
Pivot: 0.8797
1st Support: 0.8760
1st Resistance: 0.8918
Risk Warning:
Trading Forex and CFDs carries a high level of risk to your capital and you should only trade with money you can afford to lose. Trading Forex and CFDs may not be suitable for all investors, so please ensure that you fully understand the risks involved and seek independent advice if necessary.
Disclaimer:
The above opinions given constitute general market commentary, and do not constitute the opinion or advice of IC Markets or any form of personal or investment advice.
Any opinions, news, research, analyses, prices, other information, or links to third-party sites contained on this website are provided on an "as-is" basis, are intended only to be informative, is not an advice nor a recommendation, nor research, or a record of our trading prices, or an offer of, or solicitation for a transaction in any financial instrument and thus should not be treated as such. The information provided does not involve any specific investment objectives, financial situation and needs of any specific person who may receive it. Please be aware, that past performance is not a reliable indicator of future performance and/or results. Past Performance or Forward-looking scenarios based upon the reasonable beliefs of the third-party provider are not a guarantee of future performance. Actual results may differ materially from those anticipated in forward-looking or past performance statements. IC Markets makes no representation or warranty and assumes no liability as to the accuracy or completeness of the information provided, nor any loss arising from any investment based on a recommendation, forecast or any information supplied by any third-party.
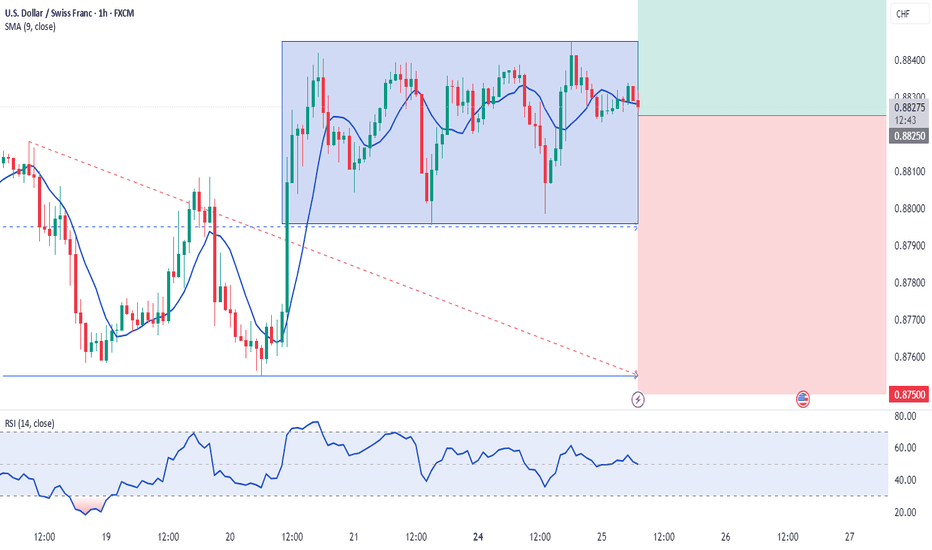
USDCHF | 25.03.2025BUY 0.88250 | STOP 0.87500 | TAKE 0.89250 | Technically, the price is likely to go up beyond the boundaries of the formed lateral local movement and consolidate above 0.88450, followed by a move to the level of 0.89250. The momentum is expected today on the publication of statistics from the United States. the indicators do not contradict this scenario.
USDCHF inverse Head and Shoulders USDCHF has formed a inverse head and shoulder pattern and its completing the right shoulder before it shoots up , lets not forget the fact that its on the level of strong support so and upward push could be expected , lets keep our eyes on it or else we will miss the opportunity
USDCHF - Range Reactions & Trendline Support HoldingPrice has been moving between a well-defined 1H support at 0.88016 and resistance at 0.88354, creating a clean range for intraday plays.
We recently saw price reject from 1H support, bounce off the ascending trendline, and begin pushing upward with bullish momentum. The MACD is attempting a bullish crossover, indicating possible continuation to the upside.
Trade Idea:
• Bias: Bullish short-term
• Entry: On retest of the ascending trendline or break above 0.88354
• Targets:
• TP1: 0.88354 (range resistance)
• TP2: 0.88600 (previous swing high)
• SL: Below trendline & 1H support (~0.87900)
Alternative Setup:
If price rejects 0.88354 again and breaks below the trendline, a short opportunity could develop back toward 0.88016 or even 0.87892.
Structure to Watch:
• Range: 0.88016–0.88354
• Trendline: Currently acting as dynamic support
• MACD: Watching for crossover confirmation
USDCHF Head & Shoulders: 400+ Pip Drop or Fakeout?USDCHF is showing a 131-day head and shoulders pattern, pointing to a possible 434-pip drop if it breaks below 0.8753. Even partial moves offer solid risk-reward, with setups ranging from 3.2 to 5.1. But be cautious—there’s also a chance of a failed pattern with upside potential. Fundamentals could decide the real breakout direction.
This content is not directed to residents of the EU or UK. Any opinions, news, research, analyses, prices or other information contained on this website is provided as general market commentary and does not constitute investment advice. ThinkMarkets will not accept liability for any loss or damage including, without limitation, to any loss of profit which may arise directly or indirectly from use of or reliance on such information.
USDCHF: Bullish Continuation is Expected! Here is Why:
The analysis of the USDCHF chart clearly shows us that the pair is finally about to go up due to the rising pressure from the buyers.
Disclosure: I am part of Trade Nation's Influencer program and receive a monthly fee for using their TradingView charts in my analysis.
❤️ Please, support our work with like & comment! ❤️
USDCHF NEXT MOVESell after bearish candle stick pattern, buy after bullish candle stick pattern....
Best bullish pattern , engulfing candle or green hammer
Best bearish pattern , engulfing candle or red shooting star
NOTE: IF YOU CAN'T SEE ANY OF TOP PATTERN IN THE ZONE DO NOT ENTER
Stop lost before pattern
R/R %1/%3
Trade in 5 Min Timeframe, use signals for scalping
CHF/USD – Double Bottom Reversal Setup - Trading SetupComprehensive Analysis of CHF/USD 4-Hour Chart
The CHF/USD 4-hour chart presents a technical trading setup based on a Double Bottom reversal pattern, combined with trendline support and key resistance levels. This pattern suggests a potential bullish breakout if key resistance is cleared. Below is a professional breakdown of the chart, covering the market structure, pattern formation, and a strategic trading setup.
1️⃣ Market Structure & Trend Analysis
The overall market structure suggests that CHF/USD has been in an uptrend, as indicated by the ascending trendline that has consistently provided support. The price has recently tested a key support zone twice, forming the Double Bottom pattern, which is known for signaling a trend reversal or continuation of an uptrend.
The dashed trendline connecting higher lows confirms the bullish momentum.
As long as the price stays above this trendline support, the bullish bias remains valid.
A break below the trendline would indicate a possible reversal or a deeper retracement.
The most critical observation here is that the price is respecting both the trendline and horizontal support zone, which increases the likelihood of a breakout in the upward direction.
2️⃣ Double Bottom Pattern Formation
The Double Bottom pattern is clearly formed at a strong demand zone, reinforcing the idea that buyers are stepping in to prevent further declines.
The first bottom was formed after a rejection from the 1.1250 - 1.1290 support zone.
The price then attempted to recover but faced resistance at 1.1350 - 1.1400, which now acts as the neckline of the pattern.
The second bottom was formed at approximately the same price level as the first, confirming the validity of the pattern.
A Double Bottom pattern is considered bullish, but confirmation is required through a breakout above the neckline resistance (1.1350 - 1.1400). If the price successfully breaks this level, it will indicate that buyers have regained control and the price is likely to move higher.
3️⃣ Key Support and Resistance Levels
In this setup, there are three crucial price zones: support, resistance, and the target area.
The support zone, located around 1.1250 - 1.1290, is where buyers stepped in to push the price higher. This level is crucial because it provided strong demand during the formation of the Double Bottom.
The resistance level at 1.1350 - 1.1400 serves as the neckline of the pattern. A breakout above this level would confirm the bullish trend continuation, while rejection could lead to another retest of support.
The target area is projected around 1.1500 - 1.1550, based on the measured move of the Double Bottom formation. This is the price level where traders may start taking profits if the bullish breakout occurs.
4️⃣ Trade Execution Plan
To take advantage of this potential setup, traders should focus on three key aspects: entry, stop-loss placement, and take-profit levels.
Entry Strategy
Aggressive traders can enter a long position above 1.1350, anticipating an immediate breakout.
Conservative traders may wait for a break and retest of the 1.1350 - 1.1400 zone, which would act as a confirmation for a sustained bullish move.
Stop-Loss Placement
A logical stop-loss should be set below 1.1138, which is beneath the Double Bottom formation and trendline support.
If the price drops below this level, it would invalidate the bullish setup and signal a potential trend reversal.
Profit Targets
The first target zone lies around 1.1450 - 1.1500, where traders may consider securing partial profits.
The extended target zone is 1.1550, which aligns with the expected measured move of the Double Bottom pattern.
5️⃣ Risk Management & Final Considerations
Since this setup is based on a strong trendline support and bullish pattern, risk management is essential to protect against fake breakouts or sudden trend reversals.
Traders should monitor price action near the 1.1350 - 1.1400 resistance zone. A strong bullish candle closing above this area increases the likelihood of a successful breakout.
If the price fails to break out and starts moving lower, it may indicate that sellers are still in control, which could lead to a deeper correction toward 1.1200 or lower.
6️⃣ Summary & TradingView Idea
This CHF/USD 4-hour chart presents a high-probability bullish setup based on a Double Bottom reversal at a strong support zone. The key confirmation level to watch is 1.1350 - 1.1400, which, if broken, will likely push the price toward 1.1500 - 1.1550.
Entry: Buy above 1.1350 or after a breakout retest.
Stop Loss: Below 1.1138 to avoid false breakouts.
Take Profit: First target at 1.1450 - 1.1500, extended target at 1.1550.
This setup provides a favorable risk-to-reward ratio, making it a strong potential trading opportunity. However, traders should always wait for confirmation signals before entering a position. 🚀

