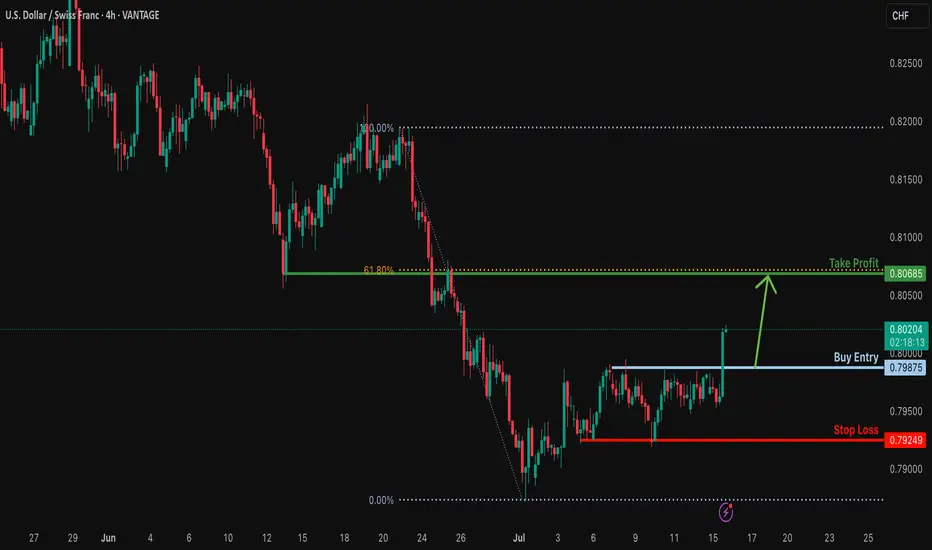
USD/CHF H1 | Multi-swing-low support at 61.8% Fibo retracementUSD/CHF is falling towards a multi-swing-low support and could potentially bounce off this level to climb higher.
Buy entry is at 0.7925 which is a multi-swing-low support that aligns closely with the 61.8% Fibonacci retracement.
Stop loss is at 0.7885 which is a level that lies underneath a multi-swing-low support and the 78.6% Fibonacci retracement.
Take profit is at 0.7974 which is a swing-high resistance.
High Risk Investment Warning
Trading Forex/CFDs on margin carries a high level of risk and may not be suitable for all investors. Leverage can work against you.
Stratos Markets Limited (tradu.com ):
CFDs are complex instruments and come with a high risk of losing money rapidly due to leverage. 63% of retail investor accounts lose money when trading CFDs with this provider. You should consider whether you understand how CFDs work and whether you can afford to take the high risk of losing your money.
Stratos Europe Ltd (tradu.com ):
CFDs are complex instruments and come with a high risk of losing money rapidly due to leverage. 63% of retail investor accounts lose money when trading CFDs with this provider. You should consider whether you understand how CFDs work and whether you can afford to take the high risk of losing your money.
Stratos Global LLC (tradu.com ):
Losses can exceed deposits.
Please be advised that the information presented on TradingView is provided to Tradu (‘Company’, ‘we’) by a third-party provider (‘TFA Global Pte Ltd’). Please be reminded that you are solely responsible for the trading decisions on your account. There is a very high degree of risk involved in trading. Any information and/or content is intended entirely for research, educational and informational purposes only and does not constitute investment or consultation advice or investment strategy. The information is not tailored to the investment needs of any specific person and therefore does not involve a consideration of any of the investment objectives, financial situation or needs of any viewer that may receive it. Kindly also note that past performance is not a reliable indicator of future results. Actual results may differ materially from those anticipated in forward-looking or past performance statements. We assume no liability as to the accuracy or completeness of any of the information and/or content provided herein and the Company cannot be held responsible for any omission, mistake nor for any loss or damage including without limitation to any loss of profit which may arise from reliance on any information supplied by TFA Global Pte Ltd.
The speaker(s) is neither an employee, agent nor representative of Tradu and is therefore acting independently. The opinions given are their own, constitute general market commentary, and do not constitute the opinion or advice of Tradu or any form of personal or investment advice. Tradu neither endorses nor guarantees offerings of third-party speakers, nor is Tradu responsible for the content, veracity or opinions of third-party speakers, presenters or participants.
CHFUSD trade ideas

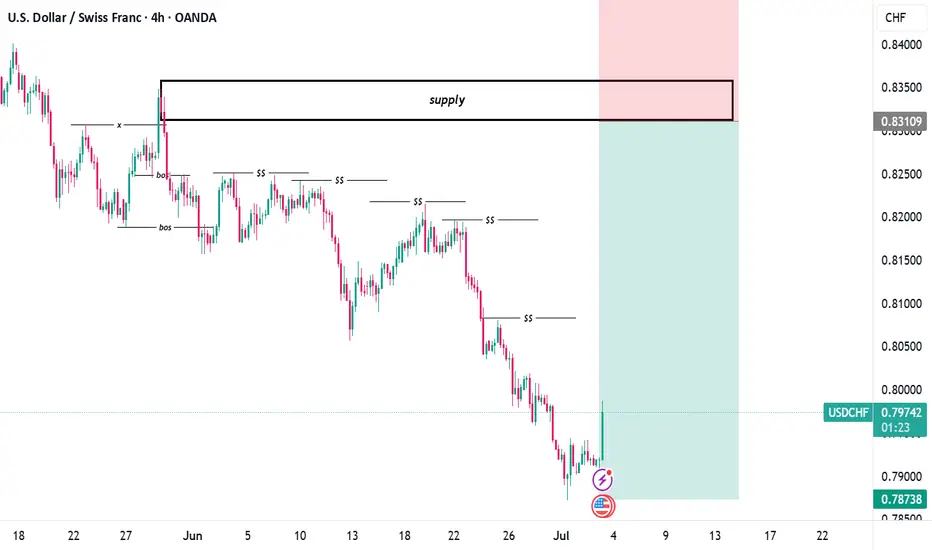
USD/CHF 4H – Pullback Into Supply Zone for Potential Reversal
🧠 USD/CHF 4H – Pullback Into Supply Zone for Potential Reversal
USD/CHF has been trading within a well-defined bearish structure over the past few weeks. Price action continues to respect lower highs and lower lows, with multiple short-term supports (SS) consistently being broken — confirming sustained selling pressure.
🔍 Market Structure & Smart Money Perspective
* A clear Break of Structure (BOS) early in the chart shifted market sentiment to bearish.
* Since then, the market has formed several short-term support levels, each broken successively.
* This confirms that bears are in control, and any rallies are likely corrective rather than a trend reversal — unless a new BOS to the upside forms.
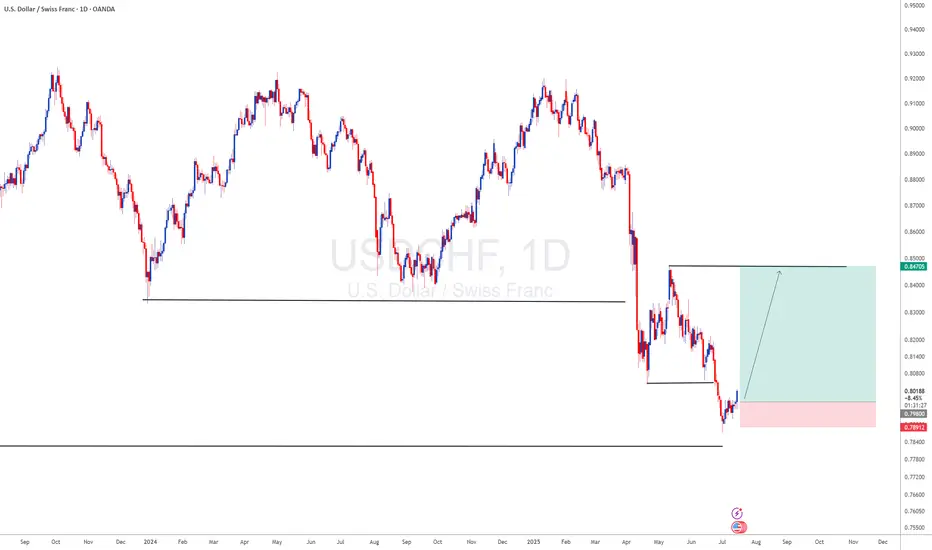
🧱 Supply Zone Analysis
* The marked supply zone around 0.83100 – 0.84000 is the last institutional distribution zone before the significant drop.
* Price is currently retracing aggressively into this premium zone, following a likely liquidity sweep of the previous lows.
* This reaction is typical of smart money behavior — sweeping liquidity before initiating a retracement to mitigate orders or fill imbalances.
📈 Current Price Action
* The large bullish impulse may seem like a shift in momentum, but without a confirmed break of major structure, this is viewed as a pullback into premium pricing.
* We anticipate that price will react to the supply zone, presenting a high-probability shorting opportunity.
📌 Trade Idea
* Bias: Bearish (pending confirmation from supply)
* Entry Zone: 0.83100 – 0.84000
* Stop Loss: Above 0.84000 (to cover potential liquidity spikes)
* Take Profit: 0.78738 (prior demand zone)
* Risk-to-Reward: Approx. 1:4+
🧠 Confirmation Triggers to Watch For:
* Bearish engulfing candlesticks within supply
* Internal BOS on lower timeframe (LTF)
* Fair Value Gap (FVG) formation and reaction
* Weak bullish momentum/tap-and-reject from zone
📌Conclusion
This setup aligns with the Smart Money Concept framework. As long as price remains below the supply zone, my bias remains short. I’ll wait for lower timeframe confirmation before executing the trade.
⚠️ Always manage risk — this is a zone of interest, not an automatic sell. Let price show its hand.
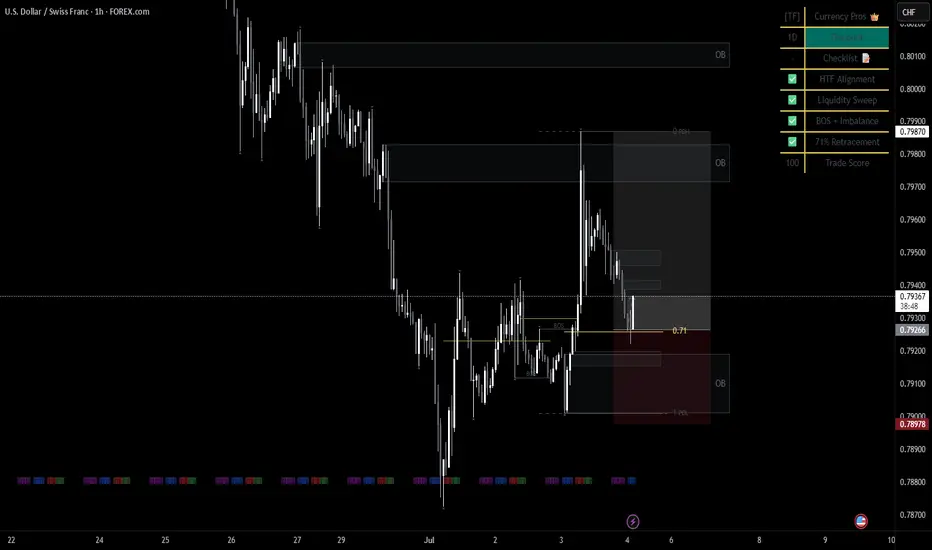
BUY USDCHFa few confirmations that influenced this trade. BOS, 71 fib & HTF alignment. I believe this will play out beautiful by Monday. lets goooooo
Usdchf long idea Piggybacking on the strong dollar idea as per previous posts. Today's data was positive for the greenback.
I want to see price draw higher into equal highs depicted with green line as an attractive premium liquidity pool.

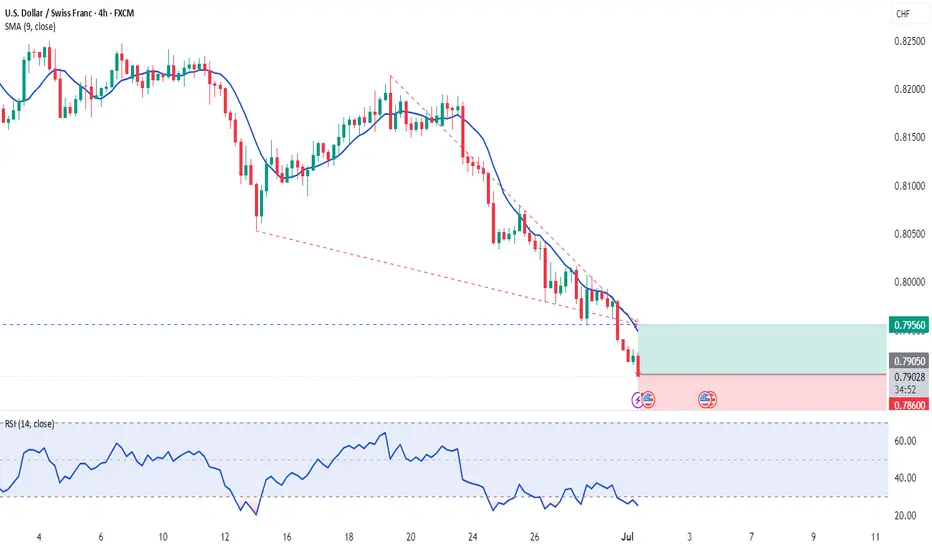
01.07.2025 #USDCHFBUY 0.79050 | STOP 0.78600 | TAKE 0.79560 | The impressive strength of the franc against the dollar. The pair is in a deep oversold condition. We expect a slight correction at these levels.
USD/CHF💰Symbol: { USD/CHF }
🟩Price: { 0.80217 }
🟥Stop: { 0.79601 }
1️⃣profit: { 0.80756 }
2️⃣profit: { 0.81214 }
3️⃣profit: { 0.81969 }
📊Check your chart before entering.
🚨Check before use to make sure there is no important news.🚨

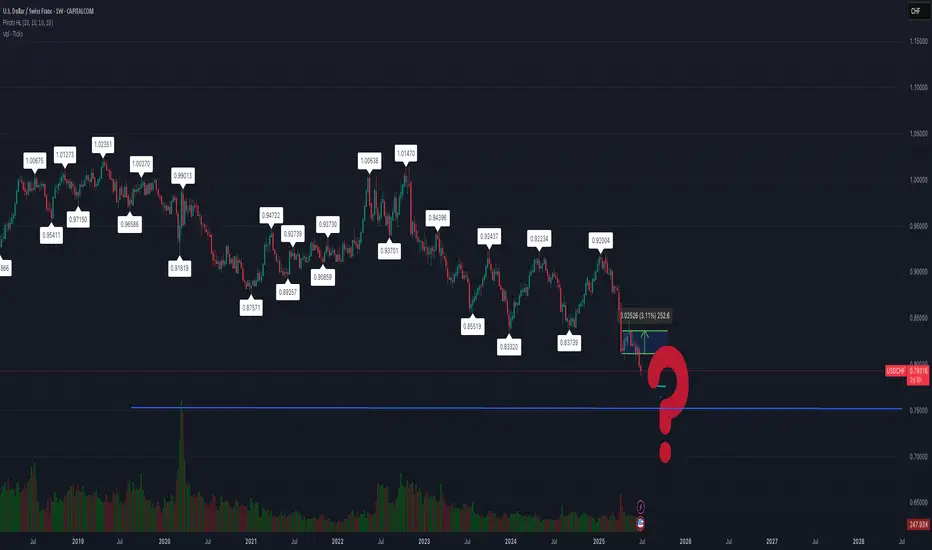
USDCHF5YR: Previous low broken at 1.0148 setting up bearish trend
11: RTM broken at 0.804 expecting trend continuation at the current previous day low.
FOREX USD/CHF🥇 CHF The Silent Assassin
While the world screamed about inflation, recession, and banana peels on the geopolitical stage, the Swiss Franc just stood there sipping Rivella and quietly murdered the competition.
+14.10% vs EUR?
+19.34% vs USD?
CHF walked into the forex party, didn’t say anything, and left with everyone’s respect.
🥈 USD – The Gym Bro on a Sugar Crash
Big muscles, loud talk, but oh no, look at those gains over time:
-4.41% vs EUR
-19.34% vs CHF
The USD resembles the guy who used to bench 250 and still talks about it while eating Doritos.
Rate hikes gave it a short-lived boost, but now it's just aired—trillions in debt and a lack of direction.
USDCHF oversold bounce backs capped at 0.8045The USD/CHF pair is currently trading with a bearish bias, aligned with the broader downward trend. Recent price action shows a retest of the falling resistance, suggesting a temporary relief rally within the downtrend.
Key resistance is located at 0.8045, a prior consolidation zone. This level will be critical in determining the next directional move.
A bearish rejection from 0.8045 could confirm the resumption of the downtrend, targeting the next support levels at 0.7900, followed by 0.7860 and 0.7810 over a longer timeframe.
Conversely, a decisive breakout and daily close above 0.8045 would invalidate the current bearish setup, shifting sentiment to bullish and potentially triggering a move towards 0.8080, then 0.8140.
Conclusion:
The short-term outlook remains bearish unless the pair breaks and holds above 0.8045. Traders should watch for price action signals around this key level to confirm direction. A rejection favours fresh downside continuation, while a breakout signals a potential trend reversal or deeper correction.
This communication is for informational purposes only and should not be viewed as any form of recommendation as to a particular course of action or as investment advice. It is not intended as an offer or solicitation for the purchase or sale of any financial instrument or as an official confirmation of any transaction. Opinions, estimates and assumptions expressed herein are made as of the date of this communication and are subject to change without notice. This communication has been prepared based upon information, including market prices, data and other information, believed to be reliable; however, Trade Nation does not warrant its completeness or accuracy. All market prices and market data contained in or attached to this communication are indicative and subject to change without notice.

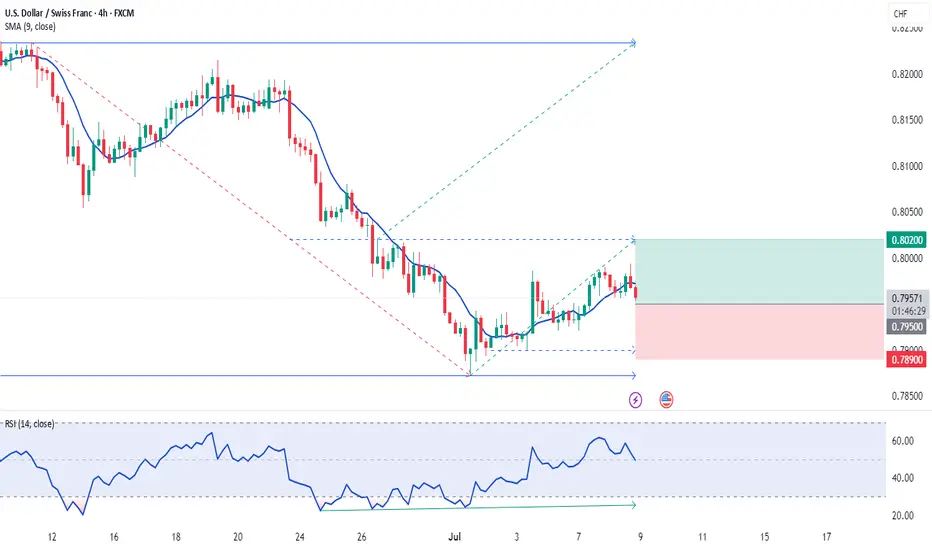
3 Daily Reversal SignalsIn this video we're taking a look at the OANDA:USDCHF , looking at the idea of this pair being overextended to the bearish side and looking to take advantage of potential bullish relief.
There are 3 main signals that we're looking for in this trading example.
1) The Relative Strength Index (RSI) being extremely oversold (currently around 12)
2) Price action trading completely outside the Keltner Channels
3) A low-test candlestick pattern signaling potential buying pressure.
As I mentioned in the video the actually strategy that this idea is based-on has some very specific parameters, but it is cool to see how and if it could be evolved to work in alternative ways.
If you have any questions, comments or want to share ideas, please do so below.
Akil

A long term downside completedThe dxy is starting a long term shift of market structure a long position can hold for a year
Bullish bounce?USD/CHF is falling towards the support level which is a pullback support and could bounce from this level to our take profit.
Entry: 0.7987
Why we like it:
There is a pullback support.
Stop loss: 0.7924
Why we like it:
There is a pullback support.
Take profit: 0.8068
Why we like it:
There is an overlap resistance that aligns with the 61.8% Fibonacci retracement.
Enjoying your TradingView experience? Review us!
Please be advised that the information presented on TradingView is provided to Vantage (‘Vantage Global Limited’, ‘we’) by a third-party provider (‘Everest Fortune Group’). Please be reminded that you are solely responsible for the trading decisions on your account. There is a very high degree of risk involved in trading. Any information and/or content is intended entirely for research, educational and informational purposes only and does not constitute investment or consultation advice or investment strategy. The information is not tailored to the investment needs of any specific person and therefore does not involve a consideration of any of the investment objectives, financial situation or needs of any viewer that may receive it. Kindly also note that past performance is not a reliable indicator of future results. Actual results may differ materially from those anticipated in forward-looking or past performance statements. We assume no liability as to the accuracy or completeness of any of the information and/or content provided herein and the Company cannot be held responsible for any omission, mistake nor for any loss or damage including without limitation to any loss of profit which may arise from reliance on any information supplied by Everest Fortune Group.
USD/CHF Tests Critical Resistance at 0.804FenzoFx—USD/CHF is testing the critical resistance level at 0.804, a demand zone that coincides with the descending trendline.
A new bearish wave would form if the price remains below this level. In this scenario, USD/CHF will likely retest the previous support level at 0.787.

7.15 USD/CHF WATCH FOR A PULLBACKThis market has a VERY strong S/R zone, certainly worth keeping an eye on for the pullback and the other indicators to line up with it.........4 Hour chart is what I use for the setup then I go down to the 1 Hour chart for the entry. We will wait and see if this develops into something for us.

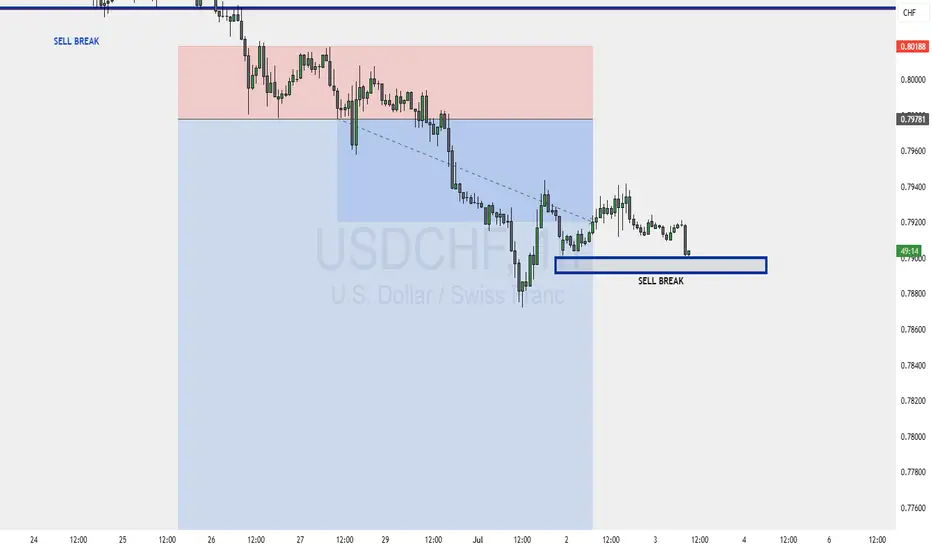
USDCHF – Two Levels, One PlanWe’re watching two key resistance zones for a potential short.
If the first level holds and gives a signal, we’ll short from there.
If that level breaks, we may switch to a short-term buy up to the next level.
Once price reaches the second resistance, we’ll be ready for another sell opportunity.
No predictions — just following the flow.

USDCHFOne key factor in my trading style is adapting to market structure, primarily guided by the daily time frame. However, when I analyze lower time frames, I often spot potential shifts to the upside—that's the immediate trend I focus on. While I’m fully aware that overall momentum remains bearish, I understand that for the market to move downward, it first needs liquidity. That’s why I target zones where buyers get trapped.
The difference between me and most buyers is that I know exactly where to exit before the overall trend takes control. From now on, I’ve learned that I’m rarely wrong about the market’s direction—just wrong about my stop loss placement. It’s clear they hunt stop losses, so my strategy now is using minimal risk with wider stop losses.

posible scenario for usd chf we have jobless clame news coming out so we may not trade this but its a good looking setup

USDCHF – Key Resistance TestUSDCHF is currently ranging after a strong downtrend, now testing the 0.79886 resistance level. Price is bouncing between this resistance and support at 0.79178, showing signs of indecision.
Support at: 0.79178 🔽
Resistance at: 0.79886 🔼
🔎 Bias:
🔼 Bullish: Break and close above 0.79886 targets 0.80697 and possibly 0.81564.
🔽 Bearish: Rejection from 0.79886 and break below 0.79178 could resume the bearish trend.
📛 Disclaimer: This is not financial advice. Trade at your own risk.

Continuation of the Multi-Decade DowntrendWith the US tariff trade wars about to commence, I feel that many investors will once again flock to the venerable Swiss Franc as a safer asset.

USDCHFI am trying to incorporate some Wycoff's theory here and see if at the end of the day, catching all the steps is worth the time to wait!

USDCHF: Short Sell Trigger on 4HGood morning everyone,
yesterday evening my LuBot Ultimate indicator sends me an alert for a sell signal I entered.
The signal is in favor of the trend and the main period structure both on the current timeframe and on the higher timeframes.
The indicator provides exit levels which I will follow as I think they are already optimal for a short term trade.
The stop is located above the highs and leaves some space for any spikes, and the take profit is located in the low area where it would be appropriate to exit.
👍 If you want to see other similar posts, like/boost
🙋♂️ Remember to follow me so you don't miss my future analyses
⚠️ Disclaimer: This post is for informational purposes only and does not constitute financial advice. Always do your research before making investment decisions.
TAGS: FPMARKETS:USDCHF FX_IDC:USDCHF KRAKEN:USDCHF SAXO:USDCHF FOREXCOM:USDCHF OANDA:USDCHF FX:USDCHF

