USD/CHF 4H – Pullback Into Supply Zone for Potential Reversal
🧠 USD/CHF 4H – Pullback Into Supply Zone for Potential Reversal
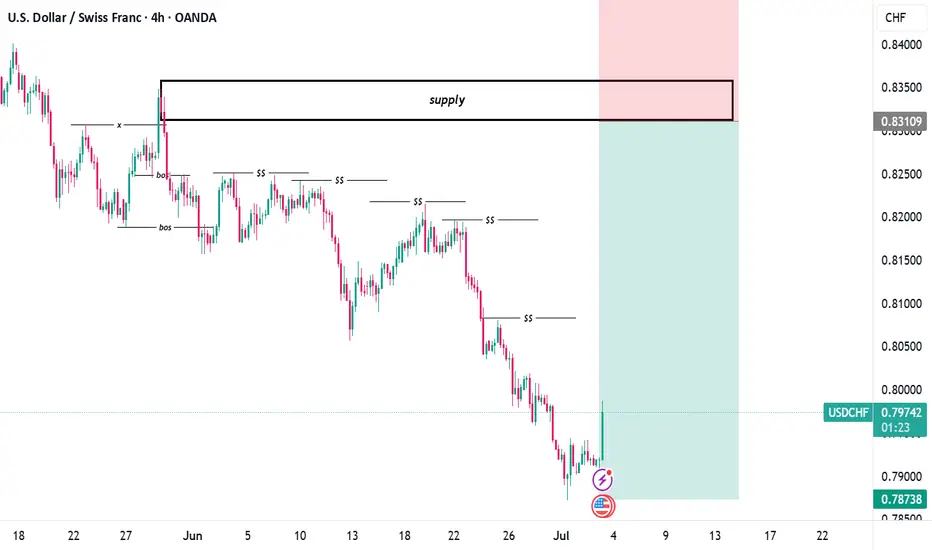
USD/CHF has been trading within a well-defined bearish structure over the past few weeks. Price action continues to respect lower highs and lower lows, with multiple short-term supports (SS) consistently being broken — confirming sustained selling pressure.
🔍 Market Structure & Smart Money Perspective
* A clear Break of Structure (BOS) early in the chart shifted market sentiment to bearish.
* Since then, the market has formed several short-term support levels, each broken successively.
* This confirms that bears are in control, and any rallies are likely corrective rather than a trend reversal — unless a new BOS to the upside forms.
🧱 Supply Zone Analysis
* The marked supply zone around 0.83100 – 0.84000 is the last institutional distribution zone before the significant drop.
* Price is currently retracing aggressively into this premium zone, following a likely liquidity sweep of the previous lows.
* This reaction is typical of smart money behavior — sweeping liquidity before initiating a retracement to mitigate orders or fill imbalances.
📈 Current Price Action
* The large bullish impulse may seem like a shift in momentum, but without a confirmed break of major structure, this is viewed as a pullback into premium pricing.
* We anticipate that price will react to the supply zone, presenting a high-probability shorting opportunity.
📌 Trade Idea
* Bias: Bearish (pending confirmation from supply)
* Entry Zone: 0.83100 – 0.84000
* Stop Loss: Above 0.84000 (to cover potential liquidity spikes)
* Take Profit: 0.78738 (prior demand zone)
* Risk-to-Reward: Approx. 1:4+
🧠 Confirmation Triggers to Watch For:
* Bearish engulfing candlesticks within supply
* Internal BOS on lower timeframe (LTF)
* Fair Value Gap (FVG) formation and reaction
* Weak bullish momentum/tap-and-reject from zone
📌Conclusion
This setup aligns with the Smart Money Concept framework. As long as price remains below the supply zone, my bias remains short. I’ll wait for lower timeframe confirmation before executing the trade.
⚠️ Always manage risk — this is a zone of interest, not an automatic sell. Let price show its hand.
CHFUSD trade ideas
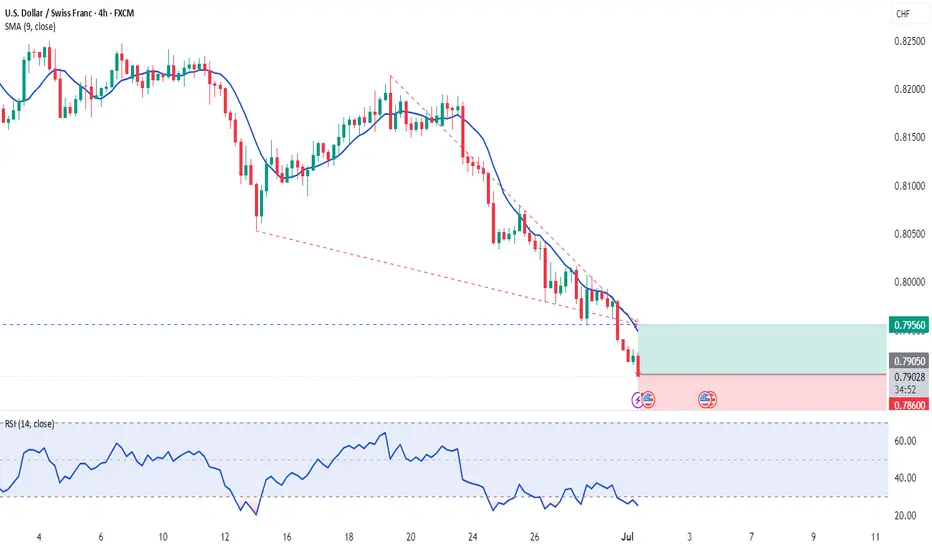
01.07.2025 #USDCHFBUY 0.79050 | STOP 0.78600 | TAKE 0.79560 | The impressive strength of the franc against the dollar. The pair is in a deep oversold condition. We expect a slight correction at these levels.
USD/CHF Slips LowerUSD/CHF Slips Lower
USD/CHF declined and now struggling below the 0.8000 resistance.
Important Takeaways for USD/CHF Analysis Today
- USD/CHF declined below the 0.8000 and 0.7950 support levels.
- There is a key bearish trend line forming with resistance near 0.7920 on the hourly chart at FXOpen.
USD/CHF Technical Analysis
On the hourly chart of USD/CHF at FXOpen, the pair started a fresh decline from well above the 0.8080 zone. The US Dollar dropped below the 0.8000 support to move into a negative zone against the Swiss Franc.
The bears pushed the pair below the 50-hour simple moving average and 0.7940. Finally, the bulls appeared near the 0.7870 level. A low was formed near 0.7872 and the pair is now consolidating losses.
There was a minor increase above the 23.6% Fib retracement level of the downward move from the 0.8080 swing high to the 0.7872 low. On the upside, the pair could face resistance near the 0.7920 level. There is also a key bearish trend line forming with resistance near 0.7920.
The next major resistance is near the 0.7940 level, above which the pair could test the 0.7975 level. It is close to the 50% Fib retracement level of the downward move from the 0.8080 swing high to the 0.7872 low.
If there is a clear break above the 0.7975 resistance zone, the pair could start another increase. In the stated case, it could even surpass 0.8030.
On the downside, immediate support on the USD/CHF chart is 0.7870. The first major support is near the 0.7850 level. The next major support is near 0.7800. Any more losses may possibly open the doors for a move toward the 0.7720 level in the coming days.
This article represents the opinion of the Companies operating under the FXOpen brand only. It is not to be construed as an offer, solicitation, or recommendation with respect to products and services provided by the Companies operating under the FXOpen brand, nor is it to be considered financial advice.

USD/CHF💰Symbol: { USD/CHF }
🟩Price: { 0.80217 }
🟥Stop: { 0.79601 }
1️⃣profit: { 0.80756 }
2️⃣profit: { 0.81214 }
3️⃣profit: { 0.81969 }
📊Check your chart before entering.
🚨Check before use to make sure there is no important news.🚨

USDCHF5YR: Previous low broken at 1.0148 setting up bearish trend
11: RTM broken at 0.804 expecting trend continuation at the current previous day low.
A bearish trend in the USDCHF pairI am taking my trade in the USD CHF pair as it showing bearish trend and I am using SIP chart to take my trade

FOREX USD/CHF🥇 CHF The Silent Assassin
While the world screamed about inflation, recession, and banana peels on the geopolitical stage, the Swiss Franc just stood there sipping Rivella and quietly murdered the competition.
+14.10% vs EUR?
+19.34% vs USD?
CHF walked into the forex party, didn’t say anything, and left with everyone’s respect.
🥈 USD – The Gym Bro on a Sugar Crash
Big muscles, loud talk, but oh no, look at those gains over time:
-4.41% vs EUR
-19.34% vs CHF
The USD resembles the guy who used to bench 250 and still talks about it while eating Doritos.
Rate hikes gave it a short-lived boost, but now it's just aired—trillions in debt and a lack of direction.
USDCHF oversold bounce backs capped at 0.8045The USD/CHF pair is currently trading with a bearish bias, aligned with the broader downward trend. Recent price action shows a retest of the falling resistance, suggesting a temporary relief rally within the downtrend.
Key resistance is located at 0.8045, a prior consolidation zone. This level will be critical in determining the next directional move.
A bearish rejection from 0.8045 could confirm the resumption of the downtrend, targeting the next support levels at 0.7900, followed by 0.7860 and 0.7810 over a longer timeframe.
Conversely, a decisive breakout and daily close above 0.8045 would invalidate the current bearish setup, shifting sentiment to bullish and potentially triggering a move towards 0.8080, then 0.8140.
Conclusion:
The short-term outlook remains bearish unless the pair breaks and holds above 0.8045. Traders should watch for price action signals around this key level to confirm direction. A rejection favours fresh downside continuation, while a breakout signals a potential trend reversal or deeper correction.
This communication is for informational purposes only and should not be viewed as any form of recommendation as to a particular course of action or as investment advice. It is not intended as an offer or solicitation for the purchase or sale of any financial instrument or as an official confirmation of any transaction. Opinions, estimates and assumptions expressed herein are made as of the date of this communication and are subject to change without notice. This communication has been prepared based upon information, including market prices, data and other information, believed to be reliable; however, Trade Nation does not warrant its completeness or accuracy. All market prices and market data contained in or attached to this communication are indicative and subject to change without notice.

USD/CHF – Bullish Reversal Setup with AB=CD Harmonics (1H TimefrWe’re closely watching USD/CHF, which has been in a bearish trend but is now showing strong signs of a bullish reversal.
A bullish divergence has formed, and the price has reached the Potential Reversal Zone (PRZ) as projected by the AB=CD harmonic pattern. This suggests that the trend may already be reversing.
Additionally, Myfxbook sentiment shows 93% of retail traders are long, reinforcing overall bullish bias. However, for confirmation, we’re waiting for a breakout above the last lower high (LH) to ensure a shift in structure before entering.
🔹 Pair: USD/CHF
🔹 Timeframe: 1H
🔹 Trend: Bearish (reversal expected)
🔹 Divergence: Bullish
🔹 Harmonic Pattern: AB=CD (PRZ hit)
🔹 Sentiment: 93% Long (Myfxbook)
🔹 Bias: Bullish
🔹 Entry (Buy Stop): 0.79463
🔹 Stop Loss: 0.78693
🔹 Take Profit 1: 0.80233
🔹 Lot Size: 0.20
🔹 Risk/Reward: 1:1
🔹 Risk: $200
🔹 Potential Reward: $200
🎯 Strategy: Entry will be triggered only after the breakout of the previous LH, confirming a shift to bullish structure and validating the harmonic reversal.
📌 #USDCHF #ABCDPattern #BullishDivergence #HarmonicTrading #TrendReversal #SmartMoneyMoves #BreakoutSetup #TechnicalAnalysis #PriceAction #ForexSignals #RiskManagement #1HChart #ForexTradeIdeas

USDCHF Will Go Lower! Sell!
Here is our detailed technical review for USDCHF.
Time Frame: 2h
Current Trend: Bearish
Sentiment: Overbought (based on 7-period RSI)
Forecast: Bearish
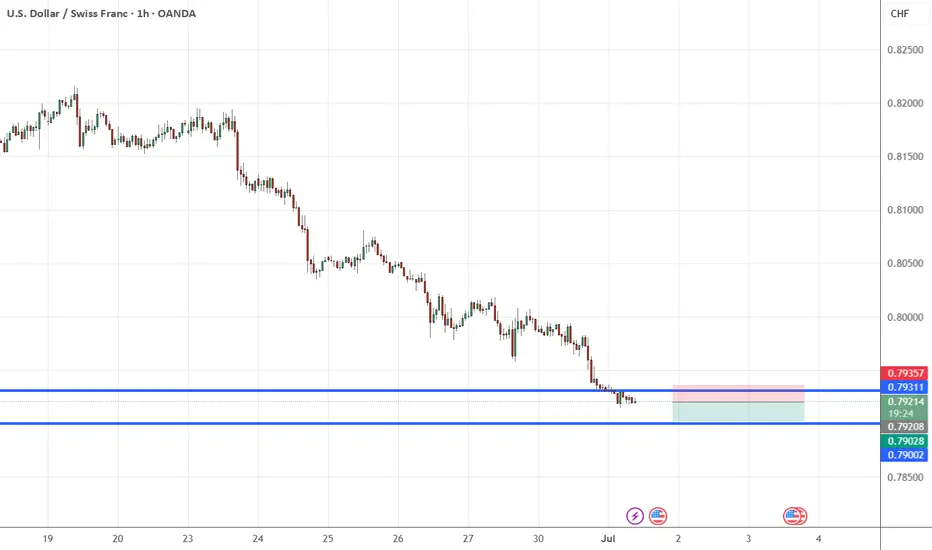
The market is approaching a significant resistance area 0.792.
Due to the fact that we see a positive bearish reaction from the underlined area, I strongly believe that sellers will manage to push the price all the way down to 0.785 level.
P.S
Overbought describes a period of time where there has been a significant and consistent upward move in price over a period of time without much pullback.
Disclosure: I am part of Trade Nation's Influencer program and receive a monthly fee for using their TradingView charts in my analysis.
Like and subscribe and comment my ideas if you enjoy them!

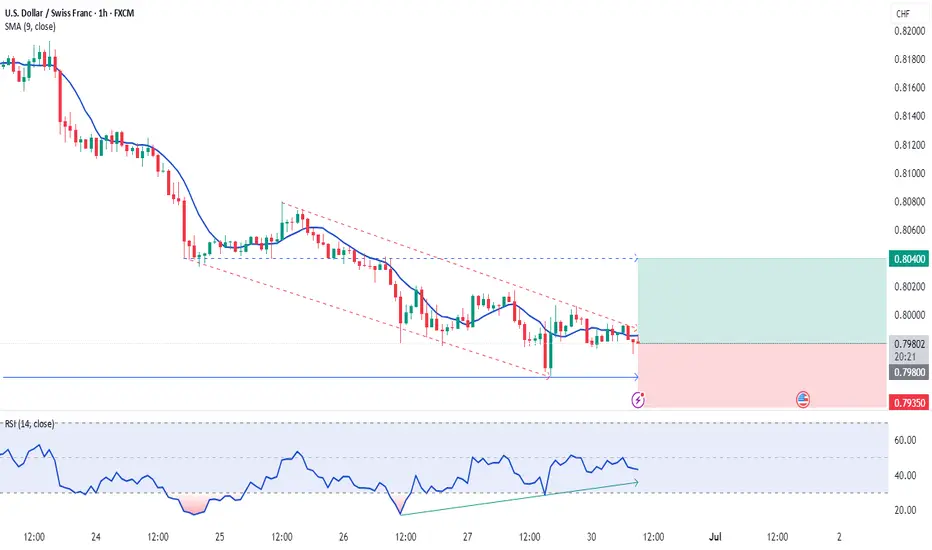
USD/CHF H4 | Downward trajectory to extend deeper?USD/CHF is rising towards a pullback resistance and could potentially reverse off this level to drop lower.
Sell entry is at 0.7962 which is a pullback resistance that aligns with the 23.6% Fibonacci retracement.
Stop loss is at 0.8030 which is a level that sits above the 38.2% Fibonacci retracement and a swing-high resistance.
Take profit is at 0.7852 which is a support that aligns with the 78.6% Fibonacci projection.
High Risk Investment Warning
Trading Forex/CFDs on margin carries a high level of risk and may not be suitable for all investors. Leverage can work against you.
Stratos Markets Limited (tradu.com ):
CFDs are complex instruments and come with a high risk of losing money rapidly due to leverage. 63% of retail investor accounts lose money when trading CFDs with this provider. You should consider whether you understand how CFDs work and whether you can afford to take the high risk of losing your money.
Stratos Europe Ltd (tradu.com ):
CFDs are complex instruments and come with a high risk of losing money rapidly due to leverage. 63% of retail investor accounts lose money when trading CFDs with this provider. You should consider whether you understand how CFDs work and whether you can afford to take the high risk of losing your money.
Stratos Global LLC (tradu.com ):
Losses can exceed deposits.
Please be advised that the information presented on TradingView is provided to Tradu (‘Company’, ‘we’) by a third-party provider (‘TFA Global Pte Ltd’). Please be reminded that you are solely responsible for the trading decisions on your account. There is a very high degree of risk involved in trading. Any information and/or content is intended entirely for research, educational and informational purposes only and does not constitute investment or consultation advice or investment strategy. The information is not tailored to the investment needs of any specific person and therefore does not involve a consideration of any of the investment objectives, financial situation or needs of any viewer that may receive it. Kindly also note that past performance is not a reliable indicator of future results. Actual results may differ materially from those anticipated in forward-looking or past performance statements. We assume no liability as to the accuracy or completeness of any of the information and/or content provided herein and the Company cannot be held responsible for any omission, mistake nor for any loss or damage including without limitation to any loss of profit which may arise from reliance on any information supplied by TFA Global Pte Ltd.
The speaker(s) is neither an employee, agent nor representative of Tradu and is therefore acting independently. The opinions given are their own, constitute general market commentary, and do not constitute the opinion or advice of Tradu or any form of personal or investment advice. Tradu neither endorses nor guarantees offerings of third-party speakers, nor is Tradu responsible for the content, veracity or opinions of third-party speakers, presenters or participants.

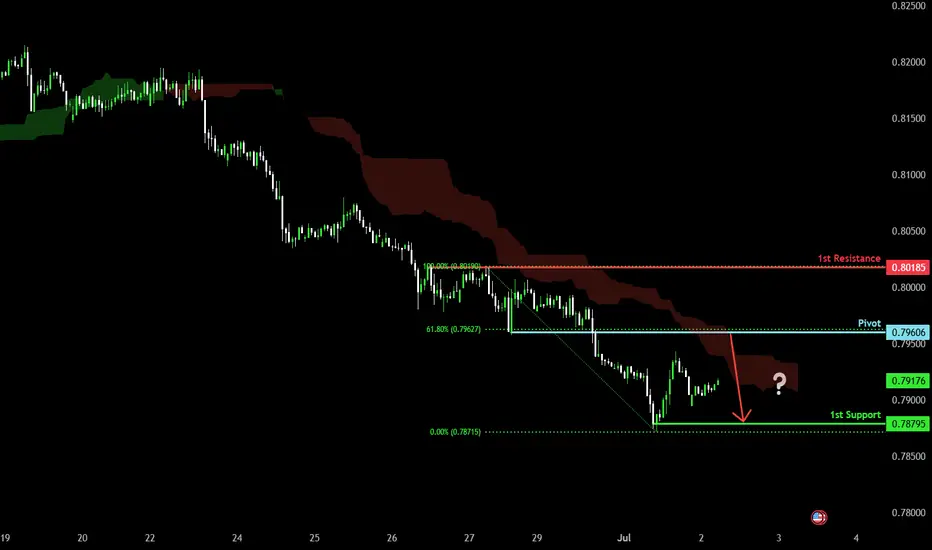
Bearish continuation?The Swissie (USD/CHF) is rising towards the pivot, which has been identified as a pullback resistance and could reverse to the 1st support.
Pivot: 0.7960
1st Support: 0.7879
1st Resistance: 0.8018
Risk Warning:
Trading Forex and CFDs carries a high level of risk to your capital and you should only trade with money you can afford to lose. Trading Forex and CFDs may not be suitable for all investors, so please ensure that you fully understand the risks involved and seek independent advice if necessary.
Disclaimer:
The above opinions given constitute general market commentary, and do not constitute the opinion or advice of IC Markets or any form of personal or investment advice.
Any opinions, news, research, analyses, prices, other information, or links to third-party sites contained on this website are provided on an "as-is" basis, are intended only to be informative, is not an advice nor a recommendation, nor research, or a record of our trading prices, or an offer of, or solicitation for a transaction in any financial instrument and thus should not be treated as such. The information provided does not involve any specific investment objectives, financial situation and needs of any specific person who may receive it. Please be aware, that past performance is not a reliable indicator of future performance and/or results. Past Performance or Forward-looking scenarios based upon the reasonable beliefs of the third-party provider are not a guarantee of future performance. Actual results may differ materially from those anticipated in forward-looking or past performance statements. IC Markets makes no representation or warranty and assumes no liability as to the accuracy or completeness of the information provided, nor any loss arising from any investment based on a recommendation, forecast or any information supplied by any third-party.
3 Daily Reversal SignalsIn this video we're taking a look at the OANDA:USDCHF , looking at the idea of this pair being overextended to the bearish side and looking to take advantage of potential bullish relief.
There are 3 main signals that we're looking for in this trading example.
1) The Relative Strength Index (RSI) being extremely oversold (currently around 12)
2) Price action trading completely outside the Keltner Channels
3) A low-test candlestick pattern signaling potential buying pressure.
As I mentioned in the video the actually strategy that this idea is based-on has some very specific parameters, but it is cool to see how and if it could be evolved to work in alternative ways.
If you have any questions, comments or want to share ideas, please do so below.
Akil

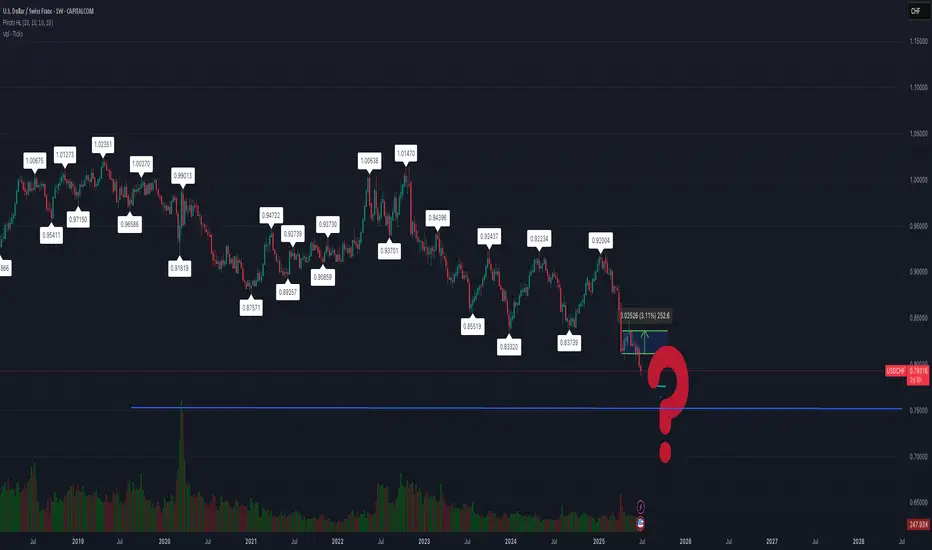
USD/CHF Weekly Swing Long – Targeting Long-Term Reversal I'm entering a long swing trade on USD/CHF off the weekly timeframe, aiming for a strong upside move over the coming months/years.
🔍 Entry Zone: 0.82xx (current region)
🎯 Target: 1.01585
🛑 Stop Loss: Below 0.80188
⚖️ Risk-Reward: Over 4:1
⏳ Time Horizon: Long-term swing (1–3 years)
Technical Justification:
Major Weekly Support: Price has bounced off a strong historical demand zone dating back to 2014–2015 levels.
Long Wicks + Rejection Candles: Bullish price action showing exhaustion of sellers.
Potential Double Bottom Structure: Early signs of trend reversal forming.
MACRO Opportunity: USD is historically resilient, and CHF may weaken on any shift away from risk aversion or SNB policy changes.

USD/CHF Exchange Rate Falls to Multi-Year LowUSD/CHF Exchange Rate Falls to Multi-Year Low
According to the chart, the USD/CHF exchange rate has settled below the key psychological level of 0.8000. The rate hasn’t been this low since the financial crisis of 2008.
On one hand, the drop in USD/CHF is driven by weakness in the US dollar. The US dollar index has fallen to its lowest level in over three years, largely due to the conflicting trade policies pursued by the Trump administration. On the other hand, geopolitical instability has increased the appeal of the Swiss franc as a so-called safe-haven asset.
Technical Analysis of the USD/CHF Chart
Since mid-May, price fluctuations have formed a downward channel (marked in red), and by the end of June the rate had stabilised around the psychological threshold of 0.8000 (indicated by an arrow) — right at the median of the channel.
However, this balance between supply and demand proved temporary, tipping in favour of sellers. As a result, we now see a decline in USD/CHF along a steep trajectory (marked in black), potentially targeting the lower boundary of the red channel — which suggests a possible move down to 0.7800 USD per franc. Along this path, support may come from the 1.618 Fibonacci extension level (0.7875); note how the 0.8055 level previously acted as support (marked with a blue arrow).
The RSI indicator confirms strong selling pressure — but will the bearish trend continue?
Much will depend on the broader fundamental context. As reported by the Wall Street Journal, the sharp strengthening of the franc against the dollar is causing growing concern at the Swiss National Bank (SNB), as an overly strong franc harms Swiss exporters. This suggests that the current market sentiment could shift dramatically if the SNB issues any relevant statements.
This article represents the opinion of the Companies operating under the FXOpen brand only. It is not to be construed as an offer, solicitation, or recommendation with respect to products and services provided by the Companies operating under the FXOpen brand, nor is it to be considered financial advice.

How to Trade USDCHF 's Downtrend with Precision📉 Market Breakdown: USDCHF Under Pressure
Currently keeping a close watch on USDCHF 💵🇨🇭 — the pair has been in a strong, sustained bearish trend 🔻, and the overall pressure remains clearly to the downside.
My bias is firmly bearish 📊, but I’m not rushing in. Instead, I’m patiently waiting for an optimal entry 🎯 — one that offers the right balance of confluence, structure, and reduced risk 🧠🛡️.
🎥 In today’s video, we dive into:
✅ Market structure
✅ Price action
✅ The prevailing trend
✅ Entry zones with minimized risk
I also walk you through my personal entry strategy and trading plan 📋, it's not just an idea drop.
📌 Disclaimer: This is not financial advice — the content is for educational purposes only.

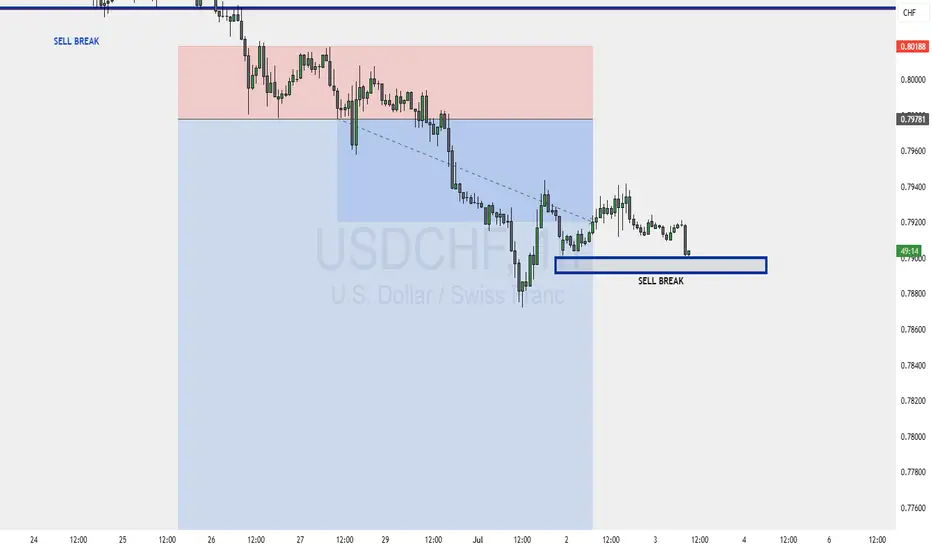
USDCHF - Support Becomes Resistance !Hello Traders !
After a huge bearish move, The USDCHF price broke the support level (0.80940 - 0.80348).
This key level becomes new resistance!
So, I expect a new bearish move📉
_______________
TARGET: 0.79225🎯

USDCHF Short H4 solid trend continuationSolid downtrend continuation
Stop behind Swing SR
75% probability
Might place target a bit closer
USDCHF H4 I Bullish Bounce Off Based on the H4 chart analysis, we can see that the price is currently at our buy entry at 0.7921 that aligns with the 127.2% Fib extension
Our take profit will be at 0.8054, a pullback support.
The stop loss will be placed at 0.7759, slightly below the 161.8% Fib extension.
High Risk Investment Warning
Trading Forex/CFDs on margin carries a high level of risk and may not be suitable for all investors. Leverage can work against you.
Stratos Markets Limited (tradu.com ):
CFDs are complex instruments and come with a high risk of losing money rapidly due to leverage. 63% of retail investor accounts lose money when trading CFDs with this provider. You should consider whether you understand how CFDs work and whether you can afford to take the high risk of losing your money.
Stratos Europe Ltd (tradu.com ):
CFDs are complex instruments and come with a high risk of losing money rapidly due to leverage. 63% of retail investor accounts lose money when trading CFDs with this provider. You should consider whether you understand how CFDs work and whether you can afford to take the high risk of losing your money.
Stratos Global LLC (tradu.com ):
Losses can exceed deposits.
Please be advised that the information presented on TradingView is provided to Tradu (‘Company’, ‘we’) by a third-party provider (‘TFA Global Pte Ltd’). Please be reminded that you are solely responsible for the trading decisions on your account. There is a very high degree of risk involved in trading. Any information and/or content is intended entirely for research, educational and informational purposes only and does not constitute investment or consultation advice or investment strategy. The information is not tailored to the investment needs of any specific person and therefore does not involve a consideration of any of the investment objectives, financial situation or needs of any viewer that may receive it. Kindly also note that past performance is not a reliable indicator of future results. Actual results may differ materially from those anticipated in forward-looking or past performance statements. We assume no liability as to the accuracy or completeness of any of the information and/or content provided herein and the Company cannot be held responsible for any omission, mistake nor for any loss or damage including without limitation to any loss of profit which may arise from reliance on any information supplied by TFA Global Pte Ltd.
The speaker(s) is neither an employee, agent nor representative of Tradu and is therefore acting independently. The opinions given are their own, constitute general market commentary, and do not constitute the opinion or advice of Tradu or any form of personal or investment advice. Tradu neither endorses nor guarantees offerings of third-party speakers, nor is Tradu responsible for the content, veracity or opinions of third-party speakers, presenters or participants.

USDCHF Wave Analysis – 30 June 2025
- USDCHF falling inside a minor impulse wave
- Likely to fall to support level 0.7900
USDCHF currency pair is falling strongly inside the minor impulse wave 3, which recently broke the daily down channel from the start of May.
The breakout of this down channel follows the earlier breakout of the key support level 0.8055 (which stopped the previous impulse waves (1) and i).
Given the strong daily downtrend and the continuous outflows from US dollar or risk-on mood, USDCHF currency pair can be expected to fall to the next support level 0.7900, the target price for the completion of the active impulse wave 3.

USD/CHF SETUPUSD/CHF SETUP unfolding as we anticipate to go long once our setup and rules are respected... smart money concepts

USDCHF long ideaUSDCHF Long Idea
Sentiments 95% Long
DXY about to be bullish making my bias
TP and SL marked
Managed your risk reward accordingly.
