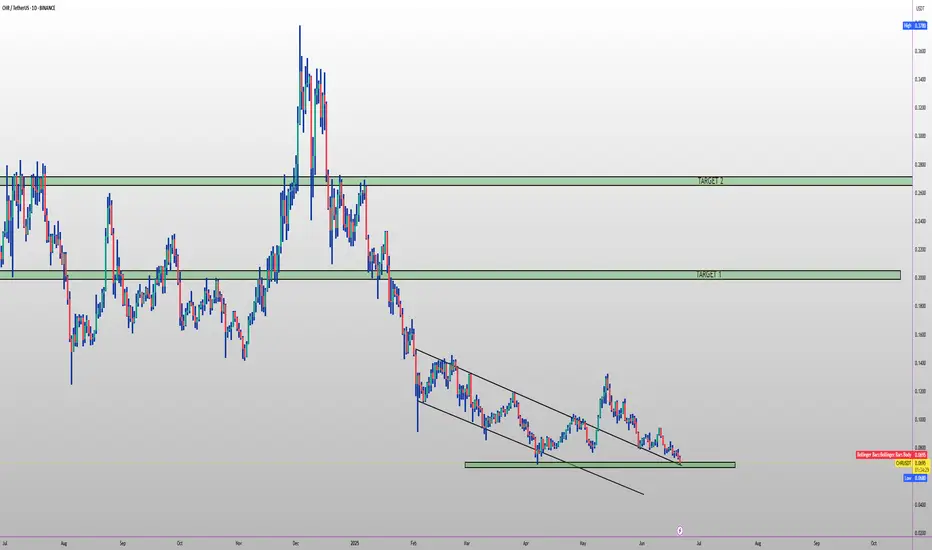
CHR TARGETS FOR 2025 🔥 NASDAQ:CHR long setup (1D) 🚀
✅ Entry Zone: $0.068 – $0.062 (12-month demand)
🎯 Targets
• TP-1: $0.17 (Q4-24 supply flip)
• TP-2: $0.24 (2024 breakdown block)
⛔ Stop-Loss
Daily close < $0.052
📊 Thesis
• Chromia mainnet modules live; full network launch slated before TOKEN2049
• Filehub mainnet gives on-chain storage for images/video — paid in CHR
• My Neighbor Alice just shipped the **first fully on-chain** browser MMO on Chromia
• Cross-chain staking hub lets you stake CHR on Chromia, ETH & BNB in one UI
• Staking APR redesigned (fixed 3 %) → sustainable yield & tighter float
• Roadmap: Dapp chains, ColorPool DEX, Chromia Originals NFTs, bridged CHR to more L1s
• 270 k+ community & Coinbase “interest” tag spark listing rumours
CHRUSDT trade ideas
CHR/USDTKey Level Zone: 0.0760 - 0.0765
LMT v2.0 detected.
The setup looks promising—price previously trended upward with rising volume and momentum, then retested this zone cleanly. This presents an excellent reward-to-risk opportunity if momentum continues to align.
Introducing LMT (Levels & Momentum Trading)
- Over the past 3 years, I’ve refined my approach to focus more sharply on the single most important element in any trade: the KEY LEVEL.
- While HMT (High Momentum Trading) served me well—combining trend, momentum, volume, and structure across multiple timeframes—I realized that consistently identifying and respecting these critical price zones is what truly separates good trades from great ones.
- That insight led to the evolution of HMT into LMT – Levels & Momentum Trading.
Why the Change? (From HMT to LMT)
Switching from High Momentum Trading (HMT) to Levels & Momentum Trading (LMT) improves precision, risk control, and confidence by:
- Clearer Entries & Stops: Defined key levels make it easier to plan entries, stop-losses, and position sizing—no more guesswork.
- Better Signal Quality: Momentum is now always checked against a support or resistance zone—if it aligns, it's a stronger setup.
- Improved Reward-to-Risk: All trades are anchored to key levels, making it easier to calculate and manage risk effectively.
- Stronger Confidence: With clear invalidation points beyond key levels, it's easier to trust the plan and stay disciplined—even in tough markets.
Whenever I share a signal, it’s because:
- A high‐probability key level has been identified on a higher timeframe.
- Lower‐timeframe momentum, market structure and volume suggest continuation or reversal is imminent.
- The reward‐to‐risk (based on that key level) meets my criteria for a disciplined entry.
***Please note that conducting a comprehensive analysis on a single timeframe chart can be quite challenging and sometimes confusing. I appreciate your understanding of the effort involved.
Important Note: The Role of Key Levels
- Holding a key level zone: If price respects the key level zone, momentum often carries the trend in the expected direction. That’s when we look to enter, with stop-loss placed just beyond the zone with some buffer.
- Breaking a key level zone: A definitive break signals a potential stop‐out for trend traders. For reversal traders, it’s a cue to consider switching direction—price often retests broken zones as new support or resistance.
My Trading Rules (Unchanged)
Risk Management
- Maximum risk per trade: 2.5%
- Leverage: 5x
Exit Strategy / Profit Taking
- Sell at least 70% on the 3rd wave up (LTF Wave 5).
- Typically sell 50% during a high‐volume spike.
- Move stop‐loss to breakeven once the trade achieves a 1.5:1 R:R.
- Exit at breakeven if momentum fades or divergence appears.
The market is highly dynamic and constantly changing. LMT signals and target profit (TP) levels are based on the current price and movement, but market conditions can shift instantly, so it is crucial to remain adaptable and follow the market's movement.
If you find this signal/analysis meaningful, kindly like and share it.
Thank you for your support~
Sharing this with love!
From HMT to LMT: A Brief Version History
HM Signal :
Date: 17/08/2023
- Early concept identifying high momentum pullbacks within strong uptrends
- Triggered after a prior wave up with rising volume and momentum
- Focused on healthy retracements into support for optimal reward-to-risk setups
HMT v1.0:
Date: 18/10/2024
- Initial release of the High Momentum Trading framework
- Combined multi-timeframe trend, volume, and momentum analysis.
- Focused on identifying strong trending moves high momentum
HMT v2.0:
Date: 17/12/2024
- Major update to the Momentum indicator
- Reduced false signals from inaccurate momentum detection
- New screener with improved accuracy and fewer signals
HMT v3.0:
Date: 23/12/2024
- Added liquidity factor to enhance trend continuation
- Improved potential for momentum-based plays
- Increased winning probability by reducing entries during peaks
HMT v3.1:
Date: 31/12/2024
- Enhanced entry confirmation for improved reward-to-risk ratios
HMT v4.0:
Date: 05/01/2025
- Incorporated buying and selling pressure in lower timeframes to enhance the probability of trending moves while optimizing entry timing and scaling
HMT v4.1:
Date: 06/01/2025
- Enhanced take-profit (TP) target by incorporating market structure analysis
HMT v5 :
Date: 23/01/2025
- Refined wave analysis for trending conditions
- Incorporated lower timeframe (LTF) momentum to strengthen trend reliability
- Re-aligned and re-balanced entry conditions for improved accuracy
HMT v6 :
Date : 15/02/2025
- Integrated strong accumulation activity into in-depth wave analysis
HMT v7 :
Date : 20/03/2025
- Refined wave analysis along with accumulation and market sentiment
HMT v8 :
Date : 16/04/2025
- Fully restructured strategy logic
HMT v8.1 :
Date : 18/04/2025
- Refined Take Profit (TP) logic to be more conservative for improved win consistency
LMT v1.0 :
Date : 06/06/2025
- Rebranded to emphasize key levels + momentum as the core framework
LMT v2.0
Date: 11/06/2025

#CHR READY TO NEW EXPLODE !#CHR
The price is moving within a descending channel on the 1-hour frame and is expected to break and continue upward.
We have a trend to stabilize above the 100 moving average once again.
We have a downtrend on the RSI indicator that supports the upward break.
We have a support area at the lower boundary of the channel at 0.0474, acting as strong support from which the price can rebound.
Entry price: 0.0756
First target: 0.0768
Second target: 0.0785
Third target: 0.0810
To manage risk, don't forget stop loss and capital management.
When you reach the first target, save some profits and then change the stop order to an entry order.
For inquiries, please comment.
Thank you.

CHRUSDT UPDATE
Pattern : Falling Wedge Breakout
Current Price: \$0.0802
Target Price: \$0.1150
Target % Gain: 45.45%
Technical Analysis: CHR has broken out of a falling wedge on the 8H timeframe, with a confirmed close above the trendline. Volume shows a minor spike supporting the breakout. Potential upside of 45% from the breakout point.
Time Frame: 8H

CHRUSDT 1W AnalysisCHR ~ 1W Analysis
#CHR Buy back gradually from here if you still have confidence in this coin with a short term target of at least 20%+ from here.

CHRUSDT 1D AnalysisCHR ~ 1D Analysis
#CHR Buy gradually from here if you still have confidence in this coin with a short term target of at least 15%+ from here.

BUY CHRUSDT, SWING BUY 2025BUY CHRUSDT, SWING BUY 2025
Entry: Around the current price, the lower the better
Close Buy: Around 0.3
Swing Buy: 2025

I'm Bullish, but... CHR / USDTEvening fellas,
My latest posts are bullish, and I did long some coins during the blood we had a couple of days ago.
But one must always be ready and I am seeing something interesting in a couple of coins, showing me that there's a hidden bearish scenario behind all the hype.
CHR is one of those coins, it's got good news, hype, etc, but I think MM'rs want to destroy some lives.
Keep an eye on it.
Trade thirsty, my friends!

#CHR Ready For Another Leg Down? Key Levels to Watch Yello, Paradisers! #CHR is showing upside probability, but this is just a setup before the next brutal leg down? Here’s why the current move by #Chromia could be the calm before the storm:
💎#CHRUSDT is trading around $0.0819, and on the 4H chart, the price is developing within a potential Leading Diagonal Formation. But here's the catch: for the diagonal to be valid, Wave 5 must exceed Wave 3, which hasn’t happened yet. So, the structure remains incomplete and vulnerable.
💎As of now, the 5th wave is still in play, but momentum is fading fast. A Bearish Divergence on the MACD histogram is flashing early warnings. If it intensifies, it could drag #CHRUSD down before Wave 5 completes, leading to a premature breakdown and invalidation of the pattern.
💎The resistance zone between $0.089-$0.97 remains key. A break and sustained hold above this level would invalidate the bearish scenario, potentially triggering a short squeeze up toward $0.1000+. But unless that happens, bears are still in control of the structure.
💎On the downside, a confirmed breakdown below the $0.0740 support will signal the failure of the diagonal and likely accelerate the drop toward the next major support at $0.0610, where we anticipate the next Swing Low. A valid bearish breakout below needs to be backed by increasing selling pressure and market weakness.
Play it safe, respect the structure, and let the market come to you!
MyCryptoParadise
iFeel the success🌴

CHRUSDT 1DCHR ~ 1D Analysis
#CHR Buy after successfully penetrating this resistant line with a short -term target of at least 10%+ from here.

#CHR/USDT#CHR
The price is moving within a descending channel on the 1-hour frame and is expected to continue upward.
We have a trend to stabilize above the 100 moving average once again.
We have a downtrend on the RSI indicator that supports the upward move with a breakout.
We have a support area at the lower boundary of the channel at 0.0956.
Entry price: 0.1000
First target: 0.1036
Second target: 0.1067
Third target: 0.1100


CHRUSDT 1WCHR ~ 1W Analysis
#CHR If you still have a Conviction on this coin,. Maybe you can consider this support to start buying back from here.

CHROMIA READY TO EXPLODE !!!CHROMIA getting ready to take of 🚀
Don't under estimate this beast will melt the faces soon

#CHR (SPOT-INVEST) IN ( 0.1300- 0.1500) T.(0.7900) SL(0.1248)BINANCE:CHRUSDT
#CHR/ USDT
Entry( 0.1300- 0.1500)
SL 3D close below 0.1248
T1 0.3000
T2 0.4300
T3 0.5600
T4 0.7900
1 Extra Targets(optional) in chart, if you like to continue in the trade with making stoploss very high.
______________________________________________________________
Golden Advices.
********************
* collect the coin slowly in the entry range.
* Please calculate your losses before the entry.
* Do not enter any trade you find it not suitable for you.
* No FOMO - No Rush , it is a long journey.
Useful Tags.
****************
My total posts
www.tradingview.com
**********************************************************************************************
#Manta #OMNI #DYM #AI #IO #XAI #ACE #NFP #RAD #WLD #ORDI #BLUR #SUI #VOXEL #AEVO #VITE #APE #RDNT #FLUX #NMR #VANRY #TRB #HBAR #DGB #XEC #ERN #ALT #IO #ACA #HIVE #ASTR #ARDR #PIXEL #LTO #AERGO #SCRT #ATA #HOOK #FLOW #KSM #HFT #MINA #DATA #SC #JOE #RDNT #IQ #CFX #BICO #CTSI #KMD #FXS #DEGO #FORTH #AST #PORTAL #CYBER #RIF #ENJ #ZIL #APT #GALA #STEEM #ONE #LINK #NTRN #COTI #RENDER #ICX #IMX #ALICE #PYR #PORTAL #GRT #GMT #IDEX #NEAR #ICP #ETH #QTUM #VET #QNT #API3 #BURGER #MOVR #SKL #BAND #ETHFI #SAND #IOTX #T #GTC #PDA #GMX #REZ #DUSK #BNX #SPELL #POWR #JOE #TIA #TFUEL #HOT #AVAX #WAXP #OGN #AXS #GALA #ONE #SYS #SCRT #DGB #LIT #QI #FIL #GLMR #ATOM #LTC #MANA #ONT #TLM #SLP #ROSE #NEO #EGLD #CHR

#CHR (SPOT) IN ( 0.1800- 0.2100)T.(0.7900) SL(0.1732)BINANCE:CHRUSDT
#CHR/ USDT
Entry( 0.1800- 0.2100)
SL 1D close below 0.1732
T1 0.3000
T2 0.4300
T3 0.5600
T4 0.7900
1 Extra Targets(optional) in chart, if you like to continue in the trade with making stoploss very high.
______________________________________________________________
Golden Advices.
********************
* collect the coin slowly in the entry range.
* Please calculate your losses before the entry.
* Do not enter any trade you find it not suitable for you.
* No FOMO - No Rush , it is a long journey.
Useful Tags.
****************
My total posts
www.tradingview.com
**********************************************************************************************
#Manta #OMNI #DYM #AI #IO #XAI #ACE #NFP #RAD #WLD #ORDI #BLUR #SUI #VOXEL #AEVO #VITE #APE #RDNT #FLUX #NMR #VANRY #TRB #HBAR #DGB #XEC #ERN #ALT #IO #ACA #HIVE #ASTR #ARDR #PIXEL #LTO #AERGO #SCRT #ATA #HOOK #FLOW #KSM #HFT #MINA #DATA #SC #JOE #RDNT #IQ #CFX #BICO #CTSI #KMD #FXS #DEGO #FORTH #AST #PORTAL #CYBER #RIF #ENJ #ZIL #APT #GALA #STEEM #ONE #LINK #NTRN #COTI #RENDER #ICX #IMX #ALICE #PYR #PORTAL #GRT #GMT #IDEX #NEAR #ICP #ETH #QTUM #VET #QNT #API3 #BURGER #MOVR #SKL #BAND #ETHFI #SAND #IOTX #T #GTC #PDA #GMX #REZ #DUSK #BNX #SPELL #POWR #JOE #TIA #TFUEL #HOT #AVAX #WAXP #OGN #AXS #GALA #ONE #SYS #SCRT #DGB #LIT #QI #FIL #GLMR #ATOM #LTC #MANA #ONT #TLM #SLP #ROSE #NEO #EGLD #CHR

$CHR to 10$CHR
85% supply is in circulation
right moving into wave 2
i'll buy if price enters
into Greenzone(0.086-0.1052)
&
#HODL till 10$
Realistic target
#100X
#NFA #DYOR
Hit like RT & Follow
Comment below your opinion
#Bitcoin #Bullrun2025

CHRUSDT 1WCHR ~ 1W
#CHR If you still have Conviction on this coin,. Buy in stages from here with a minimum target of 20%++

#CHR/USDT Ready to go higher#CHR
The price is moving in a descending channel on the 1-hour frame and sticking to it well
We have a bounce from the lower limit of the descending channel, this support is at 0.2390
We have a downtrend on the RSI indicator that is about to be broken, which supports the rise
We have a trend to stabilize above the moving average 100
Entry price 0.2410
First target 0.2510
Second target 0.2628
Third target 0.2748

Is CHR gearing up for an ATH update?We see a triangle with an attempt to break it and further exit behind the ATH update! Given that one of the investors is a subsidiary of XRP, this project could be part of the future of XRP as it is itself implied as a modular blockchain. We're also entrenched above 50 EMA, a 1B+ capitalization and a $1.2 price is just around the corner.
Horban Brothers.

CHRUSDT 1WCHR Update ~ 1W
#CHR Again rejected from this resistance line. If you still have Conviction on this coin,. This support block would be a very good buying place for now,. with a minimum target of 20%++, it is only a matter of time until this resistance line is successfully penetrated.

Will #CHR Bulls Step Up or Are We Facing a Breakdown?Yello, Paradisers! Can the #CHRUSDT bulls gather enough momentum to break out of the descending channel? Let's look at the latest analysis of the #Chromia:
💎After a steady 5-6 month downtrend, #CHR is nearing a crucial decision point as it approaches a major demand zone at $0.1523. This level has historically triggered a bounce, but the question is—can the bulls seize this moment to spark a reversal and finally break out of the descending channel?
💎For #CHRUSDT to set the stage for a breakout, the bulls need to reclaim internal resistance at $0.242—a key level that once served as strong support but has now turned into a significant obstacle. A breakout here, particularly with rising trading volume and support from the 20 EMA, could signal a shift in momentum, paving the way for a rally to the next major resistance.
💎However, if the bulls fail to maintain upward pressure, we could see a pullback to that critical demand zone at $0.1523, potentially retesting the recent breakout point. Failure to hold this level may lead to a slide toward the $0.124-$0.134 range.
💎The real danger, however, lies at $0.124. If this support level does not hold, bears are likely to take back control, potentially initiating a deeper correction and deflating any hopes for a short-term bullish recovery.
Stay focused, patient, and disciplined, Paradisers🥂
MyCryptoParadise
iFeel the success🌴

#CHR/USDT#CHR
The price is moving within a 12 hour descending channel pattern, which is a strong retracement pattern
We have a bounce from a major support area in the color EUR at 0.2000
We have a tendency to stabilize above the Moving Average 100
We have a downtrend on the RSI indicator that supports the rise and gives greater momentum and the price is based on it
Entry price is 0.2365
The first target is 0.2690
The second target is 0.3180
The third goal is 0.3744
