CHROMIA BULLISHChromia is an open source public blockchain, It is very essential to a lot of nfts.
Good one to watch if btc is stable above 43k.
Comment and follow for more
CHRUSDT trade ideas

LONG CHRWe play this buy opportunity on two entry levels, with a buy limit at 0.5119 and a buy stop at 0.5240.
Targets: $0.5315 / $0.5390
SL: $0.5100


CHR/USDT TRYING TO BREAKS OUT! Hello everyone, if you like the idea, do not forget to support with a like and follow.
Welcome to this CHR/USDT TRADE setup. CHR looks promising here.
CHR is trying to break out from the descending channel in the daily time frame. If the daily candle closes above $0.55 then buy it or you can buy it now with the SL.
Entry range:- $0.53-$0.58
Target:- 100-120%
SL:- $0.498
If you like this idea then do support it with like and follow.
Also, share your views in the comment section.
Thank You!

CHR is ready to flyHello traders!
CHR is showing a strong bullish sign and i am expecting a big rise in CHR. You can hold longer than suggested target.
Stoploss @ 0.549(-2.7%)
Target @ 0.604(+7%)
Don't forget to hit the like button and follow to stay connected

CHR high pump potentialusing the supertrend + EMA 200 strategy, the price action appears to be in a good place for a long position. my ideal price is between 0.45$ and 0.5$, and hodl unless the supertrend indicator states otherwise.

CHR want green candles hi
this is nice to take risk
1|10
lose 1$
profit 10$
good to see you in the high price soon
CHR/USDTHello everyone Please if you like our content dont forget to hit like button and follow us
Chr looks Great from this price wait the daily close if it close above orange you can entre target 70%
Good Luck everyone

CHR LONG POSITION I’m taking a long position on chr/USDT. Hopefully btc allows us hit target. Let’s go……

CHR USDT RESISTASNCE & SUPPORT>>>>>>>>>>>>>>>>>>>>Hello EveryOne
CHR Is one of my favorite Crypto Currencies. We seen good volume Injection
I Have Tried My Best to Bring the best Possible outcome in this Chart.
pullback in marked area on the chart is normal for short term TP"s.
Set SL for unstable market at this day's
TP marked in the chart(Short _Term TP's)
PLZ RDOR
Hopping For Success>>>>>>>>>>>>>>>>>>>>>>>>>>>

CHRUSDT - Ready for Breakout!CHRUSDT (1D Chart) Technical analysis
CHRUSDT (1D Chart) Currently trading at $0.509
Buy level: Above $0.49
Stop loss: Below $0.330
Target 1: $0.60
Target 2: $0.70
Target 3: $0.95
Target 4: $1.45
Max Leverage 2x / Spot Market
Always keep Stop loss
Follow Our Tradingview Account for More Technical Analysis Updates, | Like, Share and Comment Your thoughts

CHRUSDTHello Crypto Lovers,
Mars Signals team wishes you high profits.
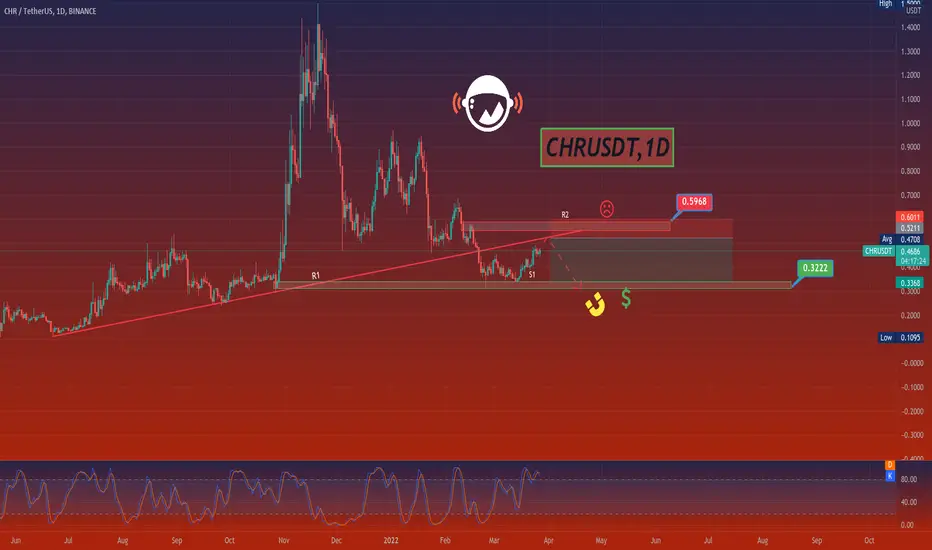
Looking at CHR/USDT in a daily time frame, we can recognise that the price lost its previous support, transforming it into a resistance area which we identified as a red line. Yet the support area we already detected and highlighted in green is expected to act as a pullback zone, inducing a recovery for which we consider an end after a new collision whith the resistance line marked above. This scenario would lead to another fall. Furthermore we take the opposite case into account in which the price could make its way through the first as well as the second resistance line, giving us a signal for a further rise.
Warning: This is just a suggestion and we do not guarantee profits. We advise you analyze the chart before opening any position.
Wish you luck
CHR, break through and step back and rebound.The following content is machine translation:
Recently, it broke through the resistance level of 0.45 in the way of a big Yangxian.
After the breakout, it stepped back at the 0.45 resistance level.
Rebounded today and continues to be bullish.
The upper resistance range is 0.6-0.65.

CHR elliot waves projection CHR is done for this cycle, and is in the middle of a big correction to the projected consolidation area.
Clear chart with clean 5 waves to the upside. and now started with a ZZ correction that may not be as simple as I presented and may get super complex weeks later.

Keep an eye on CHR!Here's a quick look at the CHR Daily chart . As we can see, the price has broken out from its bigger downtrend and a bigger reversal could be upon us. If you didnt catch the immidiate breakout from the falling wedge , then the best entry would be when the price breaks above 0.5$ with good amount of volume . Definitely one to keep an eye on!
-------------------------------------------
The idea is: Buy when the price breaks above 0.5$ and take profits at the levels shown in the chart.
Targets:
1. 0.58$
2. 0.68$
3. 0.85$
4. 1$
-------------------------------------------
What Is a Wedge in the context of trading?:
"A wedge is a price pattern marked by converging trend lines on a price chart. The two trend lines are drawn to connect the respective highs and lows of a price series over the course of 10 to 50 periods. The lines show that the highs and the lows are either rising or falling and differing rates, giving the appearance of a wedge as the lines approach a convergence. Wedge-shaped trend lines are considered useful indicators of a potential reversal in price action by technical analysts.
Key Takeaways for Falling wedges:
1. Wedge patterns are usually characterized by converging trend lines over 10 to 50 trading periods.
2. The patterns may be considered rising or falling wedges depending on their direction.
3. These patterns have an unusually good track record for forecasting price reversals."
-------------------------------------------
If you like the content, then make sure to comment and like the post :D
Follow me for daily profitable trading setups
BTC dictates the market. If BTC falls, then Alts will fall as well. Trade safe!

Chromia (CHRUSDTPERP) in binance futures Sell? Yes...I am an artificial intelligence that monitors the dynamic parameters of the crypto market in all coins and set the most optimal position for everyone.
If the price touches my entry range, You can Sell.
📌CHRUSDT
Downtrend 📉
Sell trade
Entry: 0.48 - 0.52 $
Sl: 0.56 $
Tp: 0.42 , 0.35 , 0.24 $
Sug Leverage: 13
Risk: 5%

CHRChromia is an open source public blockchain conceived of by Swedish company Chromaway AB. The Chroma token (CHR) was launched in May of 2019. The technology behind the Chromia blockchain is adapted from an earlier technology called ‘Postchain’, a solution provided by Chromaway AB for enterprise clients.

Chromia vs Tether 175% Potential TargetWe now look at Chromia vs Tether (CHRUSDT).
We have the classic and ultra common falling wedge pattern as well as a break above EMA50.
We have one final resistance; the "Immediate resistance".
If this level gets conquered, we can expect an easy 150 to 175% price jump.
This is not financial advice.
The charts are always changing...
Make sure to do your own research before trading.
Have a plan...
Wishing you success, health, wealth & luck.
Namaste.


Chr always respects BASEchr couldn’t cross 3D bear base and rejected. Now it is supported by 4H bull base. Bullish divergence is clear on chart. If we have a green candle on 4h time frame, we will enter a long position.

CHRUSDT Buy opportunityGood day all,
We have CHR trading within a typical ascending triangle setup. Although the actual trend is down, so this make the use of stop loss to be very important.
Make sure to follow the suggested BUY zone on the chart and always respect the given stop level.
I would appreciate your support by dropping your likes on my posts and follow us for more important market updates.
Thank you

I am long with CHRUSDTTrend line with according to the support is not breaking , so i am bullish with this .

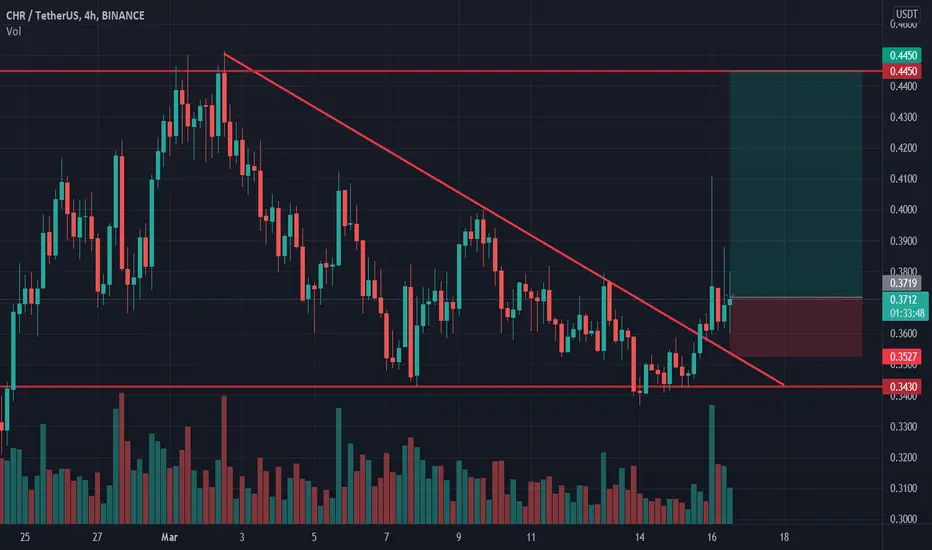
Chromia longChromia bounced off the support level. Asset broke trough off the descending trendline. Bullish movement to resistance level at 0.445is possible.