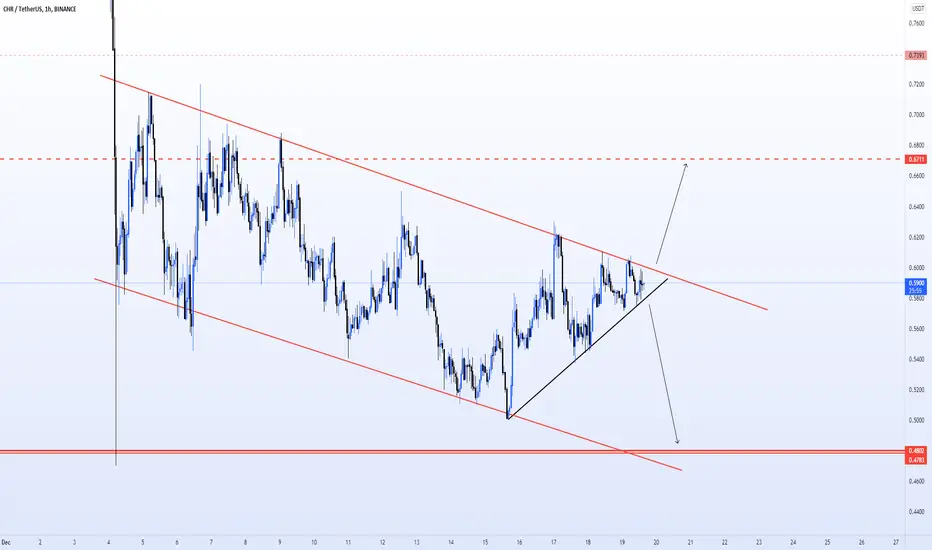
CHR buy from trend lineWhen the price is near the normal trend line, you can start to consider buying, but now it is too earlyby PIP-Pocket119
Binance: CHR Buy / long 1DBinance: CHR Buy / long 1D Entry: 0.5-0.6 SL: 1D close below 0.48 TP1: 0.9-1 TP2: 1.4-1.5 Chromia is a blockchain platform that aims to solve the scalability problem for decentralized applications (dApps). The platform consists of a network of nodes forming a blockchain, each node using its own relational database. The Chroma token (CHR) is used as block rewards and to pay for transaction fees. It raised 11.70MM USD in private and public token sales conducted from August 2018 to May 2019.Longby Tran_Tri_Tai4
CHRUSDT PRICE CHART SATVEER DULARCHRUSDT PRICE CHART SHORT/SELL CHR ON RED ZONE BUY/LONG confirm green/bulish candle on support area than buy/long CHRBTC CHART CHRBNB CHARTShortby satveerdulargurukul112
CHR Long on 4H frame A clear falling wedge on 4H frame. I just bought it at 0.583 and my first target is 0.763 (⁓ 31%). What do you think? Longby ali_amnyan113
Chr scalping!!!Chr has broken its down trend channel and now has located on two support lines and we expect in good condition of market we have a good rising of chr.Longby UnknownUnicorn26571273112
CHRUSDT BULLISH1) regular bullish divergence is formed 2) it's in a demand zone and the trendline is also breakout. 3) RSI is below 50 4) MACD cross the signal line ** (ALL OF THESE ARE EDUCATIONAL PURPOSES ONLY)Longby USHAN_20016
CHR #CHR CHR is underestimated. I wrote earlier to buy it at $ 0.3 with the goal of $ 2, we did not reach it…. Chr is its own blockchain, there is a game, top-end game projects come out on this blockchain. And the project itself costs $ 300 billion ... Is this a joke? The goal is $ 2…. And yet, on November 20, Binance added a pair of ETHCHR ... Longby MaxsimusTrade7
CHRUSDT - Short signal by Dow & Keltner Channels 11 Dec, 2021Keltner Channels infos: 1. ENTRY 1 SETTING: 2. ENTRY 2 SETTING: 3. ENTRY 3 SETTING: Shortby dinhchien112
CHRUSDTCHRUSDT The shaded area, the shift, is a sensitive area, from which it can bounce right now, but as a specific entry on the chart, there are two areas, and God knowsby alqusari_yahya553
chr follow my idea !!!!we can update bearish channel and 2 idea can exist. 1. break support and go to middle line and if not supported go to down the channel 2. for bullish wave chr have to break channel and resistance with good candle. wait for chart !!!!by mahdi_sh_4
CHR Next Big Moves????Kindly, LIKE COMMENT and FOLLOW me Reasons: simple clean chart 📉📈 Chr trading within a falling wedge, Solid monthly demand zone @0.4 any price actions within that zone will bounce off aggressively! A break is imminent soon , a 4hr candle close Above @0.75, signify more upsides, Chr looking good for me, @0.65 Tp Target @0.75 @0.96 @1.08 @1.4 Pls note: Not a financial advice Pls do your own research! Longby DCryptoLord2
CHR 4HCHR had a good run in November, broke through its 7-month resistance of 0.5389, and went on to an all-time high of 1.5 on November 20. But even before the bloodbath witnessed last week where CHR dropped nearly 93%, it was already down about 69% from its ATH between November 20 and December 2. It has since recovered some 38%. So firstly, we need to wait the recovery of BTC again, may drag again. Secondly, if CHR will break out of first so we will consider for the entry E1, E2. Good luck ! by xtrade-bot0
CHR UpdateHere's a quick Look at CHR 6 hr chart. As we can see, the price has printed a bigger falling wedge and we could see a break to the upside soon! Keep an eye on this falling wedge! The best entry would be, when the price breaks above 0.72$ with good amount of volume . ------------------------------------------- The idea is: Buy when the price breaks above 0.72$ and take profits at the levels shown in the chart. Targets: 1. 0.84$ 2. 1.03$ 3. 1.18$ 4. 1.38$ ------------------------------------------- What Is a Wedge in the context of trading?: "A wedge is a price pattern marked by converging trend lines on a price chart. The two trend lines are drawn to connect the respective highs and lows of a price series over the course of 10 to 50 periods. The lines show that the highs and the lows are either rising or falling and differing rates, giving the appearance of a wedge as the lines approach a convergence. Wedge shaped trend lines are considered useful indicators of a potential reversal in price action by technical analysts. Key Takeaways for Falling wedges: 1. Wedge patterns are usually characterized by converging trend lines over 10 to 50 trading periods. 2. The patterns may be considered rising or falling wedges depending on their direction. 3. These patterns have an unusually good track record for forecasting price reversals." ------------------------------------------- If you like the content, then make sure to comment and like the post :D Follow me for daily profitable trading setups BTC dictates the market. If BTC falls, then Alts will fall as well. Trade safe!Longby MBM_Crypto5511
$CHR- On Correction JourneySo during the week, I was noticing that most Alts were actually holding their support so strong and not bleeding much. These are Alts I was expecting that they w'd be in a worse state but surprisingly, they were holding so i began to look at all their(of course investors holding plays a huge role to this) patterns and i found out this similarities and differences with them like btt ,most Tron based tokens and once that haven't retested their ATH, Tel and Chr... For some that are yet to retest their ATH since March or April, they are still in corrective pattern (ABC or ABCDE) of Impulsive Wave 4 and have not conclude their wave 5 reason they are mostly holding support right on the top wave 1 peak. But Tokens like $CHR that have actually concluded theirs($CHR did ABC) and then rested ATH, concluded Wave 5,printed a new high has now began another big corrective wave journey (ABC) So the reason i 'm sharing this details is because of some of you have been in boxing me asking a lot of questions only a seer or prophet can answer. Therefore i am trying my best to provide a general view of what is likely playing out from what i saw in their patterns of price movement(factoring in btc, FA, market sentiments/FUD). You have to believe in the projects to be an investor. Don't buy just because someone told you to. Some tokens due to the nature of the holders have some kinda of momentum that they will go through this corrections more faster than the others and keep going up...Some take their time prolly because of leverage or inside kinda tradings which makes it look like it ain't moving or P&D as some of you think... The bottom line is that, they will have their moment. You just have to be patient to reap profitably as an investor which could take weeks ,months or even year(s). Or you can position yourself on how to trade them if you ain't holding for a long timeby Syl-Crypt223
Keep an eye on CHR - We could see a break to the upside soon!Here's a quick Look at CHR 6 hr chart. As we can see, the price has printed a bigger falling wedge and we could see a break to the upside soon! Keep an eye on this falling wedge! The best entry would be, when the price breaks above 0.72$ with good amount of volume . ------------------------------------------- The idea is: Buy when the price breaks above 0.72$ and take profits at the levels shown in the chart. Targets: 1. 0.84$ 2. 1.03$ 3. 1.18$ 4. 1.38$ ------------------------------------------- What Is a Wedge in the context of trading?: "A wedge is a price pattern marked by converging trend lines on a price chart. The two trend lines are drawn to connect the respective highs and lows of a price series over the course of 10 to 50 periods. The lines show that the highs and the lows are either rising or falling and differing rates, giving the appearance of a wedge as the lines approach a convergence. Wedge shaped trend lines are considered useful indicators of a potential reversal in price action by technical analysts. Key Takeaways for Falling wedges: 1. Wedge patterns are usually characterized by converging trend lines over 10 to 50 trading periods. 2. The patterns may be considered rising or falling wedges depending on their direction. 3. These patterns have an unusually good track record for forecasting price reversals." ------------------------------------------- If you like the content, then make sure to comment and like the post :D Follow me for daily profitable trading setups BTC dictates the market. If BTC falls, then Alts will fall as well. Trade safe!Longby MBM_Crypto10
CHRUSDT `` High Bullish pressureCareful anyways- A tangible demand level is far away. Price is seemingly running on a strand.Longby Smilq333
CHRCHR look's ready to wave 5 , it's targeting 2$ CHR look's ready to wave 5 , it's targeting 2$ Longby HELAL_ALTHAWADI4
Is this the retest CHR never made of its breakout?CHR has almost retested the previous breakout triangle which it had basically left untested since its breakout. CHR had failed to pass 1.5$ now at 0.65 currently it seems like a treat of a buy. big resistance at 1.20$ and 0.80$Longby Suneater694
#CHR_Hodl_Signal Strong signalCHR /Usdt looks ready for very big move As we see the similarity in behavior Once CHR breaks out the triangle pattern , it will move to targets Stop lose : 1.038 4h cnadle best wishes for youLongby mr_mokhtar_akUpdated 1112
bearish channel ...my idea for chr worked and now a bearish channel created and mid line is a good support and another support show in chart. by mahdi_sh_0
Keep an eye on CHR - We will see a bigger move soon!Here's a quick Look at CHR 4 hr chart. As we can see, the price has been forming a bigger falling wedge and we could see a break either way soon! BTC just needs to get stable. Keep an eye on this falling wedge! The best entry would be, when the price breaks above 1.12$ with good amount of volume . ------------------------------------------- The idea is: Buy when the price breaks above 1.12$ and take profits at the levels shown in the chart. Targets: 1. 1.18$ 2. 1.3$ 3. 1.5 ------------------------------------------- What Is a Wedge in the context of trading?: "A wedge is a price pattern marked by converging trend lines on a price chart. The two trend lines are drawn to connect the respective highs and lows of a price series over the course of 10 to 50 periods. The lines show that the highs and the lows are either rising or falling and differing rates, giving the appearance of a wedge as the lines approach a convergence. Wedge shaped trend lines are considered useful indicators of a potential reversal in price action by technical analysts. Key Takeaways for Falling wedges: 1. Wedge patterns are usually characterized by converging trend lines over 10 to 50 trading periods. 2. The patterns may be considered rising or falling wedges depending on their direction. 3. These patterns have an unusually good track record for forecasting price reversals." ------------------------------------------- If you like the content, then make sure to comment and like the post :D Follow me for daily profitable trading setups BTC dictates the market. If BTC falls, then Alts will fall as well. Trade safe!Longby MBM_Crypto5525