CHZ - spot entry rangeWeekly TF
Ideal buy range $0.01 - 0.03
Risk = -50%
Reward = + 4,000% (assumes ATH as TP level)
CHZUSD trade ideas

CHILIZ Stock Chart Fibonacci Analysis 051825Trading Idea
1) Find a FIBO slingshot
2) Check FIBO 61.80% level
3) Entry Point > 0.04/61.80%
Chart time frame: C
A) 15 min(1W-3M)
B) 1 hr(3M-6M)
C) 4 hr(6M-1year)
D) 1 day(1-3years)
Stock progress: A
A) Keep rising over 61.80% resistance
B) 61.80% resistance
C) 61.80% support
D) Hit the bottom
E) Hit the top
Stocks rise as they rise from support and fall from resistance. Our goal is to find a low support point and enter. It can be referred to as buying at the pullback point. The pullback point can be found with a Fibonacci extension of 61.80%. This is a step to find entry level. 1) Find a triangle (Fibonacci Speed Fan Line) that connects the high (resistance) and low (support) points of the stock in progress, where it is continuously expressed as a Slingshot, 2) and create a Fibonacci extension level for the first rising wave from the start point of slingshot pattern.
When the current price goes over 61.80% level , that can be a good entry point, especially if the SMA 100 and 200 curves are gathered together at 61.80%, it is a very good entry point.
As a great help, tradingview provides these Fibonacci speed fan lines and extension levels with ease. So if you use the Fibonacci fan line, the extension level, and the SMA 100/200 curve well, you can find an entry point for the stock market. At least you have to enter at this low point to avoid trading failure, and if you are skilled at entering this low point, with fibonacci6180 technique, your reading skill to chart will be greatly improved.
If you want to do day trading, please set the time frame to 5 minutes or 15 minutes, and you will see many of the low point of rising stocks.
If want to prefer long term range trading, you can set the time frame to 1 hr or 1 day.

CHZ: The Safe BetAlthough #Chiliz has been in a bearish trend since March 2021, many still bet on a strong comeback.
A complex double combo appears to be complete, with the current range holding and bullish divergence showing on several indicators.
Passing $0.14 confirms a shift in trend.

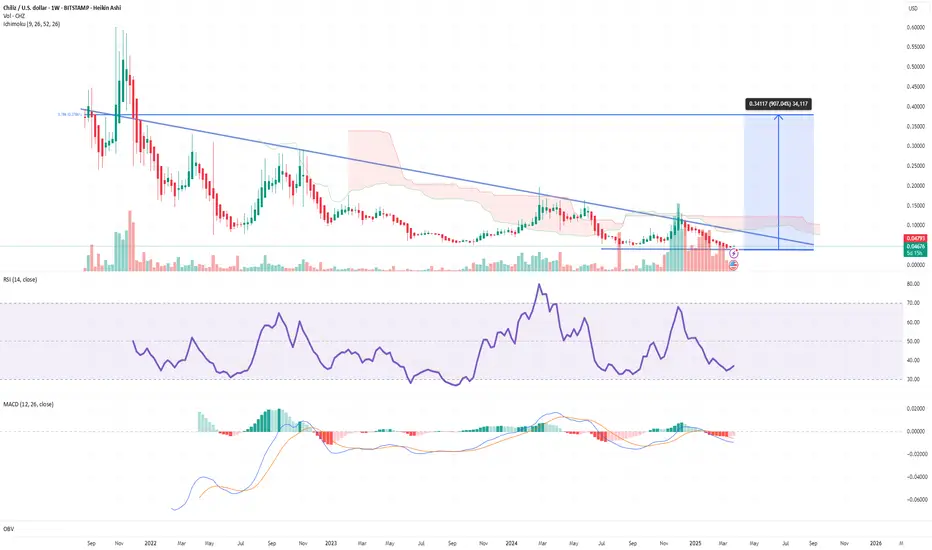
CHZ/USDT Weekly Technical Analysis1. Overall Trend
CHZ remains in a long-term downtrend, as shown by the descending trendline from its 2021 highs.
However, price is now consolidating near a long-term support zone around $0.045–$0.05, signaling a potential reversal zone.
Price is approaching a key confluence area: the downtrend line + bottom of the Ichimoku Cloud.
2. Ichimoku Cloud
Price is still below the cloud, indicating bearish momentum.
But the cloud is thin, and there’s a potential “Kumo Twist” ahead — a favorable condition for a trend reversal.
A successful breakout above the cloud would signal a strong bullish shift.
3. MACD (Moving Average Convergence Divergence)
MACD line is slightly below the signal line, but both are near the zero level.
A bullish crossover may be forming, indicating potential upward momentum.
Histogram is nearly neutral, showing weakening bearish pressure.
4. RSI (Relative Strength Index)
RSI is around 36.89, below the 50-neutral line, suggesting bearish bias.
However, there’s a small upward slope — a sign of possible reversal.
RSI crossing above 50 would confirm strength in buying momentum.
5. Volume
Volume has been declining over time, indicating accumulation.
A strong breakout will require a significant volume surge.
6. Chart Pattern
CHZ seems to be forming a falling wedge or a compression zone, typical of accumulation before breakout.
A breakout above $0.07 would confirm this pattern.
7. Upside Target
If CHZ breaks out, the chart suggests a long-term target near the 0.786 Fibonacci retracement level (~$0.39).
This represents a potential +900% move from current levels.

The Bullish Case of CHZGETTEX:CHZ
As long as #CHZ is above $0.0486 (stop-loss), two bullish scenarios are expected.
Passing $0.1380 is a bullish confirmation to target a new ATH.
#Chiliz

Wave 3We are in the 3rd wave of the 3rd wave. The end of this wave is the ceiling of the previous chz movement.
We are waiting for higher ceilings for wave 5.

Chiliz - CHZ Mega Long Really strong bullish dragon at support with massive bullish divergence on the macd and RSI. The weekly closing with a bullish doji at support also, everything you want to see.
We are long with leverage and a sl placed. However, crypto tends to scam around at these levels, it is vital to follow price action and be ready to reenter should a fake breakdown occur. Otherwise this is a great area to accumulate, and hold for the bull market until support gets indefinitely broken.

Chz, ignored but strong!Did you see that?
It goes without saying.
A huge bullish flag in weekly time frame.
It can give at least %700% in mid-to-long term.

ChilizIn relation to technical analysis, Chiliz is awesome in a weird a way! First, consolidating in a triangular/boat like zone, then bursting upward. Next, enter a corrective phase in a downtrend channel. Could it burst again upward reaching Fib level 1 making ABC pattern in which A=C? Only time will tell. Let's see what happens.
P.S. the middle of the triangular consolidation zone is selected as the start point of Fibonacci extension.

CHZThe New DOGE. Chz ready.chz is ready for action.There are positive divergences in monthly and weekly MACD.

CHZ has shown excellent performance🚀 #CHZ has shown excellent performance: the token has reached the first take-profit level (0.083). Everyone who entered the recommended buy zone (0.06-0.07) can now move their stop-loss to breakeven to minimize risks. We are waiting for further movement towards the next targets.
📊 Current take-profit levels:
✔️ TP2: 0.11
✔️TP3: 0.15
We stay in the game and keep an eye on the market.

CHZ and fan tokens are rising: Don’t miss the $PEPPER airdrop!🚀 Bought CHZ token: There's serious activity around fan tokens. SEED_ALEXDRAYM_SHORTINTEREST2:OG already hit x2, and other tokens are also rising.
🟢 The CEO of Chiliz announced an airdrop of NCDEX:PEPPER tokens for GETTEX:CHZ holders on his Twitter. Binance will support this event and conduct 4 balance snapshots on October 10, 17, 24, and 31.
📊 My strategy:
Buy zone: 0.06-0.07
TP1: 0.083
TP2: 0.11
TP3: 0.15
Stop-Loss: 0.055
💡 Airdrop: 1 GETTEX:CHZ = 150-1000 $PEPPER.

CZHUSD: One breakout to go before it rises +125%.Chiliz is heavily bullish on the 1D timeframe (RSI = 68.274, MACD = 0.005, ADX = 21.056) as it is trading considerably higher than the 1D MA50. If it crosses over the LH trendline, we expect it to aim for the HH of the Bullish Megaphone. Both HH prior reached the 2.5 Fibonacci extension. We will aim a little under that level (TP = 0.35000), which will be a +125% rise from the current LH breakout level.
## If you like our free content follow our profile to get more daily ideas. ##
## Comments and likes are greatly appreciated. ##

CHZ/USDT Secondary trend. Wedge in the channel. Breakout. 15 11 Logarithm. Secondary trend (part). A descending wedge (bullish shape) was formed in the descending channel. It is linear on purpose to remove "market noise". There is a breakthrough of its resistance. There is a high probability that the targets will be reached. The coin on the super profit funds, remember this working with it observing the banal risk management.
The price has reached the local dynamic resistance of the internal descending channel. Perhaps there will be consolidation in this zone, then the continuation of the trend development with a high probability.
🐳 From FTX/Alameda wallet sent CHZ 37,735,856 ($2,890,000) to exchanges. The amount is not big at the moment, but still, to sell to large market participants you need to make "general hype", and liquidity. Sending CHZ by alameda as an example.
🐳🗣🐏Already started to publish on some crypto coins positive news accompanying the price. This coin will not be an exception, but they will come up with (positivity, usefulness, cooperation and so on, any flight of fancy...) at high pumping percentages.
Major trend .
CHZ/USD Main trend. Pivot Zones. Published 3 03 2023
15 11 2023

CHZ/USD Main trend. Pivot Zones.Logarithm. Time frame 1 week The main (long-term) trend. The idea is to understand where the price is in the main trend. Reversal zones and key support/resistance levels for work.
This is what it looks like on a line chart.
Secondary trend. Time frame 3 days.
CHZ/USDT Secondary trend
Local trend. Time frame 1 day.
CHZ/USD Local trend. Pivot area.

#CHZ/USDT Chiliz has formed a rising wedge, which is typically #CHZ/USDT
Chiliz has formed a rising wedge, which is typically a bearish signal🐻
The target, if the bearish scenario occurs, is around $0.099🎯

Ready For Short!High Liqudty Will Come Today Because Today Is Monday And It Will Be The Big Sellers Demand.So I Think Market Will Go Down And Make Hanging Man Candle.

CHZ LongChiliz is current on confirmation phase of its recent weekly breakout.
Chiliz looking SUPER HOT.
Cannot leave without taking a bite....

CHZ to the moon!Hello hello.
Look at this lovely bullish flag.
Pullback is over.
I reckon it's the best time to get the ball rolling.
Wish you the best.

Crypto News and FUD? - look at ChiliZ CHZ🌶️CryptoNews and FUD?
Take your favorite cryptocurrency and look at the weekly chart👀
Like this one on ChiliZ CHZ🌶️
Many good cryptocurrencies are just in a healthy correction🚨🚀
Comments💭, Likes♥️ & Follow🔗 appreciated dear Crypto Nation🤗
Let me know your thoughts in the comments🤗
⬇️⬇️⬇️
Likes and Follow for updates appreciated🤗
Disclaimer:
Not financial advice
Do your own research before investing
The content shared is for educational purposes only and is my personal opinion

Chiliz - Hot PepperAscending triangle target is the low to the height of resistance.
Target is .1583
Linear regression shows clear channel upward. Resistance around current level .1160, and at .15

Falling wedgeIt is clear in 15min chart that we have a falling wedge pattern that will probably make the price go up
