CHZ Falling Wedge and Head and Shoulders Reversal Patterns CHZ has fallen like everything else, however is showing some very nice bullish reversal patterns. We seemed to have hopefully created a bottom and broken out of the Falling Wedge pattern it has been in since 09/21ish. Also created a very clean Head and Shoulders Pattern, if it breaks above the neckline of $0.297 and BTC behaves we could see some very nice gains. 3 possible targets on chart. RSI was rejected coming down and shot back up above midway line. MACD looking good.
CHZUSDT trade ideas


CHZ move is not sustainable $CHZ volume is too low compared to 2021 explosion.
I don't see a real Fomo coming now.
Please be careful!
It is not a sustainable move.
World cup narrative is BS .

CHZUSDTforming descending channel in daily tf
incase of breakout expecting move towards new ath
not a financial advice

cluster resistance is here, dip before rip? 🙈drop boost and follow for more, most likely scenario is cluster resistance rejection, dip to .23 then uptrend continues.
bearish scenario is trend support/.22 level breaks and we see a huge dump ✅


CHZUSD ❕ trading between zonesCHZ is trading between two zones and has now reached the upper one.
The BB indicator indicates overbought (4H, 1H and 30m TFs)
RSI chart indicates overbought (1H and 30m TFs)
I expect a drop in the asset if the price holds under the resistance zone.

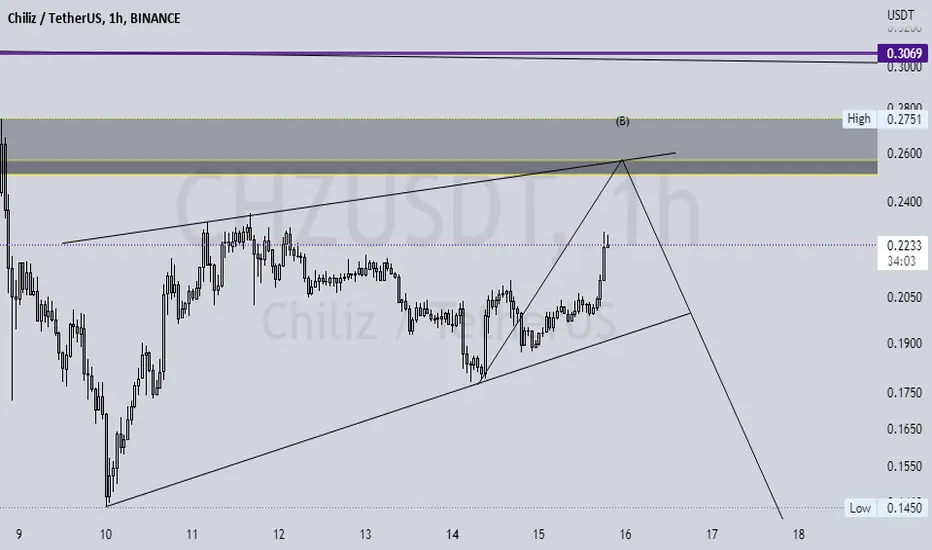
#CHZUSDT SHORTChilliz is probably in the Wave B of this Correction and I expect rejection from the level specified on the chart. Let's see how this will turn out.

CHZ IS preparing to make a big move!It has been 90 days of moving sideways! Didn’t go down this time to the demand zone in the green area! In addition to , a devolving beautiful pole flag! Once it breaks this resistance, it’s going to make 200% at the very least considering the time that been spent over that area!

CHZ Chiliz PumpDiamond reversal and inverted head an shoulders. Break these patterns and we have a pump. Measured moves noted.
This coin not affected by the FTX debacle.


$CHZUSDT UPDATE!!!Hi Snipers,
Please refer to the recording for the next price levels and scenarios.
Thanks
MS

CHZ Inverse Head & Shoulders???I don't know about you, but this sure looks like an Inverse Head & Shoulders pattern to me. Hmmmm... And with the World Cup kicking off in a few days, CHZ involvement in the festivities will no doubt give it a fundamental boost as well. I figure a blind man could hit this target with a peashooter in a blizzard. The way I see it, the only thing that could possibly screw this up, is "King Coin" (BTC) taking another dive in the deep end of the pool, which of course could happen at any given moment, regardless of how any of us may try to predict to the contrary. I've been doing this long enough to have experienced the shattered set ups and broken dreams of a home run completely evaporating on the movement of BTC, so beware. I'm watching for a break of the neckline and subsequent retracement and if were in the clear then this thing should blow up. Just imagine if BTC has a little Bear Market Rally at the same time...just imagine.
This is of course NOT financial advice and if you take it as a such, you should know that I lose waaaaaay more often than I win, so it is quite possibly bad financial advice (more than likely) and you will be the mockery of your entire circle of friends. Both of them. My musings should be considered humor at best, which I feel we need a bit more of in this very stressful space. Also, trading has been known to cause in increase in respiratory function, heart rate, blood pressure, and core body temperature. In some extreme cases it has lead to heart failure. If you experience heart failure you should stop trading immediately and call you doctor. Do not stop trading altogether at once as this can have serious side effects associated with withdrawal. Consult your doctor when thinking about quitting trading. Oh, and have fun, cause if it ain't fun, then why the hell are you doing it?

CHZ-USDT + 43% PROFIT DONE THIS MONTH ✅spot trading
chz-usdt
buy : 0.18$
sell: 0.26
((( profit: 44 % done ✅✅✅ )))


CHZ Update: M or Flag?So I made a Bullish analysis before showing that CHZ is drawing a Bullish Flag in a biger scale. Let's have a look a little bit closer.
So of course market can go either UP or DOWN (Genius). Direction doesn't matter, we should take our positions according to it. I showed two different path that CHZ can follow.
RED LINE:
Bearish scenario can be activated if the price drops below the support area that I have shown in the Graph. In that case "M" shape will activated so price can fall down to the lower trendline, which is a good point to buy some CHZ.
BLUE LINE:
Bullish scenario can be activated if the price breaks the ressitance area. Then, Bullish flag will be activated so we can see the price can move up first in the region 0.44-0.55$. Then, probably price will get rejected from that area. However, if it can exceeds that area than we can see upward movement up to 1$. Price will %90 rejected from this area because of the "rounding effect".
This is not a financial advice. This is just my trials.

CHZUSDTMy idea for the Bottom CHZ.
Love this project and it's going such a big player in the sports industry for decades to come IMO.
Put your orders in just below June Low. 7-8 cents would be a great fill.

CHZ/USDT Analysis Technical in Daily 🌼😃Hi 🤞
As can be seen in the chart, the price has hit the resistance zone of $0.26 to $0.28 three times, but has not been able to cross it so far. One of the general nature of markets that traders are constantly involved with is a phenomenon called Stop Hunt or Stop Hunting; Stop Hunt occurs when a trader has entered a trade and has set his limit, after some time the price has reached the limit and activates it and exits the trader from the trade. Then the price movement is reversed and goes in the direction of the trader's analytical process. Recently, Chiles has formed a lower floor than its previous floor by hitting the resistance zone (Bearish Zone) and its fall, which has led to the breakdown structure (BOS) in the daily timeframe. This event causes the current uptrend (short-term) to change to a downtrend. If you look at the left side of the chart in general, you will notice that another BOS structure has formed, where the price has the ability to cross above the major pivot A at the $0.33 level. According to these two mentioned criteria, the general trend of this cryptocurrency is downward, and in the medium term, the price will drop below floor B, which is at the price level of 0.08 dollars, there is a high probability of happening. If the price breaks through the resistance zone of $0.26 to $0.28, it has the ability to reach the levels of $0.33 and $0.35 (weak scenario). Otherwise, with the loss of the $0.15 support area, the price is expected to react to the $0.1 and $0.08 levels.
🌈If you apperciate Arztoday Team work , Please like and comment , It Keeps us motivated to do better🌈
Arztoday Team🌟
Analyzer ✍: AR.Rashidi

CHZUSDTCHZ Making it's final move to the top.
Above all 4 EMAS and looking strong after PullBack
Target is start of Supply Zone

CHZUSDT(CHILIZ) Daily tf Range Updated till 16-11-22CHZUSDT (CHILIZ) Daily timeframe range. One of the thing if you notice even through volatile crypto downtrend it never got back to its old lows, it held back. it do tell there are quality holders their. Beside it got a solid fundamental backing. A active dev team. To technical part it got optimal volume . At this state there are clean setups one can find here and there throughout its levels.

ChzUsdtchiliz good move this time so you can buy on entrypoint
3entry point is good for i think btc can again little back bot and for market fear this move can fast and btc range again start move again so i show u 3 entrypoint
u think fastets move can buy little up can wait and little risk can wait for last entry point
we can see 1 triangle but i not set that on chart
GL
EntryPoint:
0.1813
0.1654
0.1339
Supports:
0.1047
0.0820
0.0578
Resistance:
0.2565
Targets:
0.3662
0.5220
0.9662
HODL and mid time:
1.6499
GL

CHZ to hit ATHBy close one daily candle above 0.289, there is high possibility to hit the ATH specially with upcoming world cup.
Keep an eye!

CHZUSDT: Correction WaveCHZUSDT also the other cryptocurrencies uptrend correction wave "abc" and so start downtrend to touch the target shows on the chart.