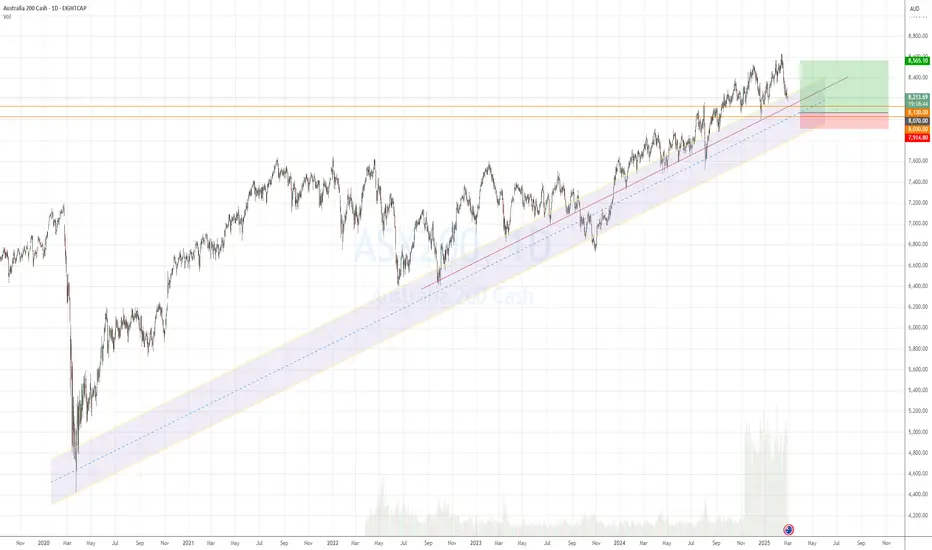
ASX 200 support levelsimportant levels of support 7850 ( 38% retracement),extremely strong support 7600 (50% retracement). I believe 7850 would send a bounce before touching 7600
AUSTRALIA200CFD trade ideas

AUS200 - LONG / BUYTeam, I missed out yesterday when the dipped at 8185, and I did not enter,
today is my opportunity to enter 8188
will add more at 8145, STOP LOSS at 8110
Target 1 at 8222-8242
Target 2 at 8265-8282
NOTE: once it breaks above 8215 or the first target, take partial and bring stop loss to BE.

ASX to find buyers at market price?AU200AUD - 24H expiry
Price action has continued to trend strongly lower and has stalled at the previous support near 8150.
Price action looks to be forming a bottom.
Risk/Reward would be poor to call a buy from current levels.
A move through 8250 will confirm the bullish momentum.
The measured move target is 8300.
We look to Buy at 8175 (stop at 8125)
Our profit targets will be 8275 and 8300
Resistance: 8250 / 8275 / 8300
Support: 8200 / 8175 / 8150
Risk Disclaimer
The trade ideas beyond this page are for informational purposes only and do not constitute investment advice or a solicitation to trade. This information is provided by Signal Centre, a third-party unaffiliated with OANDA, and is intended for general circulation only. OANDA does not guarantee the accuracy of this information and assumes no responsibilities for the information provided by the third party. The information does not take into account the specific investment objectives, financial situation, or particular needs of any particular person. You should take into account your specific investment objectives, financial situation, and particular needs before making a commitment to trade, including seeking advice from an independent financial adviser regarding the suitability of the investment, under a separate engagement, as you deem fit.
You accept that you assume all risks in independently viewing the contents and selecting a chosen strategy.
Where the research is distributed in Singapore to a person who is not an Accredited Investor, Expert Investor or an Institutional Investor, Oanda Asia Pacific Pte Ltd (“OAP“) accepts legal responsibility for the contents of the report to such persons only to the extent required by law. Singapore customers should contact OAP at 6579 8289 for matters arising from, or in connection with, the information/research distributed.

Long term channel bottom about to be tested, good long entryThe multi month channel bottom is being tested. An attractive 1:2 or 1:3 RR setup. Entry between 8130 - 8030 with a DCA target of 8070, SL: monthly close below 8000
AUS200 - PREPARE TO GO LONG ENTRYGood morning Everyone,
Today when the AUS200 open in 20 minutes, i will consider entry long - but small at 8208-18 ranges,
May consider adding long at 8182-92 but I need to review how significantly the DOW will fall or recover before I am attempting .
Please ensure stop loss around 8165-69
Our target 1 - at 8142-56
Target 2 at 8256-83

#017 Trust The Process AU200AUD Buy 1341SGT 24022025Buying the AU200 against the AUD.
I have another position in AUD, taken last week or so.
That's the GBPAUD, and I shorted that pair(buying into the AUD).
Now, I am selling the AUD(buying into the inflation's effect in the stock market.)
I want to win, omg I can't sleep at night. I need to be good and skillful so I could make my strategy work for me, I learned all this stupid techniques, and I am going to make bank yoy.
I just need to lock in, and focus, and nofap, and have faith in God, and Andrew Tate all the way, I can do it omg.
1344SGT 24022025

LongTP-1 is highest probablity, TP2 can hit if see good green candle in area of Tp-1 Level, Tp-3 is long runner trade
Looks like good trades
Lets monitor.
Use proper risk management.
Disclaimer: only idea, not advice.

AUS200 "Australia 200" Indices Market Heist Plan🌟Hi! Hola! Ola! Bonjour! Hallo!🌟
Dear Money Makers & Robbers, 🤑💰🐱👤🐱🏍
Based on 🔥Thief Trading style technical and fundamental analysis🔥, here is our master plan to heist the AUS200 "Australia 200" Indices market. Please adhere to the strategy I've outlined in the chart, which emphasizes long entry. Our aim is the high-risk Red Zone. Risky level, overbought market, consolidation, trend reversal, trap at the level where traders and bearish robbers are stronger. 🏆💸Book Profits Be wealthy and safe trade.💪🏆🎉
Entry 📈 : "The vault is wide open! Swipe the Bullish loot at any price - the heist is on!
however I advise placing Buy limit orders within a 15 or 30 minute timeframe. Entry from the most recent or closest low or high level should be in retest.
Stop Loss 🛑: Thief SL placed at 8530 (swing Trade) Using the 1H period, the recent / nearest low level.
SL is based on your risk of the trade, lot size and how many multiple orders you have to take.
Target 🎯: 8750 (or) Escape Before the Target
Scalpers, take note 👀 : only scalp on the Long side. If you have a lot of money, you can go straight away; if not, you can join swing traders and carry out the robbery plan. Use trailing SL to safeguard your money 💰.
📰🗞️Fundamental, Macro, COT, Sentimental Outlook:
AUS200 "Australia 200" Indices Market market is currently experiencing a bullish trend,., driven by several key factors.
🔆Fundamental Analysis
Australia's GDP Growth Rate: 2.2% in Q4 2024, with a forecast of 2.5% in Q1 2025
Inflation Rate: Australia's inflation rate is expected to rise to 2.8% in 2025, from 2.5% in 2024
Interest Rates: The Reserve Bank of Australia (RBA) has kept interest rates on hold at 0.10%
🔆Technical Analysis
Trend Line: The index is holding above the ascending trend line
Moving Averages: The 200-period and 100-period Simple Moving Averages (SMA) are indicating a bullish bias
Relative Strength Index (RSI): The RSI indicator on the 4-hour chart stays above 50, indicating a bullish trend
🔆Economic Indicators
Unemployment Rate: Australia's unemployment rate is expected to remain steady at 4.2% in 2025
Retail Sales: Australia's retail sales are forecast to rise 3.5% in 2025, driven by consumer spending
Housing Market: Australia's housing market is expected to remain stable, with a forecast growth rate of 2.5% in 2025
🔆Macroeconomic Analysis
Global Economic Trends: The global economy is expected to grow at a moderate pace in 2025, driven by a recovery in trade and investment
Commodity Prices: Commodity prices are expected to remain stable in 2025, with some upside potential due to supply chain disruptions
Australia's Trade Balance: Australia's trade balance is expected to remain in surplus in 2025, driven by strong exports of commodities
🔆COT Data Analysis
Net Long Positions: Institutional traders have increased their net long positions in AUS200 to 60%
COT Ratio: The COT ratio has risen to 2.1, indicating a bullish trend
Non-Commercial Traders: Non-commercial traders, such as hedge funds and individual traders, have increased their long positions to 62%
🔆Sentimental Analysis
Institutional Sentiment: 58% of institutional traders are bullish on AUS200, while 42% are bearish
Bank Sentiment: 55% of banks are bullish on AUS200, while 45% are bearish
Corporate Sentiment: 56% of corporate traders are bullish on AUS200, while 44% are bearish
Retail Sentiment: 52% of retail traders are bullish on AUS200, while 48% are bearish
🔆Market Positioning
Long Positions: 60% of traders are long on AUS200, while 40% are short
Short Positions: 40% of traders are short on AUS200, while 60% are long
🔆Open Interest and Volume
Open Interest: 251,011 contracts (as of current date)
Volume: 151,201 contracts (as of current date)
🔆Next Move Prediction
Bullish Move: The AUS200 index is expected to continue its bullish trend, with potential upside to 8750
⚠️Trading Alert : News Releases and Position Management 📰 🗞️ 🚫🚏
As a reminder, news releases can have a significant impact on market prices and volatility. To minimize potential losses and protect your running positions,
we recommend the following:
Avoid taking new trades during news releases
Use trailing stop-loss orders to protect your running positions and lock in profits
📌Please note that this is a general analysis and not personalized investment advice. It's essential to consider your own risk tolerance and market analysis before making any investment decisions.
📌Keep in mind that these factors can change rapidly, and it's essential to stay up-to-date with market developments and adjust your analysis accordingly.
💖Supporting our robbery plan will enable us to effortlessly make and steal money 💰💵 Tell your friends, Colleagues and family to follow, like, and share. Boost the strength of our robbery team. Every day in this market make money with ease by using the Thief Trading Style.🏆💪🤝❤️🎉🚀
I'll see you soon with another heist plan, so stay tuned 🤑🐱👤🤗🤩

2nd Long Added with Proper RiskManagementLong.
TP-1 will hit forsure, if you want to play full safer than take a little broader SL with proper risk management so you don't get out by lower wick, rest is fine: easy money sitting at TP-1 level.
TP-2 is important level for position management.
Use proper risk management
Looks like good trade.
Lets monitor.
Use proper risk management.
Disclaimer: only idea, not advice.

ASX200- SeasonalityIndices are selling off this time of year.
Bulls could enter market 3rd week of March till Canada day.
Watching for Symmetry to be met at March's S1 ( Yrly M2) for a double bottom and a HL to buy and hold. to YR M4-
Another leg down could be possible to 8100 to retest Annual CPP.

AUS200 is BullishPrice seems to have went down for a necessary retracement, on daily time frame it has retraced to the 0.382 Fib level, which is exactly the point where bulls assumed control of price action in last leg. Moreover, a double bottom formation with a bullish divergence further adds confluence to bullish sentiments. If previous lower high is broken then we can expect the retest of ALTH as per Dow theory. Targets are mentioned on the chart.

AUS200 shortI opened a short position yesterday based on 4H and daily chart.
My reasoning is as follows:
Daily
1) The price broked above the previous high (8525), failed it hold, and dropped and closed below the previous higher high.
2) It moved and closed below the ascending trendline.
3) All momentum indicators are now moving to the downside.
4H
1) The candles consolidated below the ascending treandine and failing to move above the line.
2)The price broked beow Fib 0.238.
3)Both MACD and RSI entered the bear territory.
Entry - 8483
S/L - 8580
Target - 8256
Risk:Reward - 1:2.65

AUS200 Short on Regression BreakAUS200 is now Net-short on the regression break.
It is sitting near the upper bounds and maybe worth considering.

Long Scalp - low riskUse proper risk management
Looks like good trade.
Lets monitor.
Use proper risk management.
Disclaimer: only idea, not advice.

AUS200 - Interest Rate cuts - gives us a positive outcomeHi guys we would be looking into the AUS200!
Fundamentals& Technicals about it !
The S&P/ASX 200 Index (ASX 200) has demonstrated remarkable resilience and growth, reaching new all-time highs in recent months. As of February 12, 2025, the index closed at a record 8,555.80 points, reflecting strong market confidence and surpassing previous records.
NEWS.COM.AU
Several factors have contributed to this upward trajectory:
Robust Corporate Earnings: Major sectors, particularly financials and materials, have reported strong earnings. The financial sector, comprising about 30% of the index, has been bolstered by impressive half-year results from major banks. For instance, Commonwealth Bank reported a better-than-expected half-year profit of $5.1 billion, leading to a 2.4% increase in its share price to a record high of $165.93.
NEWS.COM.AU
Favorable Monetary Policy: The Reserve Bank of Australia's (RBA) recent decision to cut the cash rate by 25 basis points to 4.1% aims to manage inflation, which has been easing faster than anticipated. This move is expected to stimulate economic activity and enhance corporate profitability, providing a conducive environment for equity markets.
Strength in the Mining Sector: Mining companies have significantly contributed to the index's performance. Major players like BHP Group, Rio Tinto, and Fortescue Metals Group have posted gains, driven by strong commodity prices and global demand. The materials sector, accounting for around 20% of the index, continues to benefit from favorable market conditions.
Technological Advancements: The technology sector has also seen notable growth, with companies like Computershare leading gains. Computershare's shares soared by 15.48% after revising its earnings-per-share guidance upwards, reflecting the positive impact of technological innovation and adoption.
In summary, the ASX 200's recent performance reflects a robust and diversified economy, supported by strong corporate earnings, favorable monetary policy, and sectoral strengths. These factors collectively contribute to a positive outlook for the index in the near to medium term.
Entry: 8,500
Target: 8,620 *above the weak resistance level*
SL: 8,450 *sitting around the strong support level*
We are entering with 100 contracts in this trade!

AU200 - BullishAU200 is in bullish trend and currently testing 0.5 - 0.618 Fib level. There is also a trend line support at the same levels adding confluence to our bullish anticipation.

PREPARE TO SHORT AUS200Team, the interest rate will be announced in 4 hours
SET DOUBLE SHORT at 8632-58 - our target at 8592-98
SET SHORT AUS200 at 8580-92
Target 1 at 8532-26
Target 2 at 8505-8493
Target 3 at 8455-65

ASX intraday dips continues to attract buyers.AU200AUD - 24h expiry
Trend line support is located at 8500.
Further upside is expected although we prefer to buy into dips close to the 8500 level.
A move through 8550 will confirm the bullish momentum.
The measured move target is 8675.
Short term RSI has turned positive.
We look to Buy at 8500 (stop at 8440)
Our profit targets will be 8660 and 8675
Resistance: 8550 / 8600 / 8675
Support: 8525 / 8500 / 8450
Risk Disclaimer
The trade ideas beyond this page are for informational purposes only and do not constitute investment advice or a solicitation to trade. This information is provided by Signal Centre, a third-party unaffiliated with OANDA, and is intended for general circulation only. OANDA does not guarantee the accuracy of this information and assumes no responsibilities for the information provided by the third party. The information does not take into account the specific investment objectives, financial situation, or particular needs of any particular person. You should take into account your specific investment objectives, financial situation, and particular needs before making a commitment to trade, including seeking advice from an independent financial adviser regarding the suitability of the investment, under a separate engagement, as you deem fit.
You accept that you assume all risks in independently viewing the contents and selecting a chosen strategy.
Where the research is distributed in Singapore to a person who is not an Accredited Investor, Expert Investor or an Institutional Investor, Oanda Asia Pacific Pte Ltd (“OAP“) accepts legal responsibility for the contents of the report to such persons only to the extent required by law. Singapore customers should contact OAP at 6579 8289 for matters arising from, or in connection with, the information/research distributed.

ASX200 outlook ahead of RBA Rate Decision The ASX200 (AUS200) price action sentiment appears bullish, supported by the longer-term prevailing uptrend. The recent intraday price action appears to be a corrective pullback. towards the previous consolidation price range and also the rising support trendline zone.
The key trading level is at the 8490 level, the previous consolidation price range, and also rising support trendline zone. A corrective pullback from the current levels and a bullish bounce back from the 8490 level could target the upside resistance at 8570 followed by the 8620 and 8650 levels over the longer timeframe.
Alternatively, a confirmed loss of the 8490support and a daily close below that level would negate the bullish outlook opening the way for a further retracement and a retest of 8450 support level followed by 8420.
This communication is for informational purposes only and should not be viewed as any form of recommendation as to a particular course of action or as investment advice. It is not intended as an offer or solicitation for the purchase or sale of any financial instrument or as an official confirmation of any transaction. Opinions, estimates and assumptions expressed herein are made as of the date of this communication and are subject to change without notice. This communication has been prepared based upon information, including market prices, data and other information, believed to be reliable; however, Trade Nation does not warrant its completeness or accuracy. All market prices and market data contained in or attached to this communication are indicative and subject to change without notice.

ASX200 (AUS200) uptrend continuation retest 8460 level?The ASX200 (AUS200) price action sentiment appears bullish, supported by the longer-term prevailing uptrend. The recent intraday price action appears to be a corrective pullback. towards the previous consolidation price range and also the rising support trendline zone.
The key trading level is at the 8460 level, the previous consolidation price range, and also rising support trendline zone. A corrective pullback from the current levels and a bullish bounce back from the 8460 level could target the upside resistance at 8570 followed by the 8620 and 8650 levels over the longer timeframe.
Alternatively, a confirmed loss of the 8460support and a daily close below that level would negate the bullish outlook opening the way for a further retracement and a retest of 8400 support level followed by 8376.
This communication is for informational purposes only and should not be viewed as any form of recommendation as to a particular course of action or as investment advice. It is not intended as an offer or solicitation for the purchase or sale of any financial instrument or as an official confirmation of any transaction. Opinions, estimates and assumptions expressed herein are made as of the date of this communication and are subject to change without notice. This communication has been prepared based upon information, including market prices, data and other information, believed to be reliable; however, Trade Nation does not warrant its completeness or accuracy. All market prices and market data contained in or attached to this communication are indicative and subject to change without notice.

AUS200?
In few weeks to come.
Buying the oz dips.
I see a good run.
Select the best setup for yourself.
All the best

AUS200 Wave Analysis – 13 February 2025
- AUS200 broke strong resistance level 8530.00
- Likely to rise to resistance level 8700.00
AUS200 index previously broke the strong resistance level 8530.00, which has been reversing the index from the start of December.
The breakout of the resistance level 8530.00 accelerated the active impulse wave 3 of the higher order impulse wave (3) from the start of this year.
Given the strong daily uptrend, AUS200 index can be expected to rise to the next resistance level 8700.00, which intersects with the daily up channel from December.

ASX 200 Hits New High – Is the Rally Sustainable?The ASX 200 is climbing as Australian earnings exceed expectations and the country appears to be exempt from Trump’s new 25% import tax on aluminum and steel. In this video, we’ll discuss how to trade this, key target levels, and the trend-defining level.
This content is not directed to residents of the EU or UK. Any opinions, news, research, analyses, prices or other information contained on this website is provided as general market commentary and does not constitute investment advice. ThinkMarkets will not accept liability for any loss or damage including, without limitation, to any loss of profit which may arise directly or indirectly from use of or reliance on such information.
