Aussies not looking happyThe current picture on the 3D time frame shows the following:
1. Price has rebounded to a 61.8 fib and is struggling.
2. The market has disallowed 6200 on four occasions.
3. Price is flattening in a structure zone.
4. The rebellion to current level has taken 5 times what it took for price to crash.
5. This is still a bear market as price has not nearly challenged the 6620 level.
None of each of the above means anything on it's own. But taken together the probability is for the south around this time. How far south - nobody knows! The probability can change as new information emerges.
Disclaimers : This is not advice or encouragement to trade securities. No predictions and no guarantees supplied or implied. Heavy losses can be expected. Any previous advantageous performance shown in other scenarios, is not indicative of future performance. If you make decisions based on opinion expressed here or on my profile and you lose your money, or miss opportunity, kindly sue yourself.
AUSTRALIA200CFD trade ideas

ASX200 / Corrective structure and target on the next ResistanceMain items we can see on the chart:
a) The price is above the ascending channel
b) There we can see a small correction after the new higher highs
c) If the price breaks above the corrective Structure we will assume a continuation movement
d) The target will be the next Resistance zone

ASX about to dropisn't it funny when data comes out while technicals provide same story at the same time.
Job numbers came out today and the market didn't like it while hitting the 200 day moving average as resistance
This is the 3rd time since june the ASX has been weighing down by the 200 day MA.
The following time frames show similiar structure
2, 3 days
The 5 day (1week) shows we have popped over it, but will see tomorrow 1 and 2 hour showing still more downtrend.
wasting time the right waythe price action is taking the shape of a penguin on the 15-minute chart. not to confuse anyone but I think we all know how to trade this basic shape. :) Have a good dy=ay

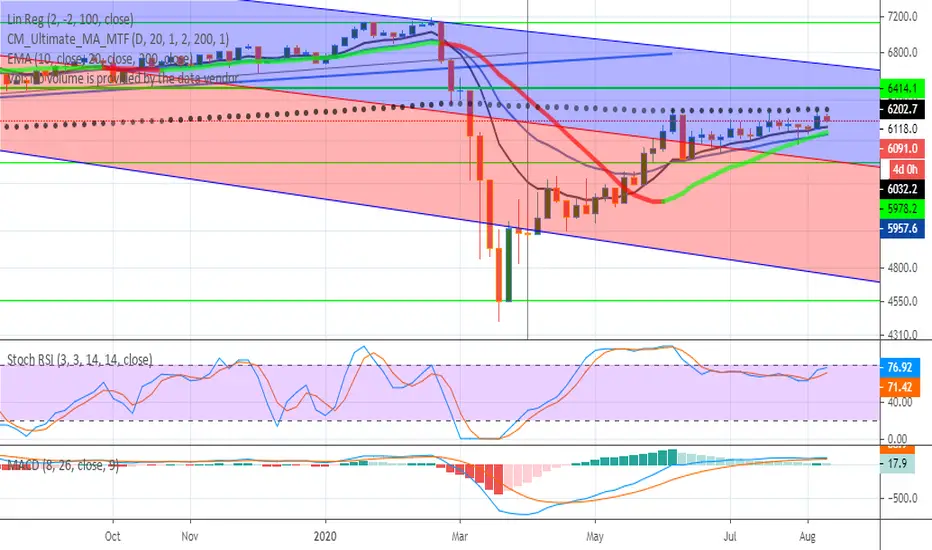
XJO aka ASX200 attempting to break the 200MA XJO aka ASX200 is trying to reach one milestone that has been thing of the past since the last plunge in early March 2020. is it gonna succeed and fly higher to the moon or this is gonna be a rejection and send us back to the abyss. As TA lets dive deep into the charts and analyze.
From last few days XJO has come up with strength trying to defy the bears traps that wanted to push down down into the abyss. But at the moment the price is at a critical point: 200MA which has been historically the separation line between bull and bear market. Does XJO has strength to break that magic line and go up towards the 7k levels? I have been keeping an eye on this index to know the directions of the whole Australia stock market as we know it. Below are the highlight of the bulls strength vs Bears strength:
- 50MA acting as support: we saw last time price bounced on this magic line
- PSAR flipped to the upside which is inherently bullish
- Price above the Golden Fibonacci. Hopefully it will act as support
- Price above historic resistance/support at 5969
- Price attempting to break 200MA this is bullish if and only if the price rips up that 200MA.
- Bears have one point too, the uptrend line has been broken few days back and it may be hard to reclaim it probably we will have to draw a new uptrend line.
For those late to the party and who want to go long better wait for the price to close above the 200MA at least 1 day then try to get in with tight stop loss.
I will keep you informed as this market keeps swinging up and down.
Stay safe and dont forget to smash the liked. I am scanning the market for the next stock of the week as I have been giving you the best of the bests so far.
XTF.


XJO - Heavy Resistance Zone So the last 3 months we have stalled around and up to 6150 it's obviously an important area but it's actually a VERY important area, the reason why we've had such a hard time getting through is not only due to the .618 Fib level but also we have a convergence of the 200 day MA and the 200 week MA, hence why we have stalled from a technical viewpoint, the outcome of this move (breakout or failure) will determine which way our market goes longer term.
However I view it as bullish the fact that we have sort of hung around and consolidated below the zone, with no real major rejection, suggests that energy is being formed for a bigger breakout move to the upside which is common when a chart has consolidated below a key area. We'll have to wait and see

Australia 200 - buy setupI assume a complete flat correction.
Wait for the momentum gaining to the upside

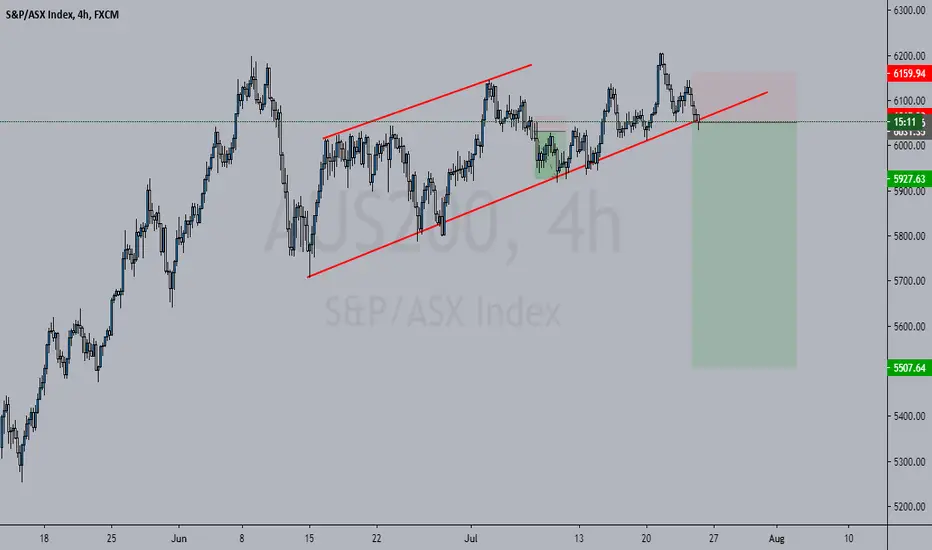
AUS200 H4, H1 Long Flag & inverse Head and Shoulders ViewAUS200 H4, H1 Long Flag & inverse Head and Shoulders View


The trend is your friend, Go long until this breaks. It did $XJOWe closed below the trend line last week,
can we get above it this week???
If we fail to do so, more selling will come and this could go for several days or weeks.
The RSI indicator is still showing a downtrend and if we close below last week's low this week, (5893)
it will trigger a sell signal with the TD sequential indicator.
Furthermore, the MACD indicator is about to fire a sell signal...
Therefore, be careful trading this week.
Maybe, it is a good time to take some profits ...

Ascending triangle formation Account management?
$500 upwards
50/50 profit sharing each week
No scam zone

S&P ASX 200 crucial price points to watch for 3/8/2020S&P ASX 200 crucial price points to watch 3/8/2020
The Index closed Friday's session down more than 2% but managed to close just above a critical point at 5191.20, which was also in line with the bottom of the price channel, as indicated on the H 4 price chart.
5191.20 will be the first crucial point to watch on Monday's session; the Index will need to hold above this point to head back up. If successful, 5998.40 and 6046.70 could be its immediate targets. The Index could fall further down to 5870.88 and 5791.00 if it fails to hold above 5191.20


AUS200 Potential longIf we see a risk on sentiment reflected in the Australian stock market today we could see the AUS200 push to new quarterly highs. This setup provides a risk/reward of 2, with a generous stop size.

LAST ROLL OF THE DICE...After burning thru a tonne of Money on Puts dated far too short since March 24th , I think I finally have it right
since the Global "ROLLOUT" of the incredibly annoying campaign of concerted MARKET WIDE INTERFERENCE by 1st World Central Banks in what has amounted to the CIRCUS equivalent of an
' ALL BELLS, WHISTLES COMPLETE WITH STUPID HORNS' CLOWN PARADE PAR EXCELLENCE !!!'
Whilst it was OK to kick the can down the road for many years, that required a fundamental prerequisite to continue;
..that there still was a road to kick it down !!!
Unfortunately he Clown Car full of Central Bankers, Socialists and Keynesian Economists has failed to note the Skull and Crossbones sign screaming:
"DANGER !!! ROAD ENDS !!! YOUR LIFE IS AT RISK !!! TURN BACK NOW !!!"
As such, the Clown Car, full of CLOWNS falls off the cliff and begins tumbling into the abyss starting this Monday 27th July 2020 and we will see the start of the Elliot down in
what will be devastating to MOST ASSET PRICES in a rampant continuation of the ANGRY Bear's RAMPAGE that was briefly put on hold ONLY via MASSIVE GLOBAL STIMULUS, STAGGERING MONEY PRINTING and HELICOPTER MONEY for
ALL and ALL MANNER of stupid Central Bank Interference and an unprecedented 'propping up' of Zombie Consumers/Workers/Businesses and Investors to
such an outlandish,unnecessary level I think even the dyed in the wool Socialist Maynard Keynes might have questioned as 'excessive' & 'inefficient'...how about 'not prudent' Maynard? Me thinks so very much!
After a good amount of some well informed reading tonight I AM convinced that on Monday...
the Levee breaks and OOOOOFFFFTTTT !!! Watch out below.
To save writing an EPIC to justify my belief to you and largely plagiarising much of what others have written, I've included the links that confirmed and strengthened a view I already had to confidently call
"TIME" on this Clown Parade anf for Fundamentals, Sanity and Truth to re-assert itself : The Music has stopped, Party is over, BULLS GO HOME or face nothing short of Financial Genocide.
Wait until the Market assimilates the information contained in the links below. Sobering reading indeed...
schiffgold.com
schiffgold.com
schiffgold.com
schiffgold.com
schiffgold.com
schiffgold.com
schiffgold.com
schiffgold.com
www.zerohedge.com
I ALSO draw your attention to the Double top that was soundly rejected today as even Johnny Public has begun to ask the million dollar question:
"How can the Stock Market be going up yet..?"
The data, the data, data..?
I note, interestingly, that next week's predicted Market Meltdown will just so happen to coincide with the Gold spot price making new ALL TIME HIGHS this weekend.
I'll leave you to draw your own conclusions just from that KEY piece of information.
Gold is still "the Canary in the Coalmine."
Stay safe and God Bless.
xCM
@MystryBox & @Fractal777 > I think our time has arrived! Thank Christ for that as anymore of this Market Insanity I think I may have gone "Joker" and flipped ! ! !

Australia 200 ready for breakoutConsolidation finally looks complete and ready to breakout. Very bullish consolidating above the 20dma and just under the 200dma, should see considerable push up once 200dma is broken.

Aus200 - Long - 4hr TFAscending triangle pattern coming to completion.
Bias is bullish.
Two ways to play it -
1) Buy now and hold, hoping it breaks out (best profit potential)
or:
2) Wait for breakout of triangle and then enter position.
Stop if price breaks the triangle to the downside.

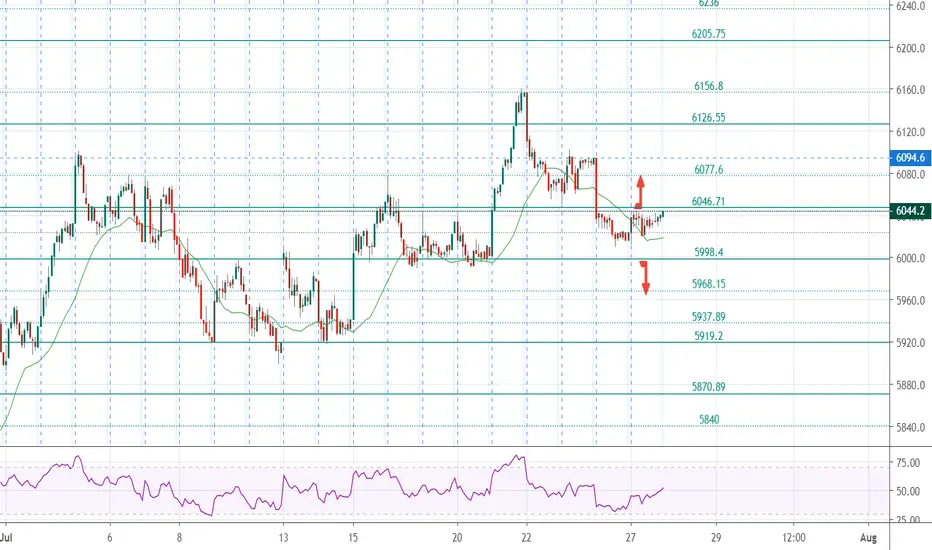
ASX 200 Index is expected to test 6046.70 Tuesday's tradesASX 200 Index is expected to test 6046.70 Tuesday's trades following the rise of US major Indices in Monday's session.
Major support is at 5998.40 and resistance at 6046.70, 6077.60, 6094.60, and 6126.55


Back to the top...Entry: 6253.59
Maybe after breaking this level the market will come back to itˋs latest top...