HKEX to stall at current high?HS50 - 24h expiry - We look to Sell at 20305 (stop at 20425)
We are trading at overbought extremes.
A Doji style candle has been posted from the high.
This is negative for short term sentiment and we look to set shorts at good risk/reward levels for a further correction lower.
Further downside is expected although we prefer to sell into rallies close to the 20305 level.
Although the anticipated move lower is corrective, it does offer ample risk/reward today.
Our profit targets will be 20005 and 19650
Resistance: 20850 / 22790 / 24770
Support: 19650 / 18680 / 17710
Please be advised that the information presented on TradingView is provided to Vantage (‘Vantage Global Limited’, ‘we’) by a third-party provider (‘Signal Centre’). Please be reminded that you are solely responsible for the trading decisions on your account. There is a very high degree of risk involved in trading. Any information and/or content is intended entirely for research, educational and informational purposes only and does not constitute investment or consultation advice or investment strategy. The information is not tailored to the investment needs of any specific person and therefore does not involve a consideration of any of the investment objectives, financial situation or needs of any viewer that may receive it. Kindly also note that past performance is not a reliable indicator of future results. Actual results may differ materially from those anticipated in forward-looking or past performance statements. We assume no liability as to the accuracy or completeness of any of the information and/or content provided herein and the Company cannot be held responsible for any omission, mistake nor for any loss or damage including without limitation to any loss of profit which may arise from reliance on any information supplied by Signal Centre.
HONGKONG50CFD trade ideas

Hang Seng Index (HSI) WCA - Inverted Head and Shoulders PatternHello and thank you for taking the time to read my post. Today, we analyze the Hang Seng Index (HSI) on the weekly scale, focusing on a classic price pattern called the "Inverted Head and Shoulders Pattern." The Hang Seng Index is the leading stock index in Hong Kong and one of the most important in Asia. It tracks the share prices of the 50 largest and most traded companies on the Hong Kong Stock Exchange, representing about 57% of the total market capitalization on this exchange.
Inverted Head and Shoulders Pattern:
The inverted head and shoulders pattern is a bullish reversal pattern that occurs at the end of a downtrend. It is characterized by three troughs or valleys, with the middle one being the lowest (the head) and the two on either side being relatively higher (the shoulders). The pattern is completed by a horizontal line called the "neckline," which connects the highs of the shoulders. In a nutshell, the formation of the inverted head and shoulders pattern signals a potential reversal from a downtrend to an uptrend.
Remember, this is just a brief introduction to the technical aspects of the inverted head and shoulders pattern. As you delve deeper into this topic, you'll discover more nuances and practical applications that can enhance your trading strategies.
Additional Analysis:
Upon analyzing the HSI weekly chart, we observe a downward trend since 16/02/2021, with the blue diagonal resistance line representing the general trend. As classic chart pattern analysts, our attention is immediately drawn to the textbook example of an inverted head and shoulders pattern, clearly defined with the left shoulder, head, and right shoulder. The symmetry between the shoulders is perfect, and the pattern has been forming for an impressive 491 days. This is noteworthy because the longer a price pattern remains consistent, the more powerful the eventual breakout will be.
We cannot predict when the right shoulder will form and break out, but we can see that the price supports the symmetry line in the form of a bullish engulfing (orange mark). The price is currently still below the 200 EMA, which is another indication that we should continue to watch this price pattern closely and not jump to conclusions. Thus, we patiently await our opportunity.
Conclusion:
The Hang Seng Index (HSI) weekly chart showcases an Inverted Head and Shoulders Pattern, reflecting a potential reversal from a downtrend to an uptrend. By closely monitoring the pattern's intricacies and the market's subtle cues, traders can be better prepared for any potential price action in the future. As always, it's essential to consider risk management and proper position sizing when trading based on chart patterns.
Please note that this analysis is not financial advice. Always do your own due diligence when investing or trading.
If you found this analysis helpful, please like, share, and follow for more updates. Happy trading!
Best regards,


FINAL RESULT for the Check this out ExperimentThis is the result of a drawing with shapes I made in my idea "Check this out" & Check this out Snapshot. Both marks, yellow and orange, have been perfect predictions of where the price will be at that exact time. Or maybe these are just coincidences. :)

RESULT for the Check this out ExperimentI doubt the price will hit the orange milestone just it precisely hit the yellow star milestone. Still, there are enough coincidences in this experiment for me. Related ideas: Check this out & Check this out Snapshot

Bias on 28/4/2023Weekly:
1. Perfect align:
Ext Fib. 0.618 is the same of 0.618 downtrend on 23637.
2. The top is broken the previous high.
3. ?? 50% retracement is touch.
Daily:
Downtrend bias:
1. 50 % is actually not touched.
2. 184 is the last Bullish Breaker.
3. If the 184 is touched, double bottom is formed and 50% is hit.
3. Ext Fib. at 0 ext to 0.618 is the last 0.618 downtrend.
4. 184 is key area.
5. Price now is closer to bottom.
My bias:
First, hit 184 than break the previous top, run up to 236.

Check this outWhat if this actually makes sense once the future unfolds on us? If it doesn't... look closer! :)

HSI -Monthly ObservervationThe HSI has pulled back into the previous month ambush zone.
Bulls will likely try defending 19660 or risk a much deeper pull back.

Buying HKEX on dips.HS50 - 24h expiry - We look to Buy at 20260 (stop at 20090)
Selling pressure from 20753 resulted in all the initial daily gains being overturned.
The current move lower is expected to continue.
Short term bias is mildly bullish.
We therefore, prefer to fade into the dip with a tight stop in anticipation of a move back higher.
Further upside is expected although we prefer to buy into dips close to the 20210 level.
Our profit targets will be 20690 and 20770
Resistance: 20850 / 22790 / 24770
Support: 19650 / 18680 / 17710
lease be advised that the information presented on TradingView is provided to Vantage (‘Vantage Global Limited’, ‘we’) by a third-party provider (‘Signal Centre’). Please be reminded that you are solely responsible for the trading decisions on your account. There is a very high degree of risk involved in trading. Any information and/or content is intended entirely for research, educational and informational purposes only and does not constitute investment or consultation advice or investment strategy. The information is not tailored to the investment needs of any specific person and therefore does not involve a consideration of any of the investment objectives, financial situation or needs of any viewer that may receive it. Kindly also note that past performance is not a reliable indicator of future results. Actual results may differ materially from those anticipated in forward-looking or past performance statements. We assume no liability as to the accuracy or completeness of any of the information and/or content provided herein and the Company cannot be held responsible for any omission, mistake nor for any loss or damage including without limitation to any loss of profit which may arise from reliance on any information supplied by Signal Centre.

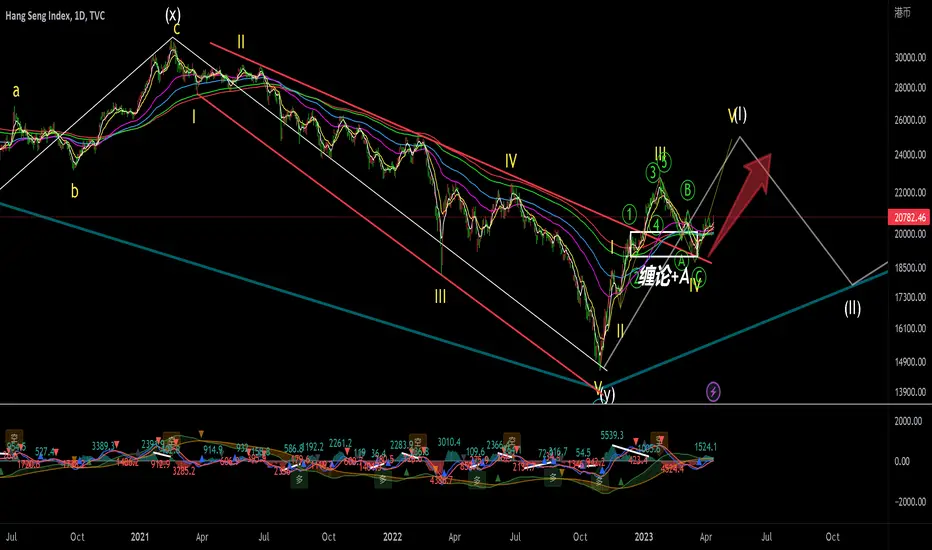
Entanglement and waves(Hang Seng Index daily chart wave count: the correction of the fourth yellow wave has ended, and it is currently rising in the fifth yellow wave.
update view
Hong Kong Stock Index (It shall swing UP higher)
View On Hong Kong Stock Index (13 Apr 2023)
HSI is in
* Uptrend in short term
* Uptrend in Mid term
* Downtrend in Long term
We are seeing a good swing back UP in HSI and it shall go UP higher.
20400~20600 will be the immediate resistant for now but the price shall break UP sooner or later.
DYODD, all the best and read the disclaimer too.
Feel Free to "Follow", press "LIKE" "Comment".
Thank You!
Legal Risk Disclosure:
Trading crypto, foreign exchange or CFD on margin carries a high level of risk, and may not be suitable for all investors.
The high degree of leverage can work against you as well as for you.
Before deciding to trade foreign exchange you should carefully consider your investment objectives, level of experience and risk appetite.
The possibility exists that you could sustain a loss of some or all of your initial investment and therefore you should not invest money that you cannot afford to lose. You should be aware of all the risks associated with foreign exchange trading, and seek advice from an independent financial advisor.

HK50 LONG?The price has tested the 20000 mark for the third time. Proving to be a short term support.
Long was initiated.
Stop loss; 19777.50
Take profit: 20995.39
Risk/Reward ratio:
This remains a risky idea.

HK50 - Short- Strong price rejection
- Exhaustion candles and Evening Star pattern created
- Price downside projection forecast

Hong Kong is bullish long-termHK is setting up for a very nice next 18-24 months. Expecting some chop over the next few weeks and an eventual push through the inverse head and shoulders neckline. This coincides with a weakening dollar which is setting up a head & shoulders pattern in an inverse correlation.

HSI - Falling Trend Channel [MID TERM]- HSI is in a falling trend channel in the medium long term.
- An inverse head and shoulders formation is under development.
- A decisive break of the resistance at 22780, ideally with an increase in volume, signals a further rise.
- The index has support at points 19500 and resistance at points 22600.
- The RSI curve shows a rising trend, which is an early signal of a possible trend reversal upwards for the price as well.
- The index is overall assessed as technically slightly negative for the medium long term.
*EP: Enter Price, SL: Support, TP: Take Profit, CL: Cut Loss, TF: Time Frame, RST: Resistance, RTS: Resistance to be Support LT TP: Long Term Target Price
Verify it first and believe later.
WavePoint ❤️

HK50 LONGHere is my target for your reference only.
Mua(Long): 19200 Ngay(Date): 17/03/2023
TP: 21860
SL: 18700

Hang Seng Index to turnaround?HS50 - 24h expiry - We look to Sell a break of 20150 (stop at 20455)
Previous support located at 20250.
Previous resistance located at 20500.
Price action has stalled at good resistance levels and currently trades just below here (20600).
We expect a reversal in this move.
A move through 20150 will confirm the bearish momentum.
Our profit targets will be 19400 and 19200
Resistance: 20500 / 20525 / 20600
Support: 20250 / 20150 / 19500
Please be advised that the information presented on TradingView is provided to Vantage (‘Vantage Global Limited’, ‘we’) by a third-party provider (‘Signal Centre’). Please be reminded that you are solely responsible for the trading decisions on your account. There is a very high degree of risk involved in trading. Any information and/or content is intended entirely for research, educational and informational purposes only and does not constitute investment or consultation advice or investment strategy. The information is not tailored to the investment needs of any specific person and therefore does not involve a consideration of any of the investment objectives, financial situation or needs of any viewer that may receive it. Kindly also note that past performance is not a reliable indicator of future results. Actual results may differ materially from those anticipated in forward-looking or past performance statements. We assume no liability as to the accuracy or completeness of any of the information and/or content provided herein and the Company cannot be held responsible for any omission, mistake nor for any loss or damage including without limitation to any loss of profit which may arise from reliance on any information supplied by Signal Centre.

Intraday BUY HK50 (03 APR 2023)HK50 intraday trading alert
3 simple steps to find a quality setup !
Risk Reward Ratio 1: 2
Anyone same idea with me?
BUY HK50
Good luck traders..

HKEX to stall at previous swing high?HS50 - 24h expiry - We look to Sell at 20209 (stop at 20430)
Although the bulls are in control, the stalling positive momentum indicates a turnaround is possible.
This is negative for sentiment and the downtrend has potential to return.
Previous resistance located at 20209.
The medium term bias remains bearish.
Further downside is expected although we prefer to set shorts at our bespoke resistance levels at 20209, resulting in improved risk/reward.
Our profit targets will be 19575 and 18680
Resistance: 20850 / 22790 / 24770
Support: 19650 / 18680 / 17710
Please be advised that the information presented on TradingView is provided to Vantage (‘Vantage Global Limited’, ‘we’) by a third-party provider (‘Signal Centre’). Please be reminded that you are solely responsible for the trading decisions on your account. There is a very high degree of risk involved in trading. Any information and/or content is intended entirely for research, educational and informational purposes only and does not constitute investment or consultation advice or investment strategy. The information is not tailored to the investment needs of any specific person and therefore does not involve a consideration of any of the investment objectives, financial situation or needs of any viewer that may receive it. Kindly also note that past performance is not a reliable indicator of future results. Actual results may differ materially from those anticipated in forward-looking or past performance statements. We assume no liability as to the accuracy or completeness of any of the information and/or content provided herein and the Company cannot be held responsible for any omission, mistake nor for any loss or damage including without limitation to any loss of profit which may arise from reliance on any information supplied by Signal Centre.

Shorting HKEX at current resistance.HS50 - 24h expiry - We look to Sell at 19570 (stop at 19810)
Buying pressure from 18823 resulted in prices rejecting the dip.
The current move higher is expected to continue.
The bias is still for lower levels and we look for any gains to be limited.
We therefore, prefer to fade into the rally with a tight stop in anticipation of a move back lower.
Further downside is expected although we prefer to sell into rallies close to the 19570 level.
Our profit targets will be 18880 and 18535
Resistance: 19470 / 20805 / 22505
Support: 18535 / 17600 / 16440
Please be advised that the information presented on TradingView is provided to Vantage (‘Vantage Global Limited’, ‘we’) by a third-party provider (‘Signal Centre’). Please be reminded that you are solely responsible for the trading decisions on your account. There is a very high degree of risk involved in trading. Any information and/or content is intended entirely for research, educational and informational purposes only and does not constitute investment or consultation advice or investment strategy. The information is not tailored to the investment needs of any specific person and therefore does not involve a consideration of any of the investment objectives, financial situation or needs of any viewer that may receive it. Kindly also note that past performance is not a reliable indicator of future results. Actual results may differ materially from those anticipated in forward-looking or past performance statements. We assume no liability as to the accuracy or completeness of any of the information and/or content provided herein and the Company cannot be held responsible for any omission, mistake nor for any loss or damage including without limitation to any loss of profit which may arise from reliance on any information supplied by Signal Centre.

Hongkong 50 BearishHongkong 50 Bearish
Sequence of lower highs and lower lows
Short on strength
Ep: sell stop at 18830(break of lower high) or sell limit at 19130 (.382 fib level) or in instant sell between these 2 levels
Red candles as sellers are present
SL: 19600 last lower high
TP1:18639
TP2: 18344

Stock- MON: HSI Trend Status w/ 21 yrs backtesting, week11
2023, week 11
HSI: at 19,161
According to the latest market update, the Hang Seng Index ( HSI ) is still not in a upward trend, with a current long close at 19,161 points.
Use backtesting to evaluate and make objective trading decisions. - PresentTrading
#HSI

Analysis of HK50 Index on the Four-Hour Time FrameThe HK50 Index has recently given a breakout above the trend line on the four-hour time frame, indicating a potential upward trend. The index has broken several previous highs and is now taking support to continue its ascent.
Traders looking to enter the market can consider a long position, taking advantage of the current support level for a potential uptrend. However, it is important to closely monitor the market and exit the position if the index shows signs of a reversal.
Keywords: HK50 Index, breakout, trend line, support, long position, uptrend, reversal.
Thanks & regards,
Alpha Trading Station
Disclaimer: This view is for educational purpose only & any stock mentioned here should not be taken as a trading/investing advice. We may or may not have position in the stocks mentioned here. Please consult your financial advisor before investing. Because Price is the "King of Market
