hong kong longterm view and long setup hong kong long
😊
Im looking at hong kong 33 and I can see new wave coming for up
There is two look:
The first:
We are in the end of the correction wave (b) and we are going to start the fast (c) wave to make new top
The first part of it going to be the orange (a) and it will be an impulse wave and the target 50% of the (b)
The second:
We are in higher degree B wave and we could have correction then continue the down move to second area (the yellow box ) then will start out impulse wave (historical start)
So in both look we are looking to up move 😊
I put my setup in the chart
Good luck!
Please let me know what you think
HONGKONG50CFD trade ideas


HSI is 2 months bull run is coming to an endBased on my Elliott wave counts, HSI should see another 700 points potential to the upside before coming down. For now, I will caution against going long but be prepared to look for signs for short. Thus, this idea is published as a short.

HK50 | Sell the reopening hopesHK50 has retraced almost 20% after advice from Gov. on reopenings and easing of China's strict COVID policies to hit the 200-day MA, sloping down in a parallel channel since.
Current market sentiment has declined on re-escalation of COVID related deaths and infections, however the market has yet to correct inline with this, so any continued deterioration will lead a significant move lower.
Furthermore, China's growth prospects (GDP) for 2022/2023 have been slashed by the World Bank, with others yet to decide.
Key resistance sits at 19638 (200D MA), with local resistance of 20096 and local support of 18339. 0.618 retracement sits at 17982, 50% at 17334. I expect a rise to re-challange the 200D MA and reject from 19500.

Fading into HS50 negative trend.HS50 - 21h expiry - We look to Sell at 19475 (stop at 19795)
We are trading at overbought extremes. A Doji style candle has been posted from the high.
Price action looks to be forming a top. This is negative for short term sentiment and we look to set shorts at good risk/reward levels for a further correction lower.
Further downside is expected although we prefer to sell into rallies close to the 19475 level.
Our profit targets will be 18675 and 18540
Resistance: 19480 / 20635 / 22510
Support: 18540 / 17605 / 16450
Risk Disclaimer
The trade ideas beyond this page are for informational purposes only and do not constitute investment advice or a solicitation to trade. This information is provided by Signal Centre, a third-party unaffiliated with OANDA, and is intended for general circulation only. OANDA does not guarantee the accuracy of this information and assumes no responsibilities for the information provided by the third party. The information does not take into account the specific investment objectives, financial situation, or particular needs of any particular person. You should take into account your specific investment objectives, financial situation, and particular needs before making a commitment to trade, including seeking advice from an independent financial adviser regarding the suitability of the investment, under a separate engagement, as you deem fit.
You accept that you assume all risks in independently viewing the contents and selecting a chosen strategy.
Where the research is distributed in Singapore to a person who is not an Accredited Investor, Expert Investor or an Institutional Investor, Oanda Asia Pacific Pte Ltd (“OAP“) accepts legal responsibility for the contents of the report to such persons only to the extent required by law. Singapore customers should contact OAP at 6579 8289 for matters arising from, or in connection with, the information/research distributed.

HK50 - Price action looks to be forming a topHK50 - Intraday - We look to Sell at 19560 (stop at 19821)
We are trading at overbought extremes. A Doji style candle has been posted from the high. Price action looks to be forming a top. This is negative for short term sentiment and we look to set shorts at good risk/reward levels for a further correction lower. Further downside is expected although we prefer to sell into rallies close to the 19560 level.
Our profit targets will be 18755 and 18540
Resistance: 19480 / 20635 / 22510
Support: 18540 / 17605 / 16450
Please be advised that the information presented on TradingView is provided to Vantage (‘Vantage Global Limited’, ‘we’) by a third-party provider (‘Signal Centre’). Please be reminded that you are solely responsible for the trading decisions on your account. There is a very high degree of risk involved in trading. Any information and/or content is intended entirely for research, educational and informational purposes only and does not constitute investment or consultation advice or investment strategy. The information is not tailored to the investment needs of any specific person and therefore does not involve a consideration of any of the investment objectives, financial situation or needs of any viewer that may receive it. Kindly also note that past performance is not a reliable indicator of future results. Actual results may differ materially from those anticipated in forward-looking or past performance statements. We assume no liability as to the accuracy or completeness of any of the information and/or content provided herein and the Company cannot be held responsible for any omission, mistake nor for any loss or damage including without limitation to any loss of profit which may arise from reliance on any information supplied by Signal Centre.

HSI, almost perfect, until recentlyHSI, almost perfect, until recently.
only 2007 to 2008, HSI were out of the uptrend channel.

Looking For Some China PullbacksWhen it comes to China I like to watch the Hang Seng Index. That index remains in a bullish bias complexion with resistance levels at 19,706.90 and 19,983.24. Downside potential areas are 19,483.56, 19.260.22. China has been experiencing self-government policies, of which, are dictating their markets significantly. All-in-all, I do not correlate the two as relevant to overall market strength, sentiment, or complexion to the NYSE.

Hang Seng Cup and Handle upside to comeCup and Handle has formed on Daily with Hang Seng.
The breakout was strong, and if we weren't in, we'd wait for a bit of a pull back for a consecutive entry level.
7>21 < 200 Moving Average which gives it a Bullish bias.
With the Covid restrictions lifting slowly and things finally showing a recovery to come for the economy, this could be the helpful catalyst for upside for the index.

HSI Anticipating lower high Weekly Analysis, looking for a lower high compared to 22565 with Weekly Hidden Bearish Divergence on both RSI & MACD
Using retraces for entries, tight stop at the .786 in case of possible reversal and full position at the .886
If you agree or disagree with the setup, please let me know and explain ! We're all here to learn and grow off each other!

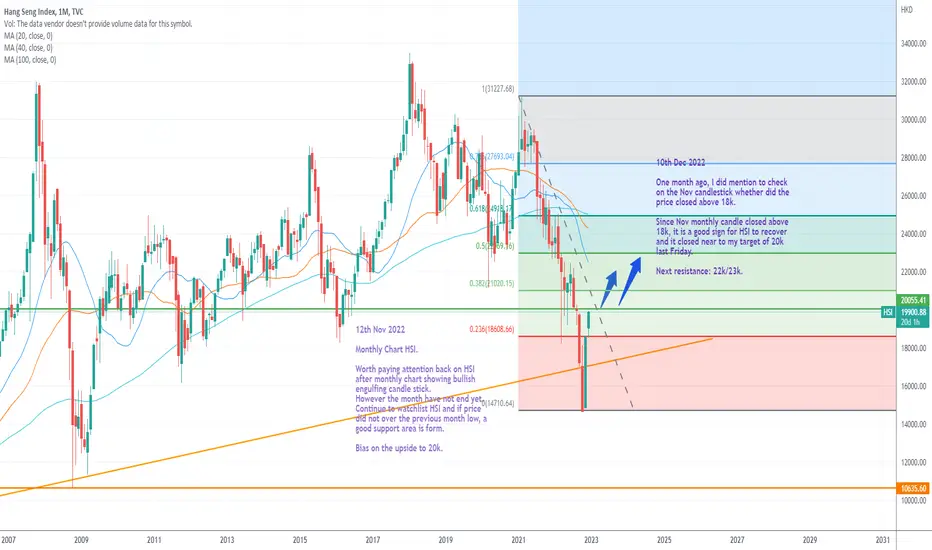
HSI bias upside with 22k resistance10th Dec 2022
One month ago, I did mention to check on the Nov candlestick whether did the price closed above 18k.
Since Nov monthly candle closed above 18k, it is a good sign for HSI to recover and it closed near to my target of 20k last Friday.
Next resistance: 22k/23k.
Hong Kong Stock Index (The rebound is in the making)Hong Kong Stock Index (14 Nov 2022)
HK index is in the pull back phase and I reckon it shall continue for quite some time.
18,000 is a good strong resistant but the pull back down shall be mild.
The nearest strong support is 16,000 and it shall go higher and higher again.
19,000~20,000 will be the strong resistant region. Then, we will talk about what's next.
Legal Risk Disclosure:
Trading foreign exchange or CFD on margin carries a high level of risk, and may not be suitable for all investors.
The high degree of leverage can work against you as well as for you. Before deciding to trade foreign exchange you should carefully consider your investment objectives, level of experience and risk appetite.
The possibility exists that you could sustain a loss of some or all of your initial investment and therefore you should not invest money that you cannot afford to lose.
You should be aware of all the risks associated with foreign exchange trading, and seek advice from an independent financial advisor.
DISCLAIMER:
Any opinions, news, research, analyses, prices or other information discussed in this presentation or linked to from this presentation are provided as general market commentary and do not constitute investment advice.
Sonicr Mastery Team does not accept liability for any loss or damage, including without limitation to, any loss of profit, which may arise directly or indirectly from use of or reliance on such information.

HSI heading SouthHang Seng Index rebound should have finished around 19500. Stochastic is overbought and the rebound is still below 60 week moving average
which means the downtrend have not been changed. Property market, and the lack of factory order in China, should still hit Hong Kong economy
Next year, most of the Economy will fall into recession, even Taiwan Central Bank is expected major economies will fall into recession in 2023https://www.cbc.gov.tw/tw/cp-302-156071-41d1b-1.html

HSI - Bull signal is hereComment :
1) TrendX+ indicator - wandering below red trend line, still mid-term downtrend
2) DDX+ indicator - Bull signal shows up, looking forward a short-term long position
3) MCDX+ indicator - weak banker bar (red) cross-up MA10 line, while retailer bar (turquoise) has occupy more than 50%
Support & Resistance :
R : Resistance line A
S : Support line B
DISCLAIMER:
Analysis above SOLELY for case study purpose, not a PROFESSIONAL ADVISE. This analysis does not provide any trading advise and buy or sell. Trade at your own risk. Trade only after you have acknowledged and accepted the risks involved.

HSI is looking for reboundIn the pass, I have been bearish for HSI for sometimes, at this moment, HSI might have some rebound before break below the supportive line
aim at rebound targeting 18500-19500

Buying HS50 at current support.HS50 - 22h expiry - We look to Buy at 17450 (stop at 17115)
Buying pressure from 17289 resulted in prices rejecting the dip.
This is positive for sentiment and the uptrend has potential to return.
We therefore, prefer to fade into the dip with a tight stop in anticipation of a move back higher.
Further upside is expected although we prefer to buy into dips close to the 17450 level.
Our profit targets will be 18395 and 18485
Resistance: 18540 / 19480 / 20635
Support: 17605 / 16450 / 14580
Disclaimer – Saxo Bank Group.
Please be reminded – you alone are responsible for your trading – both gains and losses. There is a very high degree of risk involved in trading. The technical analysis , like any and all indicators, strategies, columns, articles and other features accessible on/though this site (including those from Signal Centre) are for informational purposes only and should not be construed as investment advice by you. Such technical analysis are believed to be obtained from sources believed to be reliable, but not warrant their respective completeness or accuracy, or warrant any results from the use of the information. Your use of the technical analysis , as would also your use of any and all mentioned indicators, strategies, columns, articles and all other features, is entirely at your own risk and it is your sole responsibility to evaluate the accuracy, completeness and usefulness (including suitability) of the information. You should assess the risk of any trade with your financial adviser and make your own independent decision(s) regarding any tradable products which may be the subject matter of the technical analysis or any of the said indicators, strategies, columns, articles and all other features.
Please also be reminded that if despite the above, any of the said technical analysis (or any of the said indicators, strategies, columns, articles and other features accessible on/through this site) is found to be advisory or a recommendation; and not merely informational in nature, the same is in any event provided with the intention of being for general circulation and availability only. As such it is not intended to and does not form part of any offer or recommendation directed at you specifically, or have any regard to the investment objectives, financial situation or needs of yourself or any other specific person. Before committing to a trade or investment therefore, please seek advice from a financial or other professional adviser regarding the suitability of the product for you and (where available) read the relevant product offer/description documents, including the risk disclosures. If you do not wish to seek such financial advice, please still exercise your mind and consider carefully whether the product is suitable for you because you alone remain responsible for your trading – both gains and losses.

HSI/SPY - time to be aware of ChinaKeep in mind this is a monthly chart, so we're looking at years and decades here.
This ratio chart of the HANG SENG INDEX divided by SPY is warning of a coming rush by investors into the Chinese markets. The China C wave I posted about may be done (see post attached below). If this falling wedge breaks out we could see a monumental shift towards the Chinese markets in the coming years, possibly spurred by their willingness to relax Covid controls and/or get better vaccines. This is a market mostly ignored by retail investors and that may change soon.
The monthly RSI has sharp bullish divergence. The monthly 18ma is sitting at 51.3 as I type today, getting over and holding that on a monthly close would be very bullish for HSI.
Good luck!

HSI reboundHSI on the weekly chart showed the TD 9 and force 9, the downtrend was in the short term exhausted range, refer to daily chart the energy indicator showed the bottom divergence. HIS index started to rebound from this point.
After the rebound showed the Force 9 at top, the momentum of rebound was used out, so the current market showed the retracement.
Yesterday HSI index show a bottom fractal with gap up, and it is on above green line now, potential the rebound will be continue, to reach the red band resistance level.

HSI: is about 40% upHangseng looks bullish.
There are 2 bull patterns just ended, so it looks about 40% up at least.

HSI bull trap by Cosmic GravityBoth indicators gave mixed signals on the Hang Seng Index 3-day chart so we looked at a higher 1W timeframe for more context. The points outlined in the charts suggest a bearish move and the 3-day chart target is approximated by extrapolating the support channel's bottom. The stop is placed slightly above the support channel (currently the next resistance).

Prepare for 22% RALLY in HSI4th wave pullback(upside) is started in Hongkong index from 1st Nov'22
wait for correction until 14th of Nov, provided 15880 should be protected (SL)
After B wave correction ,if limited to 15880 then buy a ticket after 15th Nov for your upward journey till Jan23

Hang Seng Index under fire!!Watching the Hand Seng underlying index in coming sessions...could be a good selloff on the cards...price action looking weak and there is a lot of buyers that could be put under pressure to unwind long positions!!

Joe Gun2Head Trade - Top pattern on HK50Trade Idea: Selling HK50
Reasoning: Top pattern on HK50
Entry Level: 17641
Take Profit Level: 16980
Stop Loss: 17796
Risk/Reward: 4.25:1
Disclaimer – Signal Centre. Please be reminded – you alone are responsible for your trading – both gains and losses. There is a very high degree of risk involved in trading. The technical analysis , like all indicators, strategies, columns, articles and other features accessible on/though this site is for informational purposes only and should not be construed as investment advice by you. Your use of the technical analysis , as would also your use of all mentioned indicators, strategies, columns, articles and all other features, is entirely at your own risk and it is your sole responsibility to evaluate the accuracy, completeness and usefulness (including suitability) of the information. You should assess the risk of any trade with your financial adviser and make your own independent decision(s) regarding any tradable products which may be the subject matter of the technical analysis or any of the said indicators, strategies, columns, articles and all other features.
