JAPAN225CFD trade ideas

JP225USD Due to the breaking of the last High of the uptrend, the price is in a correction and returns to the previous floor Of course, to enter the selling position, you must enter safely


Nikkei225, Trade and trend ranges [2NOV2021]You can see in my previous plan where signal went extreme bullish.
Japan's economy is different from US. Modelling it quantitatively is also different. It is still seen as bullish by the signal at the moment, and the bullishness in the short and long term yields, I believe Nikkei will make a new ATH soon, but has a massive 3% downside potential too, so it's better not to go into margin with this one and shorting isn't a good idea either. Let's hope for a dip and see if we can get our hands dirty.
PS. Each box span a day, and the code gives short term and long term trends as shown. the trend is shown with the color of the box. The range is calculated on a daily basis.
If you want similar ranges and trends on your ticker, feel free to contact me, I will add them to my list and provide them when the signal is interesting (for free of course)
Redd

Signal - Nikkei - 1 November 21 - Sell The bigger timeframe pattern I see on this structure is a rising wedge.
Going to the smaller timeframe 1m
* I see a double top structure
* Second leg is formed by a rising channel
Going to 15m
* I see double top with the second leg bigger than the first leg
Going to 1H
* I see 1 hour retracement candlestick pattern


JP225USD Short | JP225 Short| JAPAN 225 ShortJP225USD Short Trade Marked On Chart
JAPAN 225 Short Trade Marked On Chart
GOOD RISK TO REWARD TRADE.
PLEASE DO YOUR OWN DUE DILIGENCE AND ANALYSIS, TRADE AT YOUR OWN RISK

Nikkei Analysis 1D | Outlook• Nikki Japan's long-term outlook on daily timeframes •
.
• Friends, remember the numbers listed on the chart, if the price moves to the upper or lower area indicated on the chart, trading positions can be used.
.
• Area 28700 has the highest volume of transactions in the last 10 months, and is an important area! Failure of the price from this area will push the price up or down to the next targets in its direction.

Nikkei 225 Bullish run ahead!!Earlier we have seen breakout from the Bullish flag
Resistance from poles high and now retesting
Follow the fibo levels
Guide = arrows

200 EMA Retest: Long JP225USD (H4)I took a long trade at the break of 200 EMA (candlestick highlighted in black) last week.
The price has come to retest the 200 EMA again. Look for re-entry opportunity.
Buy conditions:
1) All Ichimoku signs are bullish
2) Wait for price to close above Tenkan with a bullish candle for re-entry
3) SSA is making a new high
4) Chikou span > kumo (indicates mid to long term bullish momentum)

JP225 CASH long 5minJP225 CASH long 5min
1:1
Looks good trade.
Lets monitor.
Use Proper risk management.
Disclaimer: only idea, not advice.

nikkei Nice BounceHello Everyone, If You Like The Idea You Can Support With A Like And Comment .
Keep In Mind ❗
🟣 Purple structure -> Higher TimeFrame Structure.
🟢 Green structure -> Daily Structure.
⚫️ Grey structure -> 4h Structure.
🟡 Yellow structure -> <4h Structure.
Important : Please Use RM (Risk Management) and MM (Money Management) If You Decide To Use My Ideas, There Will Always Be Unprofitable Ideas, This Will Definitely Happen, The Goal Of The System Is That There Will Be More Profitable Ideas At A Distance.


Trade Hang Seng at open to move near to other indicesTrade Hang Seng at open to move near to other indices

Pivot Point Swing Trading SystemNikkei225 on the H4 chart giving a new lower high and the weekly range its lower than the previous weekly range. Go short when h4 candle closes.

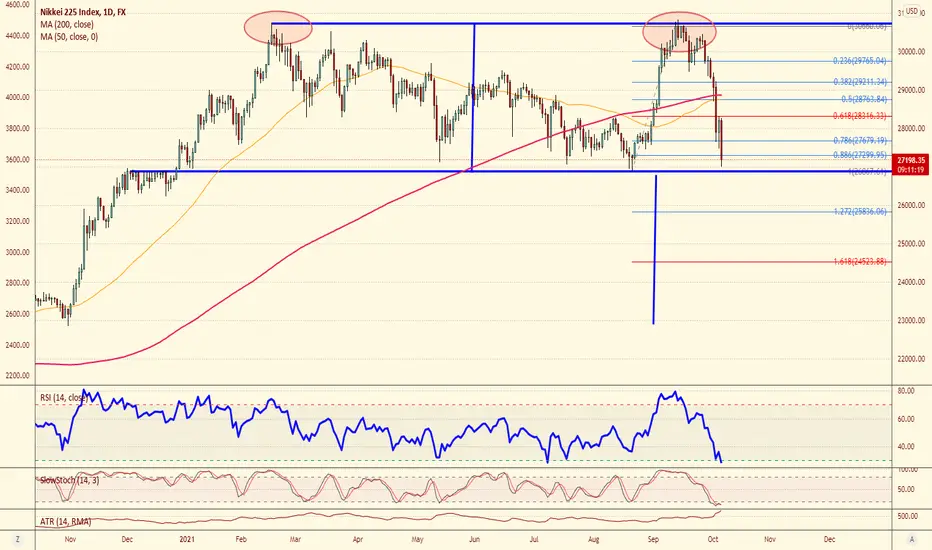
Nikkei swing short: 13th OctoberNikkei may be our canary. Having already rejected the 161 level (See others linked). This already looks really bad for the Japan index - but if we get under the 127 fib this is much more likely to be a market we see bears run wild. The 127 level break would typically have to be a big strong break - rarely do these happen without some fundamental trigger.


NiKKEI 225 (NI225) Potentially nearing '2B' reversal pattern.NiKKEI 225 (NI225) Potentially nearing '2B' reversal pattern.
Once prices breaks down below red line, potential confirmation of '2B' top reversal pattern completion.

Nikkei double top projecting 15% drop in the coming months This double top in the Nikkei would suggest about a -15% drop from current levels if it plays out. Break of the neckline and being long JPY (short XXXJPY) would be a way to play this like short EURJPY or NZDJPY
CTS - J225This analysis is designed to provide information that CTS believes to be accurate on the subject matter, but is shared with the understanding that the author is NOT offering individualized advice tailored to any specific portfolio or the particular needs of any individual.
The author of the analysis specifically disclaims any responsibility for any personal or other loss or risk incurred as a consequence, directly or indirectly, of the use and application of any of the contents of this analysis.


Nikkei225 Immidiate term trend and trade rangesExtreme Bullishness. This is one of those things where I don't believe my code very much.
Currently it shows extreme bullishness taking into account JPY bond prices. I'm afraid I haven't modelled Japanese markets very well.
Although the stochastic volatility suggests it will take few more days to get a clear signal on buy/sell.
But hey, I will learn my lessons with this, I have a portfolio just for the algo generated positons.
So I'm gonna go blind and believe my code and open a long position here.
Thanks for reading
Dhanush
