Plan UK100 22-26/10/2023
Hey guy
Plan UK100 11-15/10/2023
Sell UK100 7538.83
STOPLOSS AND TP as picture .
R:R 1:8
Good lucky everybody
--------------------------------
Best regards.
UK100CFD trade ideas

FTSE Elliott Wave Analysis for Friday 20/10/2023 (+ Higher TF)The higher timeframe gives us two equally valid scenarios. On the lower timeframe, it looks like wave X is finished and that we are working on wave Y as an ABC up.

UK100GBP support has been clearly broken.UK100 - 24h expiry
Short-term bias has turned negative.
Our bespoke support of 7600 has been clearly broken.
Previous support at 7610 now becomes resistance.
Short-term momentum is bearish.
Posted a Double Top formation.
50 4-hour EMA is at 7608.
We look to Sell at 7609 (stop at 7659)
Our profit targets will be 7484 and 7454
Resistance: 7590 / 7610 / 7650
Support: 7540 / 7490 / 7460
Risk Disclaimer
The trade ideas beyond this page are for informational purposes only and do not constitute investment advice or a solicitation to trade. This information is provided by Signal Centre, a third-party unaffiliated with OANDA, and is intended for general circulation only. OANDA does not guarantee the accuracy of this information and assumes no responsibilities for the information provided by the third party. The information does not take into account the specific investment objectives, financial situation, or particular needs of any particular person. You should take into account your specific investment objectives, financial situation, and particular needs before making a commitment to trade, including seeking advice from an independent financial adviser regarding the suitability of the investment, under a separate engagement, as you deem fit.
You accept that you assume all risks in independently viewing the contents and selecting a chosen strategy.
Where the research is distributed in Singapore to a person who is not an Accredited Investor, Expert Investor or an Institutional Investor, Oanda Asia Pacific Pte Ltd (“OAP“) accepts legal responsibility for the contents of the report to such persons only to the extent required by law. Singapore customers should contact OAP at 6579 8289 for matters arising from, or in connection with, the information/research distributed.

FTSE Elliott Wave Analysis for Thursday 19/10/2023The higher timeframe gives us two equally valid scenarios. On the lower timeframe, it looks like wave X is finished and that we are working on wave Y as an ABC up.


FTSE Elliott Wave Analysis for Wednesday 18/10/2023The higher timeframe gives us two equally valid scenarios. On the lower timeframe, it looks like wave X is finished and that we are working on wave Y as an ABC up.

UK100 D1 - Short from 7720UK100 D1
Lots of big daily timeframes here, swing positions are certainly looking attractive across and commodities, indices and FX.
7720 is our anticipated sell zone.

FTSE Elliott Wave Analysis for Tuesday 17/10/2023The higher timeframe gives us two equally valid scenarios. On the lower timeframe, it looks like wave X is finished and that we are working on wave Y as an ABC up.

UK 100 Depicting Weakness. Let's SHORT SELLUK 100 index has shown weakness on hourly chart this is further augmented by the Divergence on RSI indicator. To milk the opportunity a trade plan has been devised. So you may utilize the opportunity.

uk100 sell trade
- The UK economy is weighed down by the weak UK economic data, the dovish Bank of England (BOE), and the political and fiscal risks in the region. The UK inflation remains well above the BOE's target of 2%, while the growth outlook is clouded by the Covid-19 variants, the energy crisis, and the supply chain disruptions. The BOE is expected to maintain its ultra-loose monetary policy and its massive asset purchase program for longer, which would weaken the pound and reduce its yield advantage over other currencies.
- The US Dollar is boosted by the robust US economic data, the hawkish Federal Reserve, and the safe-haven demand amid the global uncertainty. The US inflation remains elevated at 3.7% year-on-year in September, while the growth outlook is supported by the fiscal stimulus, the vaccination progress, and the consumer spending. The Federal Reserve is expected to start tapering its quantitative easing program and raise interest rates sooner than previously anticipated, which would strengthen the dollar and increase its yield advantage over other currencies.

FTSE Elliott Wave Analysis for Monday 16/10/2023 (+ Higher TF)The higher timeframe gives us two equally valid scenarios. On the lower timeframe, it looks like wave X is finished and that we are working on wave Y as an ABC up.

UK300GBPThere is a head and shoulder pattern likely to form. I am waiting for the price to break out at the support zone, then retest it so that we can have a go ahead to place our position.
I anticipate that the price might continue with the bearish momentum.
My intended entry point is 7600, SL at 7630 and TP at 7500, thus R:R is 1:3.

FTSE Elliott Wave Analysis for Friday 13/10/2023The higher timeframe gives us two equally valid scenarios. On the lower timeframe, it looks like wave X is finished and that we are working on wave Y.

FTSE Elliott Wave Analysis for Thursday 12/10/2023The higher timeframe gives us two equally valid scenarios. On the lower timeframe, it looks like wave X is finished and that we are working on wave Y.

UK100 Index Long Trading SignalUK100 Index Long Trading Opportunity
1. The price closed above the Trend Magic Indicator line. Strong long signal.
3. Vortex will cross and indicates strong uptrend signal.
4. Retail trader data shows 64% of traders are net-short. Strong contrarian long signal.
SL - below the Trend Magic Indicator line or Vortex indicator change trend direction signal
TP1- 7750
TP2 - 7920
Keep It Simple and Always Trade With the Trend!
Please, Support Our Work with Like & Comment! Thank You!

Plan UK100 11-15/10/2023Hey guy
Plan UK100 11-15/10/2023
Sell UK100 7639.15
STOPLOSS AND TP as picture .
R:R 1:6
Good lucky everybody
--------------------------------
Best regards.

UK100 H4 | Heading into 50% FiboUK100 is rising towards an overlap resistance and could potentially reverse off this level to drop lower.
Sell entry is at 7551.55 which is an overlap resistance that aligns close to the 50.0% Fibonacci retracement level.
Stop loss is at 7592.01 which is a level that sits above the 61.8% Fibonacci retracement level.
Take profit is at 7465.61 which is a pullback support level.
High Risk Investment Warning
Trading Forex/CFDs on margin carries a high level of risk and may not be suitable for all investors. Leverage can work against you.
Forex Capital Markets Limited (www.fxcm.com):
CFDs are complex instruments and come with a high risk of losing money rapidly due to leverage. 70% of retail investor accounts lose money when trading CFDs with this provider. You should consider whether you understand how CFDs work and whether you can afford to take the high risk of losing your money.
Stratos Europe Ltd, previously FXCM EU Ltd (www.fxcm.com):
CFDs are complex instruments and come with a high risk of losing money rapidly due to leverage. 74% of retail investor accounts lose money when trading CFDs with this provider. You should consider whether you understand how CFDs work and whether you can afford to take the high risk of losing your money.
FXCM Australia Pty. Limited (www.fxcm.com):
Trading FX/CFDs carries significant risks. FXCM AU (AFSL 309763), please read the Financial Services Guide, Product Disclosure Statement, Target Market Determination and Terms of Business at www.fxcm.com
Stratos Global LLC (www.fxcm.com):
Losses can exceed deposits.
Please be advised that the information presented on TradingView is provided to FXCM (‘Company’, ‘we’) by a third-party provider (‘TFA Global Pte Ltd’). Please be reminded that you are solely responsible for the trading decisions on your account. There is a very high degree of risk involved in trading. Any information and/or content is intended entirely for research, educational and informational purposes only and does not constitute investment or consultation advice or investment strategy. The information is not tailored to the investment needs of any specific person and therefore does not involve a consideration of any of the investment objectives, financial situation or needs of any viewer that may receive it. Kindly also note that past performance is not a reliable indicator of future results. Actual results may differ materially from those anticipated in forward-looking or past performance statements. We assume no liability as to the accuracy or completeness of any of the information and/or content provided herein and the Company cannot be held responsible for any omission, mistake nor for any loss or damage including without limitation to any loss of profit which may arise from reliance on any information supplied by TFA Global Pte Ltd.
The speaker(s) is neither an employee, agent nor representative of FXCM and is therefore acting independently. The opinions given are their own, constitute general market commentary, and do not constitute the opinion or advice of FXCM or any form of personal or investment advice. FXCM neither endorses nor guarantees offerings of third party speakers, nor is FXCM responsible for the content, veracity or opinions of third-party speakers, presenters or participants.

FTSE Elliott Wave Analysis for Wednesday 11/10/2023The higher timeframe gives us two equally valid scenarios. On the lower timeframe, it looks like wave X is finished and that we are working on wave Y.

UK100 BULISH IDEAUK100 is getting ready for agin big bull run just go with proper confirmation . good luck

Is the FTSE100 setting itself for a rally?Triple Bottom seems to be forming on FTSE100...
Could it be showing signs that it wants to rally for the rest of the year?
If so, we need to wait for the price to close above the neckline before acting.
Other indicaators also show it's too early, but things can change. So we'll keep our eyes peeled.
Price <200 (Bearish)
21>7 (Bearish)
RSI<50
Target 8,280

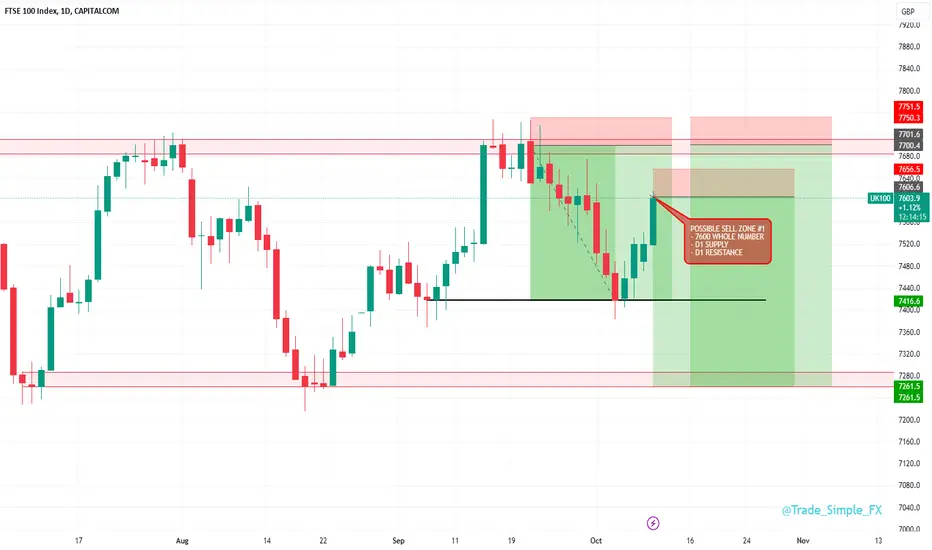
UK100 D1 - Short SetupUK100 D1
Little reluctant with stock indices for the moment, but certainly going to push a few forecasts out. 7600 sell zone looks attractive on the basis of this 7600 psychological price, daily resistance and daily supply price.
We could start to see rejections here, failing this, a break upside could lead us to 7700. Another attractive sell zone, which measures 9R from 7700 to 7260.
Has UK100 turned positive?UK100 - 24h expiry
There is no indication that the rally is coming to an end.
Further upside is expected.
Risk/Reward would be poor to call a buy from current levels.
A move through 7550 will confirm the bullish momentum.
The measured move target is 7650.
We look to Buy at 7500 (stop at 7450)
Our profit targets will be 7620 and 7650
Resistance: 7550 / 7600 / 7650
Support: 7525 / 7500 / 7450
Risk Disclaimer
The trade ideas beyond this page are for informational purposes only and do not constitute investment advice or a solicitation to trade. This information is provided by Signal Centre, a third-party unaffiliated with OANDA, and is intended for general circulation only. OANDA does not guarantee the accuracy of this information and assumes no responsibilities for the information provided by the third party. The information does not take into account the specific investment objectives, financial situation, or particular needs of any particular person. You should take into account your specific investment objectives, financial situation, and particular needs before making a commitment to trade, including seeking advice from an independent financial adviser regarding the suitability of the investment, under a separate engagement, as you deem fit.
You accept that you assume all risks in independently viewing the contents and selecting a chosen strategy.
Where the research is distributed in Singapore to a person who is not an Accredited Investor, Expert Investor or an Institutional Investor, Oanda Asia Pacific Pte Ltd (“OAP“) accepts legal responsibility for the contents of the report to such persons only to the extent required by law. Singapore customers should contact OAP at 6579 8289 for matters arising from, or in connection with, the information/research distributed.

FTSE Elliott Wave Analysis for Tuesday 10/10/2023The higher timeframe gives us two equally valid scenarios. On the lower timeframe, it looks like wave X is finished. However, as long as we see too much overlap in the upward move, we cannot exclude the secondary scenario. The secondary scenario calls for two more swings as a wave (b) and (c).
