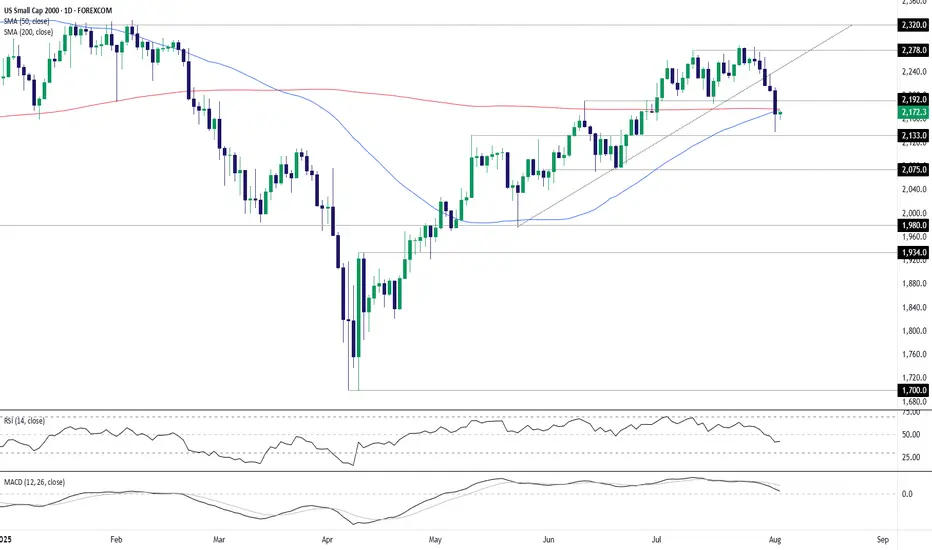
Small Caps: Rebound or rollover at 200DMA?Near-term price action in U.S. small-cap stocks may be instructive for assessing longer-term directional risks, with the contract trading near the key 200-day simple moving average.
Despite breaking uptrend support and extending the bearish move late last week, buying dips remains the preferred str
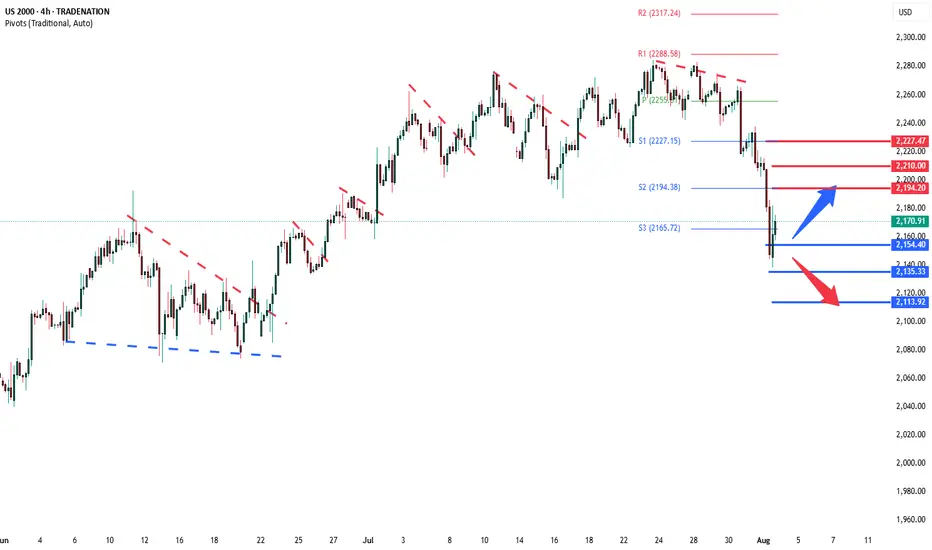
Russell2000 Key Trading levelsKey Support and Resistance Levels
Resistance Level 1: 2194
Resistance Level 2: 2210
Resistance Level 3: 2227
Support Level 1: 2154
Support Level 2: 2135
Support Level 3: 2113
This communication is for informational purposes only and should not be viewed as any form of recommendation as to a p
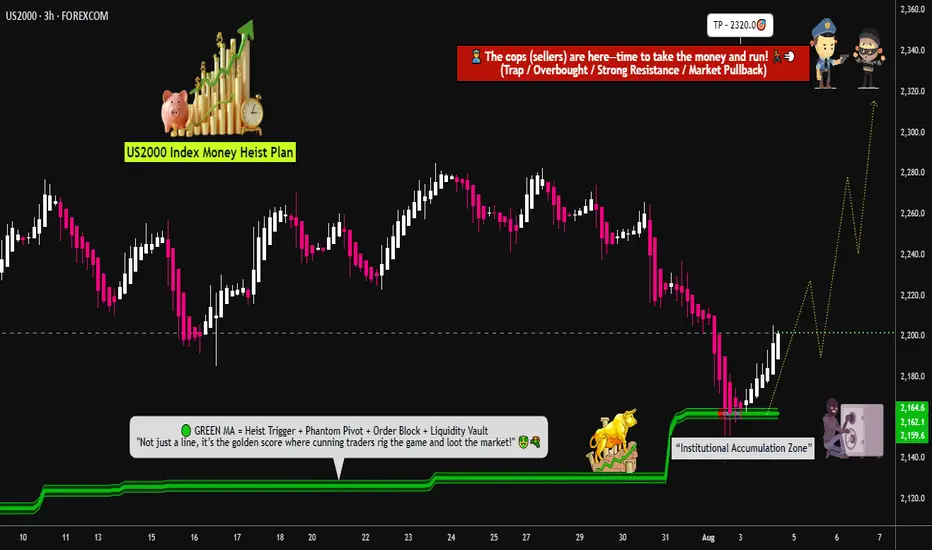
"US2000 THIEF TRADE: SWIPE & ESCAPE BEFORE BEARS!"🚨Russell 2000 Robbery: Pullback to Power Play⚡️💰
🌟Hi! Hola! Ola! Bonjour! Hallo! Marhaba!🌟
Dear Market Robbers & Money Makers, 🤑💰💸✈️
This is a full-blown heist plan on the US2000 (Russell 2000) index using the Thief Trading Style™, a perfect combo of real-time technicals + macro heat.
Get ready to
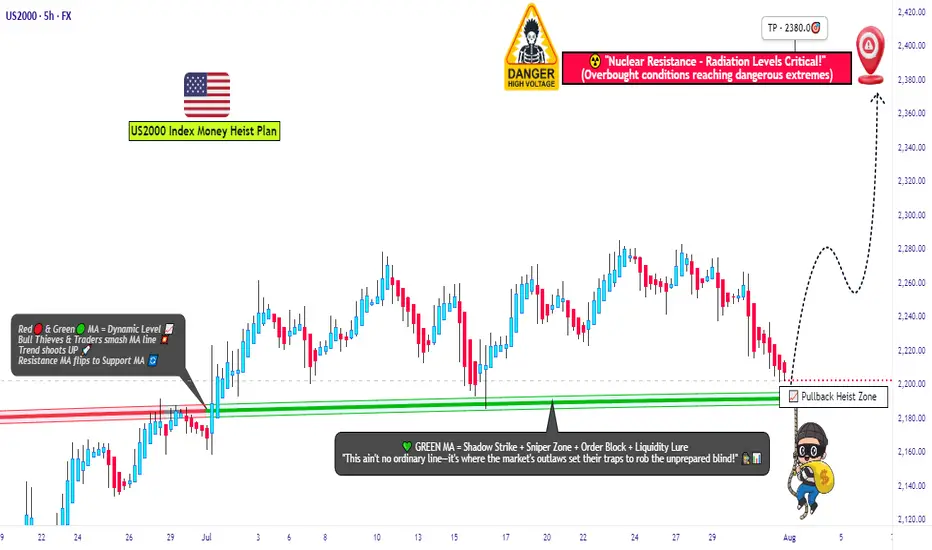
Russell 2000 Bullish Attack – Vault Break-In Loading🚨US2000 / Russell 2000 Heist Plan – Bullish Loot Incoming!🚨
🤑 Dear Robbers of the Market Vault,
The Russell 2000 is showing cracks in the bear walls—time for a bold bullish break-in! 🔓📈
The Thief has eyes everywhere, and right now, the loot sits between 2140.0 & 2320.0. Let's steal it!
📌 Asset: US
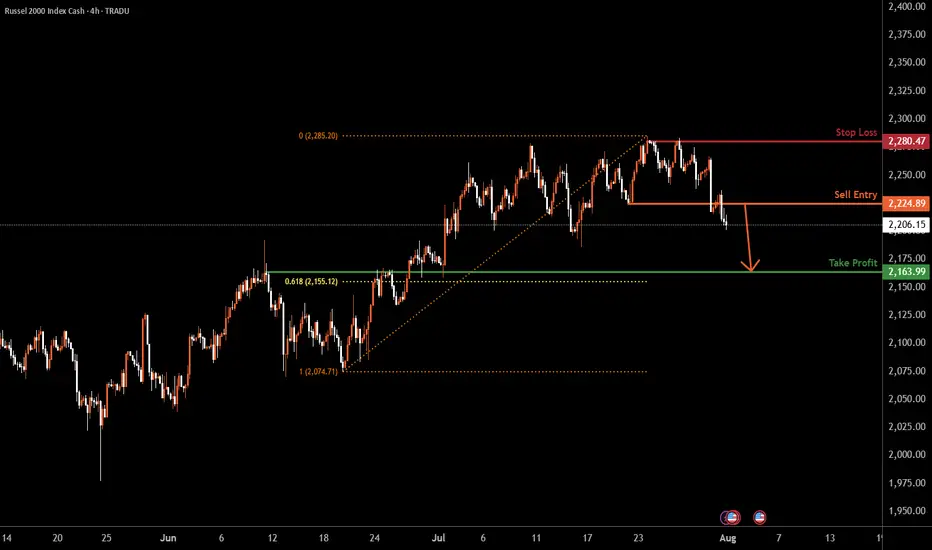
US2000 H4 | Bearish dropBased on the H4 chart analysis, we could see the price drop lower from the sell entry to the downside.
Sell entry is at 2,224.89, which is a pullback resistance.
Stop loss is at 2,280.47, a swing high resistance.
Take profit is at 2,163.99, which is an overlap support that is slightly above the 6
RUT Echoes IWM – The Livermore Playbook?The Russell 2000 (RUT) is painting a structure that mirrors the IWM ETF – a widening accumulation channel, setting up for a potential breakout. The VolanX protocol flags this as a classic Livermore Speculative Chart pattern, where phases of quiet accumulation lead to an explosive markup.
Channel Su

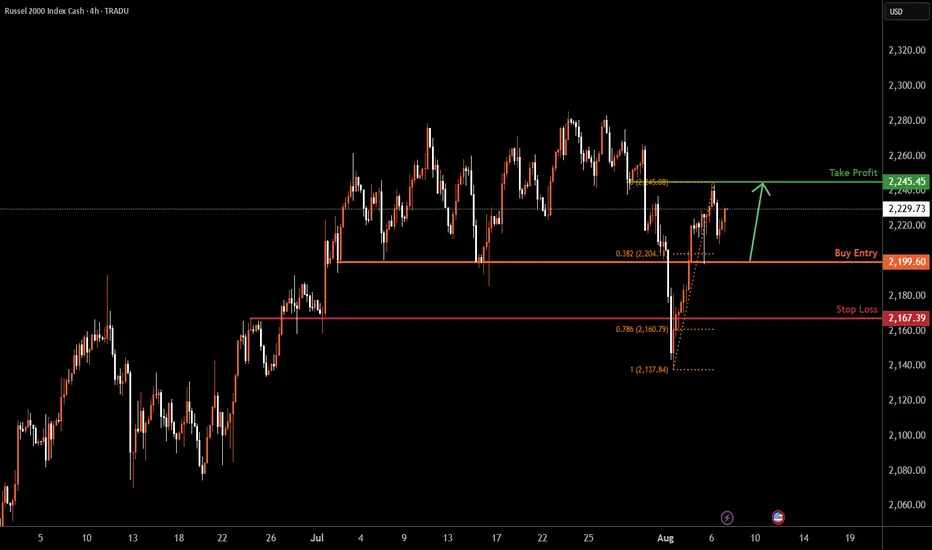
US2000 H4 | Bullish bounce offBased on the H4 chart analysis, we could see the price fall towards the buy entry which is a pullback support and could bounce to the take profit.
Buy entry is at 2,199.60, which is a pullback support that is slightly below the 38.2% Fibonacci retracement.
Stop loss is at 2,167.39, which is a pull
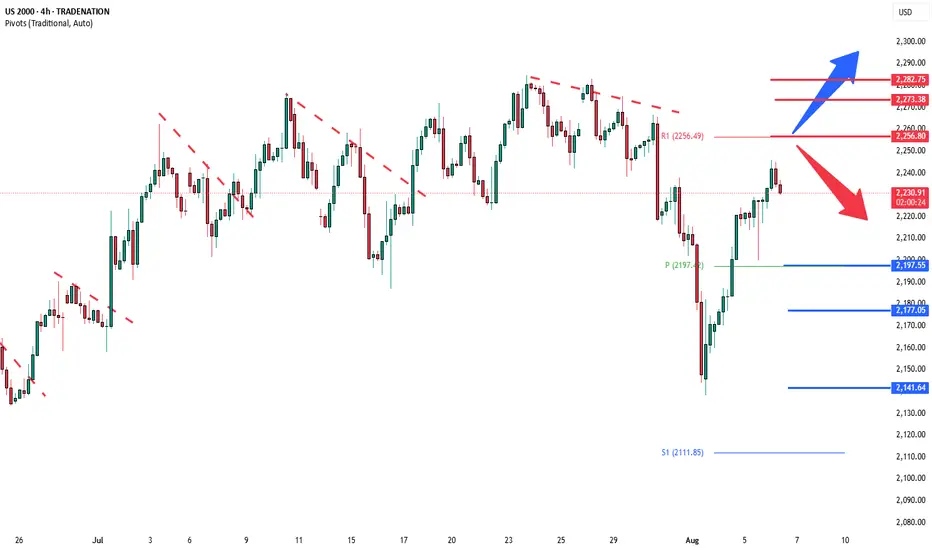
Russell2000 Key Trading LevelsKey Support and Resistance Levels
Resistance Level 1: 2256
Resistance Level 2: 2273
Resistance Level 3: 2282
Support Level 1: 2200
Support Level 2: 2177
Support Level 3: 2140
This communication is for informational purposes only and should not be viewed as any form of recommendation as to a p
Russell2000 Key Trading LevelsKey Support and Resistance Levels
Resistance Level 1: 2194
Resistance Level 2: 2210
Resistance Level 3: 2227
Support Level 1: 2154
Support Level 2: 2135
Support Level 3: 2113
This communication is for informational purposes only and should not be viewed as any form of recommendation as to a p

See all ideas
Displays a symbol's price movements over previous years to identify recurring trends.
Frequently Asked Questions
US Small Cap 2000 CFD reached its highest quote on Nov 25, 2024 — 2,468.6 USD. See more data on the US Small Cap 2000 CFD chart.
The lowest ever quote of US Small Cap 2000 CFD is 938.6 USD. It was reached on Feb 11, 2016. See more data on the US Small Cap 2000 CFD chart.
US Small Cap 2000 CFD is just a number that lets you track performance of the instruments comprising the index, so you can't invest in it directly. But you can buy US Small Cap 2000 CFD futures or funds or invest in its components.