US30 hey everyone lets congratulate lord that even i said from 44500-44600 will give pullback, he said will be sold today. At least one to 6 times he get the right one, even the pullback before two hours he didnt get it righ, you are forgiven lord, at least you are funny guy
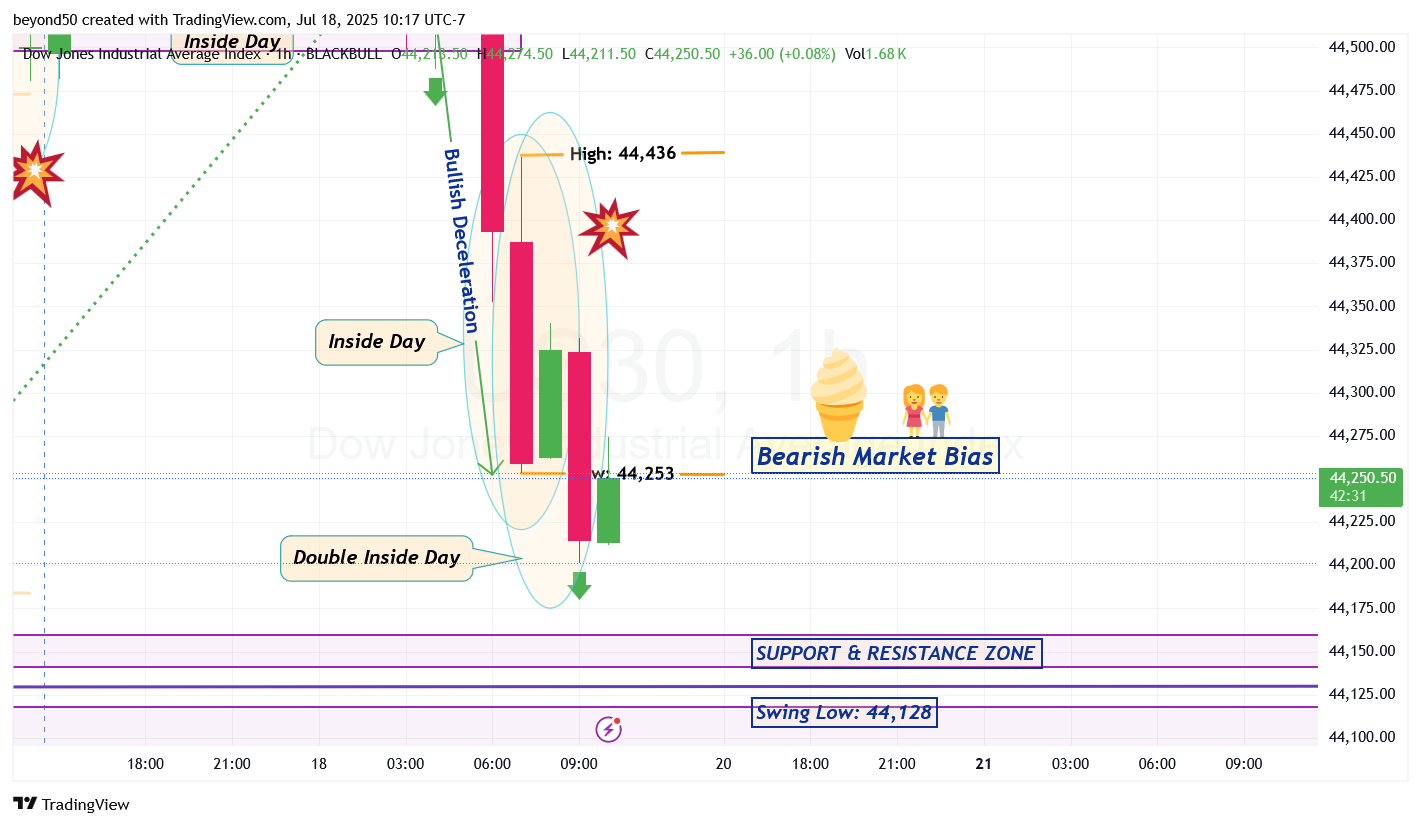
US30 We've got a fake breakout from the Inside Day's low at 44,253 on the Hourly (shown as an orange line). The bears tried to drop down, but the bulls countered that move to go back into the pattern.
Watch to see if the bulls can reach 44,436 for a true breakout at the high of the Inside Day (shown as an orange line). If that doesn't happen, back down again for a 2nd attempt at a breakout of the pattern's low of 44,253.
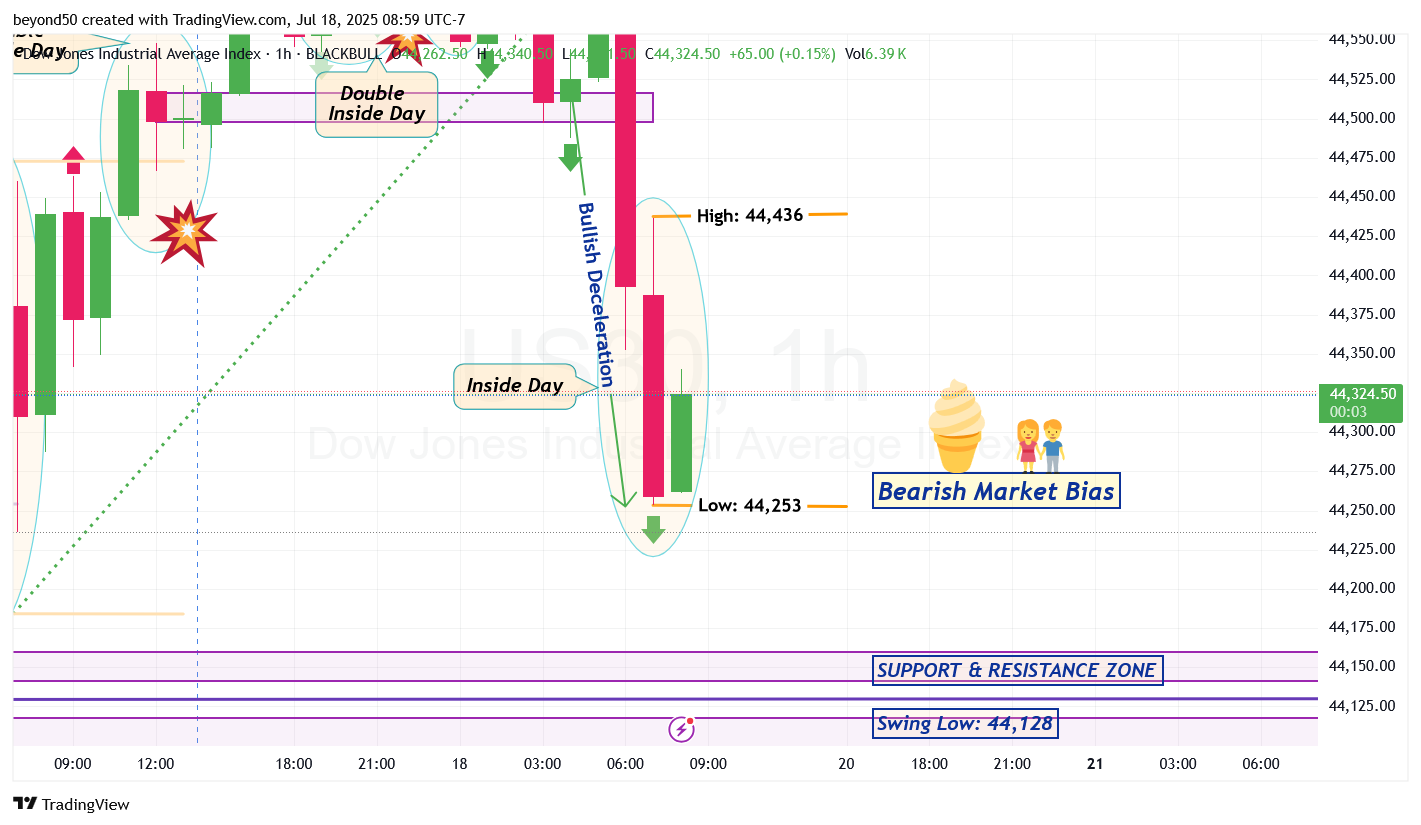
US30 The Hourly is in a market pause with the formation of an Inside Day pattern. This is typical, after a major move to the downside. The market is tired from it.
So with an Inside Day pattern, the candles can consolidate with no true direction until a breakout at either its high of 44,436 or low of 44,253 (shown as two orange lines). Let's see what the true direction will be.
My suspicion is that a giant W-shaped pattern is starting to form that happens usually around a Pivot Low.