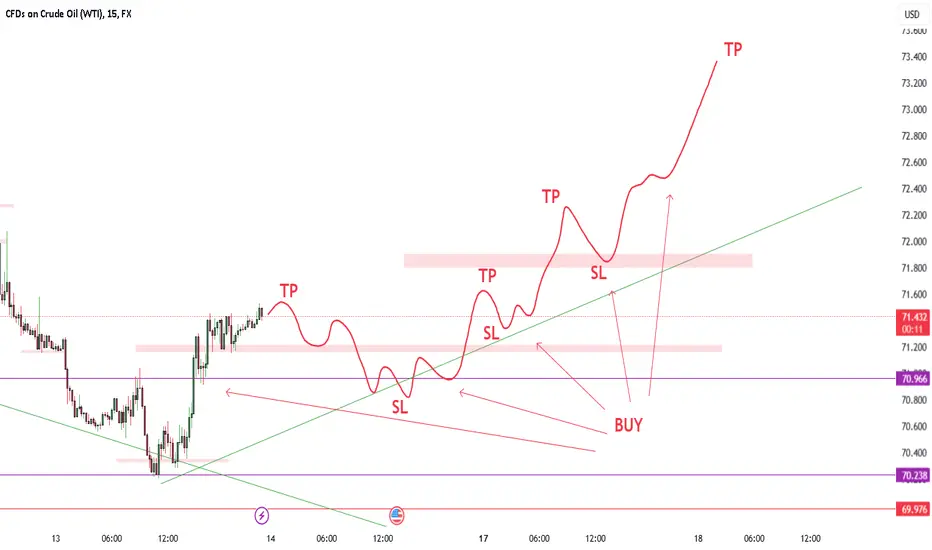
Buying oil after a failureKeep an eye on the trend line. If it breaks, a buy confirmation will be issued.
CL-OIL trade ideas

Oil price rises according to analysisYesterday I told you that if the downtrend line is broken, it could have a good rally, and it has gained more than 100 pips since yesterday.

Oil projectionCurrently on TF4 shows consolidation to form an equilateral triangle, waiting for confirmation of break 2 candles with closure above the triangle line.
Scenario 1 : if it breaks up, you can buy with TP target
Scenario 2 : if it breaks through the bottom you can sell with the TP target

USOIL Price Forecast – Double Bottom Breakout AheadThe market is forming a Double Bottom pattern, signaling a potential bullish reversal. Wait for a breakout above the neckline with a strong bullish candle to confirm the move! 🔥
📊 Technical Analysis
✅ 💹 Double Bottom Pattern – A strong reversal setup
✅ 📈 Breakout Confirmation – Look for a big bullish candle above the neckline
✅ 🔎 Trend Shift – Potential move toward higher resistance levels
🎯 Target Levels:
📌 76.00 – First bullish target
📌 78.50 – Extended target for further upside
📢 Trading Strategy:
🔹 Wait for a confirmed breakout above the neckline
🔹 Ensure strong buying momentum before entering
🔹 Follow the trend and manage risk with a stop-loss below the neckline
📈 The market is setting up for a strong bullish move—stay patient and capitalize! 🚀
📌 Like, comment & follow for more trading updates! 🔔🔥

WTICOBeautiful trade on oil in which I manually closed for around +6% profit. Will be looking for more potential entries to the downside if presented but there are other pairs on watch.

Oil - Let's see if it worksHello traders, please feel free to share your trading ideas, and please give a Boost if you agree with my trading plan. My trading strategy is Price Action, which is the simplest strategy of trading on the price movement. A key part of my discipline is Stop Loss set when opening a trading position, which ensures every trading is risk managed. My 1 to 1 trading training is available, please message. Trade well and good luck!
USOIL Potential UpsidesHey Traders, in today's trading session we are monitoring USOIL for a buying opportunity around 68.80 zone, USOIL is trading in an uptrend and currently is in a correction phase in which it is approaching the trend at 68.80 support and resistance area.
Trade safe, Joe.

WTI Oil Short: Bearish Setup After Sharp RallyOil prices have surged impressively, fueled by recent fundamental-driven market moves. However, this swift upside has led WTI crude to my point of interest, offering a prime opportunity to short against the trend. My trade strategy includes taking partials at the $74 price zone. Here’s why this setup is supported by bearish fundamentals:
1. Rising U.S. Fuel Inventories
Recent data shows significant growth in U.S. gasoline and distillate stockpiles, hinting at a potential oversupply in the market.
2. Strengthening U.S. Dollar
A stronger dollar makes oil more expensive for holders of other currencies, reducing global demand and weighing on prices.
3. Increased Non-OPEC Supply
With rising production levels from non-OPEC countries, analysts expect an oversupplied market in 2025, adding further pressure on oil prices.
4. Weakening Global Demand
Economic growth concerns in major markets like China and Germany are fostering expectations of reduced oil demand, reinforcing a bearish outlook.
These combined factors strongly support a short position on WTI crude oil. Stay strategic, take profits along the way, and manage your risk carefully in this volatile environment!
Note: Please remember to adjust this trade idea according to your individual trading conditions, including position size, broker-specific price variations, and any relevant external factors. Every trader’s situation is unique, so it’s crucial to tailor your approach to your own risk tolerance and market environment.

CRUDE OIL (WTI): Classic Smc Trade?!
I see a confirmed bearish trap after a test of a key support
on WTI Oil on a 4h time frame.
A formation of a bullish imbalance indicates a highly
probable movement higher.
Goal - 72.0
❤️Please, support my work with like, thank you!❤️

WTIhello trader, today the price drop back to main support and we see 4hr bullish candle.. the price will likely reverse but regardless use proper risk management as suggested on the chart... the target level is the resistances as shown.. the price will likely make higher highs based on trend changing...
good luck..

USOIL Will Go Lower! Sell!
Please, check our technical outlook for USOIL.
Time Frame: 9h
Current Trend: Bearish
Sentiment: Overbought (based on 7-period RSI)
Forecast: Bearish
The market is on a crucial zone of supply 73.038.
The above-mentioned technicals clearly indicate the dominance of sellers on the market. I recommend shorting the instrument, aiming at 70.781 level.
P.S
Please, note that an oversold/overbought condition can last for a long time, and therefore being oversold/overbought doesn't mean a price rally will come soon, or at all.
Like and subscribe and comment my ideas if you enjoy them!

Oil price drop as expectedYesterday I told you that the trend line was broken and it could fall.
Since I said it was down 250 pips, it's over a 3% drop.

WTICOUSD LONG TERM PREDICITIONBasically, this setup is from a monthly timeframe. I usually look for the trend first before entering. So, my analysis indicates a long-term buy, with many strong resistance levels that make it difficult for the price to break through. That’s all, thank you, let the market take its time to rise. :) TYOR (trust your own research/risk).

Buy Opportunity📢 WTI Crude Oil (USOIL) Trade Signal - Long Setup 🚀
📈 BUY WTI Crude Oil @ 70.79
🎯 Target: 75.12 (+6.11%)
🛑 Stop Loss: 69.74 (-1.41%)
⚖️ Risk/Reward Ratio: 4.41
⏳ Estimated Duration: 6 Days 4 Hours
🔹 Analysis:
Support Zones: 70.37 → 69.74 → 66.59
Resistance Zones: 72.26 → 73.31 → 75.13
Volume Profile: Strong demand at 70.00 region
Price Rejection at Support with Bullish Potential
📊 Trade Rationale:
Price reacting at key support level, potential bullish reversal
High risk/reward setup (4.41) makes this trade attractive
Short-term bullish momentum targeting 75.12
🚨 Caution: If price breaks below 69.74, consider invalidation of the setup.

WTI Oil H4 | Potential bullish reversalWTI oil (USOIL) is falling towards an overlap support and could potentially bounce off this level to climb higher.
Buy entry is at 70.40 which is an overlap support.
Stop loss is at 69.20 which is a level that lies underneath a swing-low support that aligns close to the 127.2% Fibonacci extension.
Take profit is at 73.32 which is a swing-high resistance.
High Risk Investment Warning
Trading Forex/CFDs on margin carries a high level of risk and may not be suitable for all investors. Leverage can work against you.
Stratos Markets Limited (www.fxcm.com):
CFDs are complex instruments and come with a high risk of losing money rapidly due to leverage. 63% of retail investor accounts lose money when trading CFDs with this provider. You should consider whether you understand how CFDs work and whether you can afford to take the high risk of losing your money.
Stratos Europe Ltd (www.fxcm.com):
CFDs are complex instruments and come with a high risk of losing money rapidly due to leverage. 63% of retail investor accounts lose money when trading CFDs with this provider. You should consider whether you understand how CFDs work and whether you can afford to take the high risk of losing your money.
Stratos Trading Pty. Limited (www.fxcm.com):
Trading FX/CFDs carries significant risks. FXCM AU (AFSL 309763), please read the Financial Services Guide, Product Disclosure Statement, Target Market Determination and Terms of Business at www.fxcm.com
Stratos Global LLC (www.fxcm.com):
Losses can exceed deposits.
Please be advised that the information presented on TradingView is provided to FXCM (‘Company’, ‘we’) by a third-party provider (‘TFA Global Pte Ltd’). Please be reminded that you are solely responsible for the trading decisions on your account. There is a very high degree of risk involved in trading. Any information and/or content is intended entirely for research, educational and informational purposes only and does not constitute investment or consultation advice or investment strategy. The information is not tailored to the investment needs of any specific person and therefore does not involve a consideration of any of the investment objectives, financial situation or needs of any viewer that may receive it. Kindly also note that past performance is not a reliable indicator of future results. Actual results may differ materially from those anticipated in forward-looking or past performance statements. We assume no liability as to the accuracy or completeness of any of the information and/or content provided herein and the Company cannot be held responsible for any omission, mistake nor for any loss or damage including without limitation to any loss of profit which may arise from reliance on any information supplied by TFA Global Pte Ltd.
The speaker(s) is neither an employee, agent nor representative of FXCM and is therefore acting independently. The opinions given are their own, constitute general market commentary, and do not constitute the opinion or advice of FXCM or any form of personal or investment advice. FXCM neither endorses nor guarantees offerings of third-party speakers, nor is FXCM responsible for the content, veracity or opinions of third-party speakers, presenters or participants.

Hellena | Oil (4H): SHORT to the 70.00 support area.Colleagues, the situation is quite complicated, so I assume that the price is in a combined correction. At the moment I expect the completion of wave “B” in the 77.00 area, then the completion of wave “C” in the 70.00 support area.
Complex compound corrections are always quite unpredictable, so I recommend not to forget about SL and lot calculation.
Manage your capital correctly and competently! Only enter trades based on reliable patterns!

Oil updateNot much to update on oil as its doing exactly what it was setting up for in January.
I have a swing trade from the high, one of my targets should be reached by the end of this month. When price reaches my targets and a long set up appears I will take it.
for now I'm just riding my shorts.
All these levels I marked out in December and broke this move down. Price has been respecting all my levels for a month, I'm locked in. There is a lot of potential for a further decline in oil prices but ill attend to it when it gets there.
I have a lot of trades running that I don't post. There is a lot more detail and understanding of price action that goes into catching these pinpoint entries. my work speaks for itself, its less about profit and more about understanding price action. The profits will follow with good trade management.
let's see how it goes.

USOIL USOIL is showing a potential sell opportunity following a breakout of the upward trend on the 30-minute timeframe. This signals a possible shift in momentum toward the downside.
Trade Setup:
🔻 Sell Entry Zone: 73.000 – 73.300
🔻 Resistance Level: 73.700 (Key level to watch for invalidation)
Target Levels:
✅ Target 1: 72.300
✅ Target 2: 71.670
✅ Target 3: 70.780
If price respects the resistance zone and fails to break above 73.700, we could see a continuation to the downside toward the listed targets. Confirmation from price action will strengthen the setup before executing trades.

USOIL NEXT MOVESell after bearish candle stick pattern, buy after bullish candle stick pattern....
Best bullish pattern , engulfing candle or green hammer
Best bearish pattern , engulfing candle or red shooting star
NOTE: IF YOU CAN'T SEE ANY OF TOP PATTERN IN THE ZONE DO NOT ENTER
Stop lost before pattern
R/R %1/%3
Trade in 5 Min Timeframe, use signals for scalping

USOIL ..in the 1hr time-frame usoil was berish but late in the day there was a swift CHOCH to the upside in the 1hr time-frame. Expert a temporary bullish move. The move is temporary given that daily supply zone lies above the price.

WTI Crude Oil (USOIL) Daily Chart AnalysisCurrent Price: $71.16 (-2.70%)
Timeframe: Daily (1D)
1. Trend Analysis (Bearish Bias)
The price is in a downtrend, as shown by the descending green trendline.
Lower highs and lower lows indicate continued bearish momentum.
The price recently rejected the upper trendline, reinforcing the downtrend.
2. Key Support and Resistance Levels
Resistance Zone: $72.50 - $73.00 (Previous structure resistance).
Minor Support: Around $70.00.
Major Support Zone: $65.00 - $66.00 (Highlighted pink area).
3. Price Action & Market Structure
The recent price action shows rejection from resistance and a bearish engulfing candle, signaling more downside pressure.
A break below $70.00 could confirm further selling toward the $65.00-$66.00 support.
If the price bounces at $65.00, it could trigger a reversal or consolidation.
4. Trading Strategy
Bearish Setup:
Short below $70.00 with a target of $65.50-$66.00.
Stop-loss around $72.50 (previous resistance).
Bullish Reversal:
If price breaks above $73.00, consider a long position with a target of $75.00-$77.00.
Conclusion
The market is in a clear downtrend, and the price is approaching a key support area. A breakdown below $70.00 could lead to further downside, while a strong bounce from $65.00 may provide a bullish reversal opportunity.
Would you like additional indicators like RSI, MACD, or volume analysis?

2 Tale of Commodities: US Crude $USOIL and $COPPERUS Crude Oil is stuck in a long consolidation pattern with the price stuck between 85 $ and 65 $. With Crude Oil unable to break the sideways consolidation pattern Dr Copper is making new highs in a recent month. On the weekly price chart of the world’s most traded commodity i.e. Crude Oil where we see a consolidation for more than 12 months. With new US administration the Crude output is estimated to go up, which will put downward pressure on the Crude Prices $USOIL. TVC:USOIL prices will most probably remain range bound within the 0.612 and 0.5 Fib retracement levels with prices ranging between 80 $ and 65 $.
But we see the prices of Dr. Copper remain in a bullish trend over the last 5 years. At a Macroeconomic level CAPITALCOM:COPPER prices are a leading indicator of the strength of the economy. With Stock market index making new highs across markets CSEMA:S&P , IG:NASDAQ , TVC:DEU40 and macro economy doing well, CAPITALCOM:COPPER prices are expected to remain strong.
So Long CAPITALCOM:COPPER , neutral $USOIL.

Oil RetreatsOil prices experienced a significant decline after three consecutive days of gains. West Texas Intermediate (WTI) recorded its biggest drop since January, falling approximately 2.5%, partially affected by the latest report from the U.S. Energy Information Administration (EIA). The report revealed an unexpected increase in U.S. crude inventories of 4.1 million barrels, bringing stockpiles to 427.9 million barrels. This buildup comes immediately after last week’s report showed the largest inventory surge since February 2024, with an additional 8.6 million barrels.
These figures suggest that supply is outpacing demand in the short term, exerting downward pressure on prices. Meanwhile, the decrease in gasoline inventories—down by 3.0 million barrels—and distillate products has provided slight support to the market, partially offsetting the negative effect of rising crude stockpiles. However, there was also a sharp drop in oil imports, which fell to 6.3 million barrels per day, down 606,000 from the previous week. If this trend continues, oil-exporting countries like Colombia could face challenges due to weaker external demand.
Beyond supply and demand dynamics, the inflationary outlook in the U.S. has also influenced market sentiment. Higher-than-expected inflation data reinforce expectations of a more aggressive stance from the Federal Reserve, which could keep borrowing costs elevated and put additional pressure on dollar-denominated commodities. Additionally, recent remarks from President Donald Trump regarding a potential negotiation with Russia to end the war in Ukraine have fueled speculation about a possible easing of restrictions on Russian oil producers. If this materializes, it would reduce supply risks from Russia and contribute to bearish pressure on crude prices.
In the medium term, the EIA raised its U.S. crude oil production estimate for 2025 to 13.59 million barrels per day, adding another supply-side factor. In this context, oil prices remain under pressure, reflecting a mix of geopolitical developments, monetary policy adjustments, and growing signs of oversupply in the market.
Pepperstone doesn’t represent that the material provided here is accurate, current or complete, and therefore shouldn’t be relied upon as such. The information, whether from a third party or not, isn’t to be considered as a recommendation; or an offer to buy or sell; or the solicitation of an offer to buy or sell any security, financial product or instrument; or to participate in any particular trading strategy. It does not take into account readers’ financial situation or investment objectives. We advise any readers of this content to seek their own advice. Without the approval of Pepperstone, reproduction or redistribution of this information isn’t permitted.
