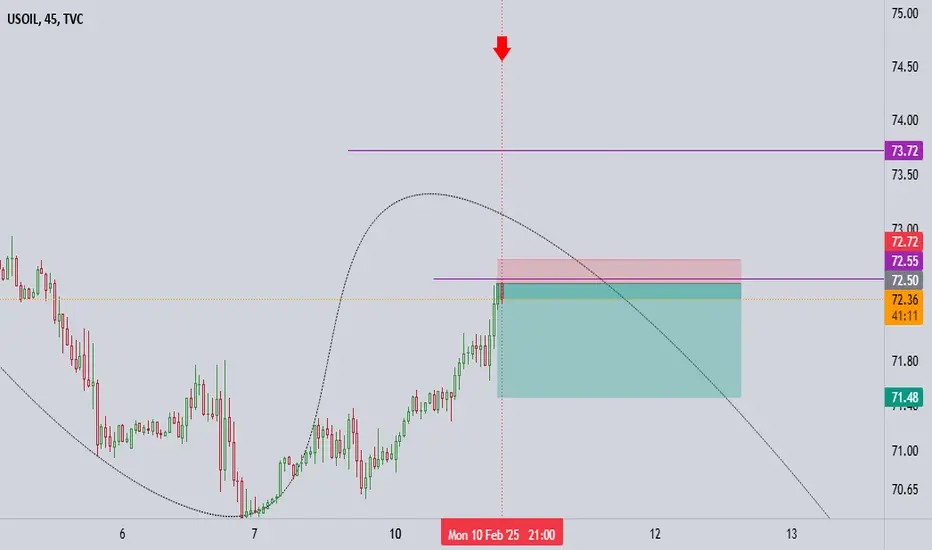
USOIL - near resistance? what's next??#USOIL... market just placed his current resistance high so keep close that region that is around 73.40 to 74.00
of market holds that region in that case we can see a drop from here.
otherwise not ..
good luck
trade wisely
CL-OIL trade ideas

USOIL ANALYSISWaiting for certain confirmations but my overall bias is bullish for USOIL. Looking for buys between 2 zones>> 72.00 and 71.500. Lets wait and see.

WTI OIL Weak price action on the medium-term.WTI Oil (USOIL) is extending the Bearish Leg of the Triangle pattern after the recent January 13 rejection on the 1W MA200 (orange trend-line). Until the 1W RSI turns bearish again, and more importantly the Support Zone gets hit, we expect this bearish trend to be extended.
The strongest Demand Level for the past 2 years has been this Support Zone, so our medium-term Target is on its top at $68.00.
-------------------------------------------------------------------------------
** Please LIKE 👍, FOLLOW ✅, SHARE 🙌 and COMMENT ✍ if you enjoy this idea! Also share your ideas and charts in the comments section below! This is best way to keep it relevant, support us, keep the content here free and allow the idea to reach as many people as possible. **
-------------------------------------------------------------------------------
Disclosure: I am part of Trade Nation's Influencer program and receive a monthly fee for using their TradingView charts in my analysis.
💸💸💸💸💸💸
👇 👇 👇 👇 👇 👇

Crude remains under pressureCrude oil spent most of Wednesday morning drifting lower, giving back yesterday’s gains and more. Approaching midday, European time, front-month WTI was hovering above $72 per barrel, which, while off over a dollar from Tuesday’s high, was still a couple of dollars above the lows from last week. The daily MACD has flattened out, suggesting a small decline in upside momentum. On top of this, oil is nowhere near back to ‘oversold’ levels which would indicate a buying opportunity. Fundamentally, nothing major has changed this week, other than the unexpectedly-large build in US crude stocks as reported yesterday by the American Petroleum Institute (API). President Trump’s ongoing tariff programme may weigh on economic activity. The US Federal Reserve has said it is in no hurry to cut interest rates further, a point repeated yesterday in Fed Chair Powell’s testimony to the Senate Banking Committee in Washington. Mr Trump’s determination to increase US oil production could also add to supply, which is price-negative. Meanwhile, global demand growth has been falling thanks to China’s severe economic problems.
This communication is for informational purposes only and should not be viewed as any form of recommendation as to a particular course of action or as investment advice. It is not intended as an offer or solicitation for the purchase or sale of any financial instrument or as an official confirmation of any transaction. Opinions, estimates and assumptions expressed herein are made as of the date of this communication and are subject to change without notice. This communication has been prepared based upon information, including market prices, data and other information, believed to be reliable; however, Trade Nation does not warrant its completeness or accuracy. All market prices and market data contained in or attached to this communication are indicative and subject to change without notice.

Against the Trend? We can anticipate a short term crude long.
It is against the trend on 15 mins, but a very short 200-500 points long.

USOIL SHORTUSOIL
If it reaches 73 next week and shows a bearish structure, it makes sense to short these areas. Empty lows below look nice


USOIL BEARS ARE GAINING STRENGTH|SHORT
Hello, Friends!
We are targeting the 69.83 level area with our short trade on USOIL which is based on the fact that the pair is overbought on the BB band scale and is also approaching a resistance line above thus going us a good entry option.
✅LIKE AND COMMENT MY IDEAS✅

USOUSD, OilUSOUSD is still in a downtrend. The price still has a chance to test the 74.49-74.9 level. If the price cannot break through the 74.9 level, it is expected that the price will go down. Consider selling the red zone.
🔥Trading futures, forex, CFDs and stocks carries a risk of loss.
Please consider carefully whether such trading is suitable for you.
>>GooD Luck 😊
❤️ Like and subscribe to never miss a new idea!

Bullish bounce off pullback support?WTI Oil (XTI/USD) is falling towards the pivot which has been identified as a pullback support and could bounce to the 1st resistance which acts as a pullback resistance.
Risk Warning:
Trading Forex and CFDs carries a high level of risk to your capital and you should only trade with money you can afford to lose. Trading Forex and CFDs may not be suitable for all investors, so please ensure that you fully understand the risks involved and seek independent advice if necessary.
Disclaimer:
The above opinions given constitute general market commentary, and do not constitute the opinion or advice of IC Markets or any form of personal or investment advice.
Any opinions, news, research, analyses, prices, other information, or links to third-party sites contained on this website are provided on an "as-is" basis, are intended only to be informative, is not an advice nor a recommendation, nor research, or a record of our trading prices, or an offer of, or solicitation for a transaction in any financial instrument and thus should not be treated as such. The information provided does not involve any specific investment objectives, financial situation and needs of any specific person who may receive it. Please be aware, that past performance is not a reliable indicator of future performance and/or results. Past Performance or Forward-looking scenarios based upon the reasonable beliefs of the third-party provider are not a guarantee of future performance. Actual results may differ materially from those anticipated in forward-looking or past performance statements. IC Markets makes no representation or warranty and assumes no liability as to the accuracy or completeness of the information provided, nor any loss arising from any investment based on a recommendation, forecast or any information supplied by any third-party.

USOIL Trade Log - CPI Session
USOIL Short Trade Setup – CPI Session Incoming 🚨
- Instrument: West Texas Oil (USOIL)
- Timeframe: 4-Hour
- Risk: 1% max due to CPI volatility
- Risk-Reward Ratio: Minimum 1:2
Key Technical Analysis:
1. Price has reached a strong resistance zone within the 4H Fair Value Gap (FVG) and is showing signs of rejection.
2. The Kijun Weekly and 4H levels align with this area, increasing the probability of a reversal.
3. Market structure has been bearish overall, with a clear Break of Structure (BOS) and internal liquidity grabs.
CPI Session Volatility Warning:
- With the CPI release incoming, expect aggressive moves and potential liquidity sweeps before directional commitment.
- If price runs liquidity above the FVG and shows strong bearish confirmations, this becomes a high-probability short.
- Manage risk carefully – no need to overexpose with CPI in play.
Trade Plan:
- Entry: Within the 4H FVG upon bearish confirmation.
- Stop Loss: Above the FVG high to avoid CPI wicks.
- Take Profit: At least 1:2 RRR, ideally targeting recent lows.
Stay sharp, play the reaction, and don’t force the trade if the setup invalidates. CPI is where weak hands get rinsed! 💀

11-2 Oil: 11-2 Oil: the down trend seems to be turning. Our signal system still shows a neutral score of 1 which consists of Retail sentiment 1, Seasonality 1, Trend reading 1, GDP -1, Manufacturing PMI 1, Services PMI -1, Retail Sales -1, Inflation 1, Employment Change -1, Unemployment Rate 1, Interest Rates -1. This data gives us a buy option at 74.445

Oil weekly forecast with key buy and sell levels Oil on the weekly with key levels and buy and sell suggestions.

#005 Obvious Trend WTICOUSD Buy 2344SGT 11022025Buy. Not paper trading neither am I using real money. Just for recording purposes. Cant trade real cos account not enough money. only have about 26cents sgd in it.
Not about to open a paper account cos too troublesome.
Going for 1R SL to 0.8R TP.
TP set at the next swing high as seen.
Will come back tomorrow at 9pm to see what happens.
I would like to take trades in the afternoon but now I am working. Hopefully tomorrow I am also going to work. I need to make some plans for tomorrow cos order has been slow recently.
2346SGT 11022025

Oil rises according to morning analysisIn the morning oil analysis, I said the rise could continue, and since this morning, oil prices have risen by more than one percent.

USOIL Set To Grow! BUY!
My dear followers,
This is my opinion on the USOIL next move:
The asset is approaching an important pivot point 70.97
Bias - Bullish
Safe Stop Loss - 69.61
Technical Indicators: Supper Trend generates a clear long signal while Pivot Point HL is currently determining the overall Bullish trend of the market.
Goal - 73.22
About Used Indicators:
For more efficient signals, super-trend is used in combination with other indicators like Pivot Points.
———————————
WISH YOU ALL LUCK

WTIC Oil moving into recession territoryOil is the first thing that is reduced in demand when economies weaken

Monitor resistance to enter a long trade.If static resistance is broken, the upward movement continues for oil.

US oil for longPrice was previously ranging, broke out and retested the neckline. Price broke out of the bearish channel wait for a retest of the support zone and we can go long.

WTI CRUDE OIL: Aiming at 82.00 long term.WTI Crude Oil is neutral on its 1D technical outlook (RSI = 48.507, MACD = -0.150, ADX = 34.872) as only today it crossed above the 1D MA50, following a correction since Jan 15th. The prevailing pattern is a Channel Up and we are very close to its bottom. The two bullish waves it had already, peaked after at least a +20% rise. As the 1D RSI is already on the S1 Zone, we anticipate a new bullish wave to start gradually and aim at the top of the Channel Up (TP = 82.00).
## If you like our free content follow our profile to get more daily ideas. ##
## Comments and likes are greatly appreciated. ##


WTI will rise UPThe price has completed wave 2 and is starting wave 3, with targets of 75.50, 77.80, and 80.
invalidation level is 71.