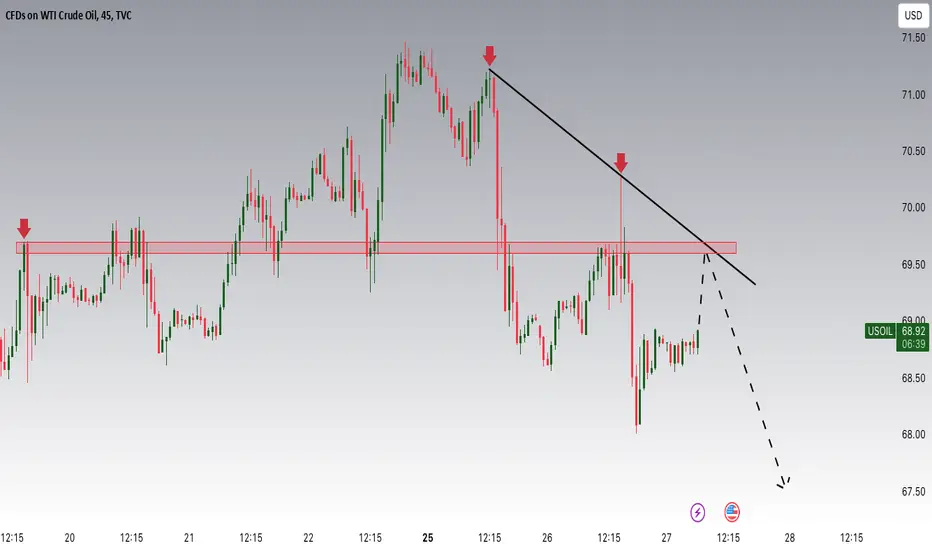
USOIL WTI Crude Oil 27 Nov 2024 ZonesBullish zone is above 69.4
Bearish zone is below 68.25
Note: Tis is not a buy/sell call. Use stop loss whenever trade.
CL-OIL trade ideas

Crude steadiesCrude prices were steadier in early trade this morning. This follows on from the hefty pullback seen so far this week which took front-month WTI down below $68 yesterday morning from over $71 early on Monday. The pullback came on hopes of a ceasefire deal between Israel and Hezbollah in Lebanon. This was confirmed yesterday, and came into force this morning. But it is worth noting that hostilities in this area have had no impact on global oil supply, so the sell-off was also technical to some extent. A look at the crude chart shows the steady downside pressure on prices since June 2022. This was when front-month WTI retested the highs from three months earlier when oil topped $120 per barrel following Russia’s invasion of Ukraine. Since then, crude has made a series of lower highs, with the last attempt at an upside breakout topping at $84. Yet there doesn’t appear to be much downside from current levels, as selling pressure seems to exhaust itself once prices get down to $65 or thereabouts. Traders will be wary of being overexposed ahead of tomorrow’s Thanksgiving holiday, particularly given the OPEC+ meeting on Sunday. The group will have to update the market over where it goes on maintaining current output cuts.

USOIL long moveUSOIL chart on the 2Hours timeframe shows the price trading towards a demand zone, indicating bearish pressure after the earlier upside movement. The pair is approaching a key horizontal support level, a significant area that has previously acted as both support and resistance. This level also aligns with the 88.0 Fibonacci Retracement, adding further confluence for potential price reactions.
If the price breaks below this demand zone, it could signal a bearish continuation, as sellers may gain control. However, if the demand zone holds, there is potential for a bullish reversal, leading to a rebound toward the next supply zone.

USOIL: Bullish Divergence and Trendline Break on 1-Hour ChartUSOIL has formed a bullish divergence on the 1-hour chart and has already broken the trendline. This setup suggests potential upward momentum.

USOIL - Long Trade Idea + Full Long-Term Pattern Breakdown...In this video, I explore the long-term pattern for crude oil and how it aligns with the current long trade setup.
I also discuss potential scenarios that could unfold once this trade reaches its target. The link to the long trade idea is provided below.
Target: 97.50
Entry: 72.95
Stop\Support Level: 66.69

USOIL Potential DownsidesHey Traders, in today's trading session we are monitoring USOIL for a selling opportunity around 70 zone, USOIL is trading in a downtrend and currently is in a correction phase in which it is approaching the trend at 70 support and resistance area.
Trade safe, Joe.
WTI Crude SellAnticipating another bearish leg within this falling channel pattern. The trend is currently bearish and I would look for sells around 69.22, targeting 67.7.

USOIL Will Go Lower! Short!
Here is our detailed technical review for USOIL.
Time Frame: 9h
Current Trend: Bearish
Sentiment: Overbought (based on 7-period RSI)
Forecast: Bearish
The market is approaching a key horizontal level 68.67.
Considering the today's price action, probabilities will be high to see a movement to 66.63.
P.S
We determine oversold/overbought condition with RSI indicator.
When it drops below 30 - the market is considered to be oversold.
When it bounces above 70 - the market is considered to be overbought.
Like and subscribe and comment my ideas if you enjoy them!

Crude Oil OutlookHere is the current outlook on WTI Crude Oil.
We are between supply and demand zones and continuing with the daily trendline.
You could take a small risk inside the demand zone back up to supply by dropping to the lower timeframes and looking for your favorite trend reversal pattern.
Check out the link in my bio for a deeper analysis.

Crude Oil to $72 and then potentially $75Crude Oil to $72 and then potentially $75
Idea would invalidate with a daily close below $68.8

USOIL M30 ANALYSIS Bearish Outlook.
USOIL prices are expected to rise today, driven by a weakening US dollar and increasing demand for crude oil. Geopolitical tensions and supply chain disruptions are likely to support the commodity.
Technical Analysis.
USOIL is trading above the 50-day moving average, indicating a bullish trend. The Relative Strength Index (RSI) suggests oversold conditions, pointing to a potential rebound.
Support and Resistance.
Key support levels are $66.89 and $65.97. Key resistance levels are $69.89 and $71.21.
Trading Strategy.
We recommend a short position in USOIL, targeting $66.89. However, traders should be cautious of potential pullbacks and adjust their strategies accordingly.
BEST WISHES TOM 😎

USOIL 5 WAVE STRUCTURE DOWNIt appears that a five-wave structure to the downside has completed. Now, we anticipate a corrective three-wave structure before the downward trend resumes.

71.25 to stay alive Good afternoon we've bounced from the fib grain sheds below to test fib barn to 79.98 supply /blue . if it needs to test support Oct/ .618 below green demand is mthly support . Red 610 sma R presently daily support suggests a drop to 68.34 / grain sheds .Prev pivot LL LH fur bear

Bias short side on USOIL too.Bias short side on USOIL too. This is not an advice for investment or speculation.

Bulls fasten your seatbelt please Down move incoming.. Sorry Bulls.. Be careful with longs.. Good luck and safe trade🤪

Spotcrude oil (OIL) Short 28.33 R/RShort now Oil , its going to fall wayyy too much!
We are waiting for knew soon which will take the price to new lows!
