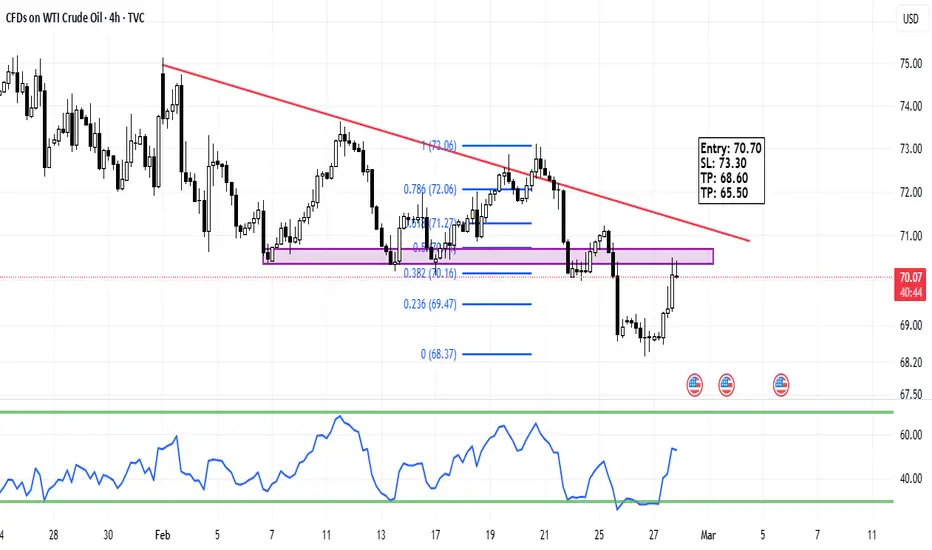
USOIL - Bearish ContinuationThe commodity is in dowmtrend, short position can be entered at fib level of 0.5.
CL-OIL trade ideas
Oil analysisOil is forming a suspicious pattern in a bearish corner
When the downtrend line is broken, it is confirmed

USOIL Long - Daily SFP and break above previous candleRationale:
Dipped below then regained support level
Daily candle just broke the previous high

WTI - Will Oil Return to the Uptrend?!WTI oil is below the EMA200 and EMA50 on the 4-hour timeframe and is moving within its medium-term descending channel. If the downward trend continues towards the demand range, the next opportunity to buy oil with a risk-reward ratio will be provided for us. An upward correction of oil towards the supply range will provide us with an opportunity to sell it.
Despite markets showing resilience to geopolitical uncertainties following recent tensions between U.S. President Donald Trump and Ukrainian President Volodymyr Zelensky, any signs of economic weakness in the United States could prompt investors to raise their expectations for interest rate cuts. However, even if inflation data does not reinforce such expectations, it is unlikely to have a significant impact on the U.S. dollar.
In the United States, inflation remains a major challenge for the Federal Reserve. The overall Consumer Price Index (CPI) rose to 3% in January, dashing hopes for two rate cuts in 2025. However, the market’s reaction was not overly negative, as investors anticipated that the Personal Consumption Expenditures (PCE) index, which the Federal Reserve prioritizes, would be less severe than the CPI.
According to the Cleveland Federal Reserve’s Nowcast model, the core PCE index fell from 2.8% to 2.7% in January, while the overall PCE rate declined to 2.5%. If the actual data released on Friday aligns with these projections and no unexpected increases appear in the monthly figures, expectations for two 0.25% rate cuts may strengthen, exerting downward pressure on the U.S. dollar.
Meanwhile, U.S.President Joe Biden attempted to foster freer elections in Venezuela by extending an offer of cooperation, but this initiative failed. Now, Trump has announced that he will terminate this policy. He also noted that Venezuela is refusing to take back illegal migrants who had arrived in the U.S.
This agreement, which had eased sanctions on oil, gas, and gold, was partially revoked in April 2024 after opposition candidate María Corina Machado was barred from running in the presidential election. Trump wrote on Truth Social: “We hereby revoke the concessions that corrupt Joe Biden granted to Nicolás Maduro of Venezuela regarding the oil deal dated November 26, 2022, as well as the electoral conditions in Venezuela, which the Maduro regime has failed to meet. Additionally, the regime has not returned the violent criminals it sent to our great America as quickly as promised. Therefore, I am ordering that Biden’s ineffective and unmet concessions be revoked as of the March 1 extension date.”
Today, Trump escalated his stance on Venezuela by canceling Chevron’s oil license. This move was prompted by Caracas’s refusal to accept deportees and implement democratic reforms. President Trump announced that he would revoke the Biden-era license that had allowed Chevron to produce oil in Venezuela.
This decision appears to be a significant setback for Chevron, the American oil giant. On his social media platform, Truth Social, Trump stated that he would rescind the license granted on November 26, 2022, which had permitted Chevron to operate in Venezuela.

(USOIL) on the 4-hour (4H) timeframe, (USOIL) on the 4-hour (4H) timeframe, showing technical analysis and potential price movement.
Chart Details:
• Current Price: Around 69.01 - 69.07
• Technical Analysis:
• Support Zone: 68.26 - 69.18 (marked in red)
• Resistance Levels: 75.14 - 77.03 (yellow and purple zone)
• Chart Pattern: Possible double bottom or bullish reversal setup
• Expected Movement: If the support holds, price may rise towards 74-75
• Previous Resistance: Horizontal key levels and a head & shoulders pattern
Conclusion:
This chart suggests a bullish breakout possibility, especially if the price stays above 69 and moves upward. However, if it breaks below 68.26, further downside pressure could build up.

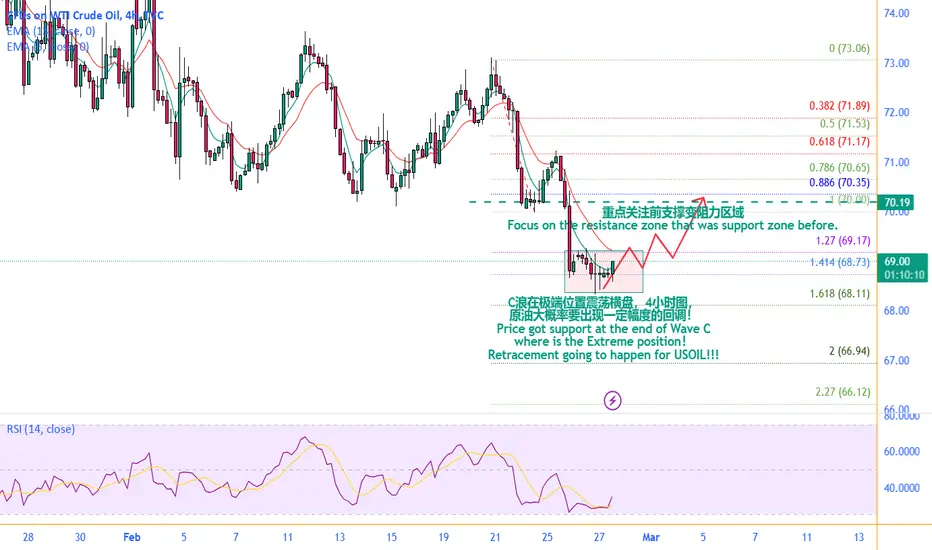
0227 USOIL looking for a correction on 4H chart!!!Hello traders,
On Wednesday, the internal alert stated: "On Wednesday, we are waiting for a new sideways trend in crude oil. Crude oil may experience a short-term decline followed by a pullback around the opening time of the European and American markets. Participation is not recommended!"
On Thursday, in the four-hour chart, the C wave of crude oil is oscillating sideways at an extreme position, and there is a high probability of a certain degree of pullback! Pay close attention to the previous support level of 70.00, which is also a key psychological price level.
You can consider taking a light position to go long on crude oil!
TP1: 70.00
TP2: 70.35
GOOD LUCK!
LESS IS MORE!
CRUDE OIL : Bearish due to Double Top formation
DOUBLE TOP PATTERN -
Crude oil has recently formed a double top pattern on daily chart and has broken down from it indicating bearish momentum for the commodity
SUPPORT-RESISTANCE ZONE BREAKDOWN -
crude oil has recently broken down from a strong support-resistance zone with strong red candlestick indicating strong bearish confirmation
PROFIT TARGET -
level is at 68.16

USOIL IS ON SUPPORT ZONE?Currently Usoil is in support zone we will see pump from this levels that i mentioned in chart so be carefull with your trades and avoid short usoil becouse Usoil is on support.

WTI crude oil Wave Analysis – 25 February 2025
- WTI crude oil broke support zone
- Likely to fall to support level 67.00
WTI crude oil recently broke the support zone between the round support level 70.00 (which reversed the price multiple times from the start of February), the support trendline from September and the 61.8% Fibonacci correction of the upward impulse from September.
The breakout of this support zone accelerated the active short-term correction ii of the intermediate upward impulse sequence (3) from September.
WTI crude oil can be expected to fall further to the next support level 67.00 (former monthly low from December).

WTI on high time frame
"Hello traders, focusing on WTI, the price has hit the daily order block at $73.5 and experienced a strong rejection on the 4-hour chart. The price has broken below the trend line and is indicating potential downward movement during the Asian session today. It's important to note that there is a CPI news release during the U.S. session today, so exercise caution in your trading decisions."
If you have any specific questions or need further assistance with your message, feel free to ask!

USOil updateHow are you my friends?
I talked about this chart before at 80 and that the decline does not mean a collapse
This is the result of my words and as I saw it I was with you in the rise before to 80 approximately then with you in the decline then the rise again in the coming days
Today we saw the level of 70.380
And we notice that it will touch the blue diagonal line
Then the line will be broken, we will see more decline
And we will soon see areas below 70
We will update the markets soon

Oil - see if my plan worksHello traders, please feel free to share your trading ideas, and please give a Boost if you agree with my trading plan. My trading strategy is Price Action, which is the simplest strategy of trading on the price movement. A key part of my discipline is Stop Loss set when opening a trading position, which ensures every trading is risk managed. My 1 to 1 trading training is available, please message. Trade well and good luck!

WTI Crude retest of 13th February swing lowThe WTI Crude (US Light Crude) price action sentiment appears bearish, supported by the longer-term prevailing downtrend.
The key trading level is at 7200, 20th February swing low level. An oversold rally from the current levels and a bearish rejection from the 7200 level could target the downside support at 6964 followed by 6880 and 6830 levels over the longer timeframe.
Alternatively, a confirmed breakout above 7200 resistance and a daily close above that level would negate the bearish outlook opening the way for further rallies higher and a retest of 7250 resistance followed by 7316 levels.
This communication is for informational purposes only and should not be viewed as any form of recommendation as to a particular course of action or as investment advice. It is not intended as an offer or solicitation for the purchase or sale of any financial instrument or as an official confirmation of any transaction. Opinions, estimates and assumptions expressed herein are made as of the date of this communication and are subject to change without notice. This communication has been prepared based upon information, including market prices, data and other information, believed to be reliable; however, Trade Nation does not warrant its completeness or accuracy. All market prices and market data contained in or attached to this communication are indicative and subject to change without notice.

Can oil's price to rise? 🔥 Friends, the market is heating up!
Bears have pushed oil down to a key support level – $72 per barrel. This is the last point where wave (5) of the impulse could start forming.
📉 Bearish scenario: A break below this level could send oil to new yearly lows.
🐂 Bullish scenario: We see a bullish divergence on the H1 chart, and the price is testing the upper boundary of the descending regression channel. If the bulls manage to break $73.52, we consider it reasonable to buy with targets at $75.90 and $78.50.
⚠️ Risk factor: Oil remains highly volatile due to news events.
Additionally, Trump is once again threatening new sanctions on Russia’s oil sector and a 25% tariff on goods from Canada—which the market may see as a potential catalyst for growth.
📊 Trade carefully and don’t forget stop-losses!
What’s your outlook? Share your thoughts in the comments!

Oil Reversal in Sight? Technical Analysis🚀 Oil (XTI-USD) Reversal in Sight? Technical Analysis 📈
On the 4H chart, oil is holding above the 70.00 support level and attempting to break 71.20. If bulls manage to secure this level, we could see a move toward the local high of 73.10.
Technical signals supporting growth:
✅ RSI and Momentum divergence on 4H
✅ Attempt to break above the Alligator’s jaws on 1H
✅ Possible corrective move after the recent decline

USOILUSOIL is in bullish trend.
Storngly bullish trend potentially printing HH and HL.
Alligator also indicates trend will go up further.
We buy at CMP.

After a new base formed in December, a new channel has formedSeeing how this move plays out.
A base is created in December 2024.
Price falling below $70 affected the commodity and a new base price formed.
The markets are trying to recover from a long period of low income and low margins. We have started a new cycle.

USDWTI Technical Analysis.When the USDWTI weekly chart is examined; It is observed that the price movements continue in a triangle formation. It is evaluated that the USDWTI price can target the 107.00 level in price movements above the 75.95 level, but it is evaluated that it can retreat to the 34.57 level in price movements below the 65.47 level.

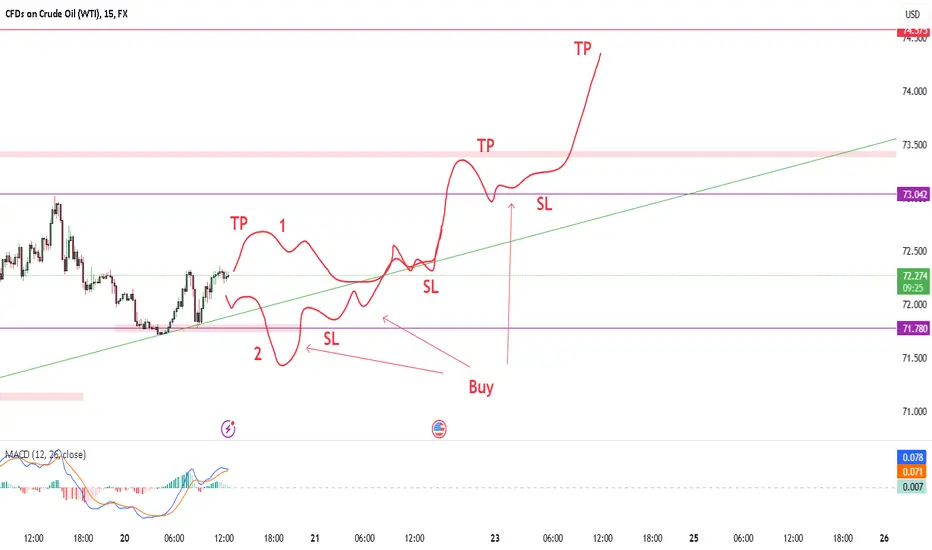
Oil - 2 possible buy opportunities Oil - 2 possible buy opportunities. Let's see how it works, always set SL.
WTI Crude Oil: Range-Bound Between Critical LevelsLooking at the H1 timeframe for WTI Crude Oil, we're observing a defined range structure:
Market Structure:
Trading within established range (70.17-73.18)
Recent rejection from 72.50 resistance
Moving averages clustered around current price
Multiple tests of both range boundaries
Key Levels:
Upper Range: 73.178
Current Price: ~72.23
Lower Range: 70.168
Immediate Support: 71.81
Technical Indicators:
Volume showing decreased activity in recent consolidation
Momentum indicators in neutral territory
Price oscillating between moving averages
No clear directional bias in indicators
Trading Considerations:
Respect range boundaries for entries
Watch for breakout confirmation with volume
Key resistance at 73.17 needs clear break for upside
Support at 70.17 crucial for maintaining range
BIAS: NEUTRAL
Clear range-bound conditions
No dominant trend direction
Price centered in trading range
Waiting for range breakout for directional bias

Us oil for buy Price was ranging, it broke out and retested the zone with a touch of double bottom and the retest of the neckline.

US OIL BULLISH 73Hey there on 1HTF US oil change there ways we now can see at this level we should see a bullish continue will reach next ath record 73 and 73.50
But if the price decline and comes downside and then we should see next support level is
Of US oil from 72 and 71.50 must be bullish candle to our next target 73 and 73.50

USOIL is changing as I analyzedThrough the previous accurate analysis, USOIL is rising as I analyzed, and many traders have also reaped considerable profits.
The current price of USOIL is US$72.3, and downward pressure still exists. Market expectations for Russia-Ukraine negotiations are heating up. If Russian oil sanctions are lifted, increased supply will put pressure on oil prices. Bank of America analyzed that the underlying price of Brent crude oil may fall by 5-10 US dollars per barrel.
sell:72.4
Tp:71
Tp:70
Sl:73.6
TVC:USOIL FX:USOIL
