CLVUSDT 1WCLV ~ 1W Analysis
#CLV This trade is very high risk. Buy gradually from here with a short -term target of at least 20%+. This is the lowest support for now.
CLVUSDT trade ideas

CLV UPDATE DAILY TIMEFRAME Clover Finance (CLV), or simply Clover, is a blockchain operating system. It provides a one-stop, easy‑to‑use blockchain infrastructure and an ethereum virtual machine (EVM) compatible framework for Substrate‑based applications
ANY THOUGHTS ON GETTEX:CLV ?
❤️ THIS POST AND WE WILL SHARE NEXT pair

THE CLV WHALES BREAK..THE CLV WHALES BREAK..
CLV interesting for new voluume
Always manage the risk since it has shown an increased trend of 60% to risky to enter directly with no plan.
There is high chance this coin can break up $0,10 coming time

THE BREAK OF CLV TO $0,10 THE BREAK OF CLV TO $0,10
There is a high chance for CLV to $0,10 even with the breakdown price of BTC.
Low time this coin did break down 35%, and is able to recovery back in the coming time frames.

#CLV UPDATE DAILY TIMEFRAME
Clover Finance (CLV), or simply Clover, is a blockchain operating system. It provides a one-stop, easy‑to‑use blockchain infrastructure and an ethereum virtual machine (EVM) compatible framework for Substrate‑based applications
ANY THOUGHTS ON GETTEX:CLV ?
❤️ THIS POST AND WE WILL SHARE NEXT Pair

CLVUSDT 1WCLV ~ 1W Analysis
#CLV This is the lowest support block for now. Buy from here if you still have a Conviction on this coin with a minimum target of 20%+.

1.8RR worst case, 6.7 RR bestLooks like a trade on CLV, if price bounces anywhere within the Daily SOR and has a significant move up before hitting the indicated entry, cancel the trade


CLV / USDTCLV / USDT
GETTEX:CLV Perfect Bullish Setup forming 🐃
Descending wedge breakout is imminent & 0.786 Fib support zone holding strong!
Send it 📈
🎯1 Target: 0.09801$
🎯2 Target: 0.12646$
🎯3 Target: 0.15646$

CLV USDT💰 GETTEX:CLV (Clover Finance)
Clover Finance (#CLV) is forming a rounded bottom pattern, signaling a potential bullish reversal. The price is currently hovering near the Fibonacci 0.786 support zone ($0.05130), offering a strong entry point for buyers 🚀.
Price Target:
🎯 Target: $0.18098
This upward trajectory aligns with Fibonacci extensions and the rounded structure, suggesting significant upside potential as the trend develops 🔥.

CLVUSDT: Approaching Key Buyer Zone—Stay Alert! CLVUSDT: Approaching Key Buyer Zone—Stay Alert! ⚠️
CLVUSDT is closing in on a critical area where buyers could activate. This is a moment to proceed with sharp focus and well-placed alerts.
Key Zone Ahead: We’re entering a level where buyer activity might pick up significantly.
Watch for Confirmations: Low-timeframe bullish breakouts are crucial, but they must align with the following:
CDV showing clear buyer dominance.
Volume Profile indicating strong support.
Heatmap revealing liquidity building in higher zones.
Execution Plan: If these conditions align, it’s a setup worth considering.
Final Note: Precision and patience are your allies here. Evaluate carefully before jumping in. Boost, comment, and follow for more critical updates! 🚀
Let me tell you, this is something special. These insights, these setups—they’re not just good; they’re game-changers. I've spent years refining my approach, and the results speak for themselves. People are always asking, "How do you spot these opportunities?" It’s simple: experience, clarity, and a focus on high-probability moves.
Want to know how I use heatmaps, cumulative volume delta, and volume footprint techniques to find demand zones with precision? I’m happy to share—just send me a message. No cost, no catch. I believe in helping people make smarter decisions.
Here are some of my recent analyses. Each one highlights key opportunities:
🚀 RENDERUSDT: Strategic Support Zones at the Blue Boxes +%45 Reaction
🎯 PUNDIXUSDT: Huge Opportunity | 250% Volume Spike - %60 Reaction Sniper Entry
🌐 CryptoMarkets TOTAL2: Support Zone
🚀 GMTUSDT: %35 FAST REJECTION FROM THE RED BOX
🎯 ZENUSDT.P: Patience & Profitability | %230 Reaction from the Sniper Entry
🐶 DOGEUSDT.P: Next Move
🎨 RENDERUSDT.P: Opportunity of the Month
💎 ETHUSDT.P: Where to Retrace
🟢 BNBUSDT.P: Potential Surge
📊 BTC Dominance: Reaction Zone
🌊 WAVESUSDT.P: Demand Zone Potential
🟣 UNIUSDT.P: Long-Term Trade
🔵 XRPUSDT.P: Entry Zones
🔗 LINKUSDT.P: Follow The River
📈 BTCUSDT.P: Two Key Demand Zones
🟩 POLUSDT: Bullish Momentum
🌟 PENDLEUSDT.P: Where Opportunity Meets Precision
🔥 BTCUSDT.P: Liquidation of Highly Leveraged Longs
🌊 SOLUSDT.P: SOL's Dip - Your Opportunity
🐸 1000PEPEUSDT.P: Prime Bounce Zone Unlocked
🚀 ETHUSDT.P: Set to Explode - Don't Miss This Game Changer
🤖 IQUSDT: Smart Plan
⚡️ PONDUSDT: A Trade Not Taken Is Better Than a Losing One
💼 STMXUSDT: 2 Buying Areas
🐢 TURBOUSDT: Buy Zones and Buyer Presence
🌍 ICPUSDT.P: Massive Upside Potential | Check the Trade Update For Seeing Results
🟠 IDEXUSDT: Spot Buy Area | %26 Profit if You Trade with MSB
📌 USUALUSDT: Buyers Are Active + %70 Profit in Total
🌟 FORTHUSDT: Sniper Entry +%26 Reaction
🐳 QKCUSDT: Sniper Entry +%57 Reaction
📊 BTC.D: Retest of Key Area Highly Likely
This list? It’s just a small piece of what I’ve been working on. There’s so much more. Go check my profile, see the results for yourself. My goal is simple: provide value and help you win. If you’ve got questions, I’ve got answers. Let’s get to work!

CLV Looks promosing too. Hi there
I'm looking for coins that haven't completed their correction, fall from top to bottom. My target is the Golden (Correction) Zone. A cup formation might be possible here.

CLVUSDT 1WCLV ~ 1W
#CLV This trade is very high risk,. But if you still have Conviction on this coin,. This support block would be a very good buying place for now,. with a minimum target of 20%+

CRYPTO - Is CLV at the start of a move? A symmetrical triangle is forming after an accumulation phase. The support level (red zones) acts as a reliable barrier, while the $0.080-0.082 zone indicates a potential reversal point.
Target growth: $0.105-0.125 (approximate potential: 31%).
What to watch for?
• Breakout of the triangle’s upper boundary.
• Holding support above the green zone.

CLV local swing trade targetsAll main targets for CLV still relevant and with CLV 2.0 updates looks promising
Here is just a local swing idea
Possible Targets and explanation idea
➡️D tf after 2 main signal to buy from TradeOn indicator we pumped and form the top but not sweep the structure on higher timeframes
➡️November money inflow signal marked. Now need a new one for continuation
➡️Based on TradeON we could see 2 signals to sell for correction
➡️Healthy correction can be to the green block
➡️Now we trade over Exit line of Take profit indicator. need to see correction and even test of buy line on 12h or D tf
➡️Red block marked zone for fixation of swing trade and 0.29 cents like middle term fixation of investments
Hope you enjoyed the content I created, You can support with your likes and comments this idea so more people can watch!
✅Disclaimer: Please be aware of the risks involved in trading. This idea was made for educational purposes only not for financial Investment Purposes.
---
• Look at my ideas about interesting altcoins in the related section down below ↓
• For more ideas please hit "Like" and "Follow"!

CLVUSDT.1DThe daily chart of CLV/USDT shows a recent spike in price within a relatively narrow range, indicating potential volatility and key levels to monitor. This analysis will discuss the recent price action, identify significant support and resistance levels, and interpret technical indicators to predict future movements.
Price Action and Structure:
CLV/USDT has recently shown a sharp rise, followed by a consolidation phase. The price is currently around $0.07757, with immediate resistance and support levels close by.
Resistance and Support Levels:
Resistance Levels: The immediate resistance is observed at $0.06447 (R1). If the price can sustain a breakout above this level, it might target the higher resistance at $0.13983 (R2), which is significantly above the current trading range.
Support Levels: Support is found at $0.02366 (S1), a critical level to hold to prevent further declines. Additional support lies further down at $0.02468 (S2), which could serve as a secondary fallback in case of a more substantial retracement.
Moving Averages:
The chart does not specifically highlight moving averages, but the price being above the nearest support level suggests a possible bullish bias in the short term.
Technical Indicators:
MACD: The Moving Average Convergence Divergence (MACD) is almost level, with the MACD line very close to the signal line and the histogram near zero, indicating a lack of strong momentum in either direction.
RSI: The Relative Strength Index (RSI) is at 57.17, suggesting a moderately bullish momentum without nearing overbought levels, providing some room for upward movement.
Conclusion:
CLV/USDT is currently experiencing a consolidation phase after a sharp rise, trading near significant support and resistance levels. The technical setup suggests that there is potential for further upside if it breaks above the resistance at $0.06447 (R1). Traders should watch this level closely for a potential breakout or rejection. The supports at $0.02366 (S1) and $0.02468 (S2) should be monitored for any signs of bearish reversal. Given the current readings from MACD and RSI, traders might expect some sideways movement before any significant directional trend develops.

clv why i keep it?a big hd+ divergence in rsi indicator
broken trend line with pullback done
hold it and pray to me....
taget is 0.50 hold it and get rich

CLV / USDT : Poised for a breakout above key resistance CLV/USDT: Poised for a Breakout Above Key Resistance
CLV/USDT is nearing a crucial resistance level, setting the stage for a potential breakout 📈. The price has been steadily climbing, building momentum for a significant upward move 💥. A successful breakout could ignite a strong bullish trend 🚀. Keep this pair on your radar and wait for a confirmed move before entering.
Key Insights:
1. Critical resistance: CLV/USDT is approaching a major resistance level that has acted as a ceiling in the past. Breaking above this level could trigger a powerful rally.
2. Volume watch: Monitor trading volume during the breakout. A surge in volume 🔥 would indicate strong buyer interest.
3. Bullish indicators: Momentum indicators like RSI and MACD are showing positive trends ⚡, reinforcing the potential for a bullish breakout.
Steps to Confirm the Breakout:
Wait for a clear 4H or daily candle to close above the resistance level 📍.
Look for a noticeable increase in volume during the breakout to validate buyer strength 📊.
Watch for a retest of the broken resistance, turning it into support, to confirm the move ✅.
Be wary of fake breakouts, such as sharp reversals or long wicks above resistance ⚠️.
Risk Management Strategies:
Implement stop-loss orders to protect your capital 🔒.
Adjust your position sizing to align with your trading plan 🎯.
This analysis is for educational purposes only and is not financial advice. Always do your own research (DYOR) 🔍 before making any investment decisions.

Long trade idea for CLVUSDT Long trade idea for CLVUSDT
Falling Wedge measured from NOV 2024
Potentially min 596% profit from current date. Target $0.62
Do note potential pullback according to purple line.
Note that there are Bearish Order Blocks as shown.
Do exercise due diligence and that all trades comes with risks

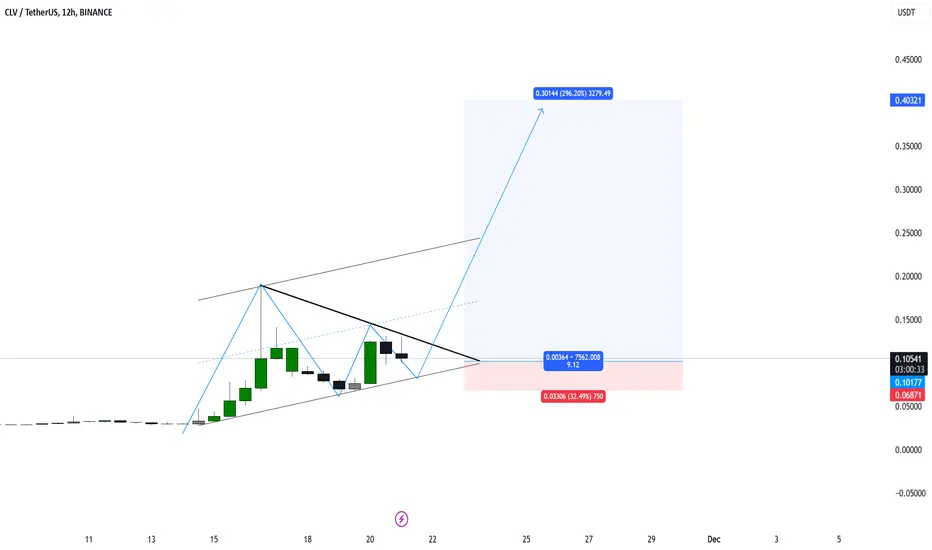
The chart represents the technical analysis of CLV/USDT on the 1The chart represents the technical analysis of CLV/USDT on the 12-hour timeframe. Here's the detailed breakdown:
Key Observations:
Symmetrical Triangle:
The price is forming a symmetrical triangle, signaling potential breakout scenarios.
Currently, the price is consolidating near the triangle's apex, increasing the likelihood of a sharp move soon.
Harmonic Pattern:
A potential harmonic structure is forming, indicating a bullish setup if the breakout happens to the upside.
Support and Stop Loss:
Support Zone: 0.10177 USDT – A critical area where price may bounce.
Stop Loss: 0.06871 USDT – Marked below the lower structure to manage risks.
Resistance Levels:
Immediate breakout above the triangle could lead to a significant move toward the higher targets.
Target Levels:
Target 1: 0.30144 USDT (Projected breakout level with a potential 296% gain from current levels).
Target 2: 0.40321 USDT (Further extension point based on harmonic analysis).
Scenarios:
Bullish Breakout:
If the price breaks above the symmetrical triangle, the targets of 0.30144 USDT and 0.40321 USDT are achievable.
The bullish momentum could accelerate due to the tight consolidation.
Bearish Breakdown:
If the price falls below 0.10177 USDT, the bearish scenario may play out.
A break below the 0.06871 USDT stop-loss level indicates invalidation of the bullish setup.
Recommendations:
Entry Strategy: Look for a confirmed breakout above the triangle for a safer entry.
Stop Loss: Place it below 0.06871 USDT to limit downside risks.
Take Profit:
TP1: 0.30144 USDT.
TP2: 0.40321 USDT.
Clover Finance Ready For Long-Term Growth (1,500% Or Higher 12m)Here we have something interesting, Clover Finance (CLVUSDT) produced a lower low now, October, vs August; is this revealing what will happen with the other pairs?
We know that the market is one but some produce higher lows while other produces lower lows... Regardless of the short-term, long-term we are set to experience growth.
Now, this is just a small detail because the low in August 2024 is very similar to the low hit today, basically a double-bottom.
If Bitcoin repeats this same pattern, a lower low vs early August would indicate a drop below 49K, but this wouldn't change the bigger picture which is a strong recovery in late 2024/early 2025, and a massive bull-market starting March 2025; sustained long-term growth.
I am showing multiple targets for Clover Finance on the chart but this is not all, when things start going, there can be more.
Thank you for reading.
See you on the next chart.
Namaste.

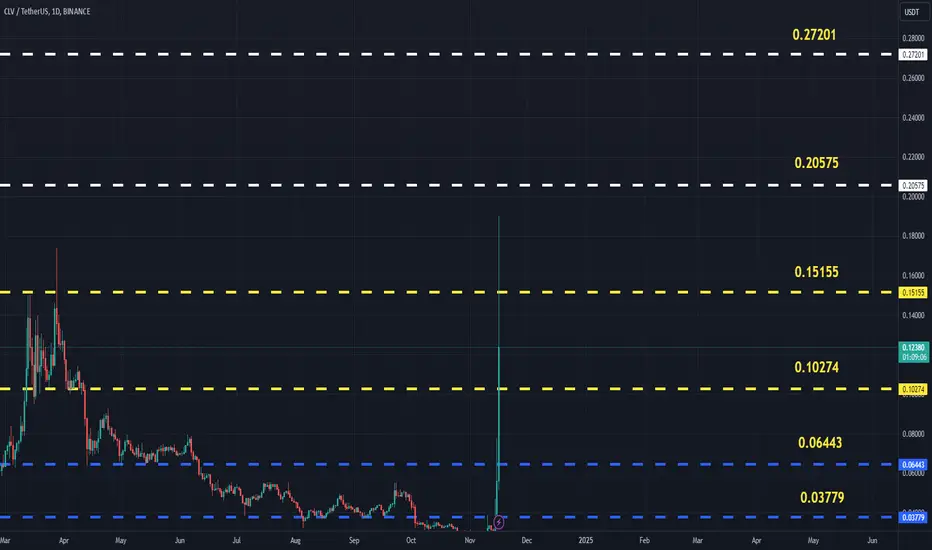
CLVUSDT (CloverFinance) Updated till 16-11-24CLVUSDT (CloverFinance) Daily timeframe range. we can see a insane pump here from its local low. shitload of money made by traders. now its trying to stay above 0.10274 which will be easy for retrace back. if not than fall back to old support than possible to pick up.
CLV: Explosive Opportunity – Don’t Miss the Pump!We’re aiming for $2, and the goal is clear: CLV is about to take off, and the move could happen at any moment. Telegram, Reddit, and Discord pump groups are already preparing for the next big boom, and we’re giving you a heads-up so you don’t miss out.
Why bet on CLV now?
The token has an extremely low market cap, making it the perfect candidate for a sudden breakout. With so much untapped potential, CLV can easily surpass $1 billion in market value.
This week alone, we’ve seen several meme tokens hit billions, and now it’s CLV’s turn. The setup is ready, and the next big move is being planned.
Immediate action is key:
Don’t miss this once-in-a-lifetime opportunity. Jump in now, load up your bag, and get ready for the pump. The plans are already in motion, and those who act early will reap the biggest rewards.
⏰ The time is now! Join before it’s too late. COINBASE:ETHUSD BINANCE:BTCUSD COINBASE:BTCUSD
