#CLV (SPOT) entry range( 0.032- 0.034) T.(0.0999) SL(0.032)BINANCE:CLVUSDT
entry range( 0.03200- 0.03400)
Target1 (0.04110) - Target2 (0.06549)- Target3 (0.07350)- Target4 (0.09990)
1 Extra Targets(optional) in chart, if you like to continue in the trade with making stoploss very high.
SL .1D close below (0.032)
*** collect the coin slowly in the entry range ***
*** No FOMO - No Rush , it is a long journey ***
**** #Manta ,#OMNI, #DYM, #AI, #IO, #XAI , #ACE #NFP #RAD #WLD #ORDI #BLUR #SUI #Voxel #AEVO #VITE #APE #RDNT #FLUX #NMR #VANRY #TRB #HBAR #DGB #XEC #ERN #ALT #IO #ACA #HIVE #ASTR #ARDR #PIXEL #LTO #AERGO #SCRT #ATA #HOOK #FLOW #KSM #HFT #MINA #DATA #SC #JOE #RDNT #IQ #CFX #BICO #CTSI #KMD #FXS #DEGO #FORTH # AST #PORTAL #CYBER #CLV #RIF #ENJ #ZIL #APT #GALA #STEEM #ONE #LINK #NTRN #COTI #CLV ****
CLVUSDT trade ideas

CLV (1M_Journey) Entry ( .34 ) Target ( .39 ) Stop ( .32 )BINANCE:CLVUSDT
1 Million Journey
It is a long journey with NO FOMO & NO RUSH
In those trades i will try to make 1 million USD from 1000 USD
*********************************************************************************
(1)
Entry ( .34 )
Target ( .39 )
Stop ( .32 )
*********************************************************************************
General information
************************
1. throw this challenge i will try to make 1 million USD from 1000 USD
2. It will be very long journey not fixed by time with NO FOMO & NO RUSH.
3. I will take this challenge by my personal money and my personal decisions so please if you need to follow ( do your own plan).
4. May be i can achieve that target and may be not.
5. I think it will be educational challenge.
6. May be a lot of challenges Throw the journey, i will try to correct the path every fall.
6. I do not need 1000X in one coin but i need small profit with a lot of successful trades depend on the following formula for 10% Profit
NST= ( IN(FV/C) ) / ( IN (1+P) )
NST = Number of successful trades (NST)
FV = Final value
C = Capital
P = Profit percentage
IN = Natural logarithms ( IN from calculator)
NST = ( IN ( 1000 000 / 1000 ) / ( IN ( 1 + 10% ) ) = 6.908 /.09531 = 73.5 Successful trade. with no loses.
Risk management
**********************
1. Entry by 50% or 75% depend on the market situation.
2. Maximum 5% loses per trade.
3. Maximum 1 lose per day.
4. Maximum 2 loses per week.
5. Maximum 2 trades per day.
6. Minimum rewards has to be 5% and the maximum depends the coin targets & market situation.
Trading rules
****************
1. Figuring the best entry point.
2. After achieving 5% profit moving stop loss to break even.
3. Trading available opportunities in the market ( everyday - every week - every month)
4. Trading will be spot only.
5. Trading will be with trusted & high liquidity platform ( Binance coins).
6. (Monitoring coins - low liquidity coins) will not be traded .
7. (High rewards -low risks - fast trades - lower time frames ) will be traded.
Notes
********
1. these rules can be changed due to the market situations and new challenges.
Remember always, NO FORMO - NO RUSH It is a long journey.
Thank you for reading,
@Crypto_alphabit

#CLV (SPOT) entry range (0.03800- 0.04800)T.(0.1212) SL(0.03680)BINANCE:CLVUSDT
entry range (0.03800- 0.04800)
Target1 (0.06349) - Target2 (0.07350)- Target3 (0.09900)- Target4 (0.12120)
SL .1D close below (0.03680)
*** collect the coin slowly in the entry range ***
*** No FOMO - No Rush , it is a long journey ***
**** #Manta ,#OMNI, #DYM, #AI, #IO, #XAI , #ACE #NFP #RAD #WLD #ORDI #BLUR #SUI #Voxel #AEVO #VITE #APE #RDNT #FLUX #NMR #VANRY #TRB #HBAR #DGB #XEC #ERN #ALT #IO #ACA #HIVE #ASTR #ARDR #PIXEL #LTO #AERGO #SCRT #ATA #HOOK #FLOW #KSM #HFT #MINA #DATA #SC #JOE #RDNT #IQ #CFX #BICO #CTSI #KMD #FXS #DEGO #FORTH # AST #PORTAL #CYBER #CLV ****

CLVUSDT.1DThe technical chart for CLV/USDT on TradingView offers an insightful view into the Clover Finance price action against the US Dollar Tether on a daily timeframe. The chart showcases resistance at $0.05980 (R1) and support at $0.03299 (S1), with a lower support (S2) previously identified at around $0.03202.
Analyzing the current setup, we observe a recent uptrend where the price has started to make higher lows, suggesting an accumulation phase that might precede a significant upward movement. The price is currently testing the $0.04905 mark, which positions it near the mid-point between S1 and R1.
Technical Indicators:
Stochastic RSI: This indicator is approaching the overbought territory, signaling that the market might be extending towards a temporary peak, possibly triggering a retracement or consolidation phase soon.
MACD: The MACD line is above the signal line but remains relatively flat with the histogram showing minimal activity. This indicates that while the market maintains a bullish bias, the momentum is not particularly strong.
Trading Strategy: Given the current market conditions and the position within the trading range, there are two primary strategies to consider:
Bullish Scenario: If CLV/USDT continues to uphold the support at S1 and breaches R1 at $0.05980, it may indicate a stronger bullish trend. Traders might consider entering a long position on a confirmed breakout above R1, targeting potential higher resistances. A stop-loss should be placed just below the recent low to protect against unexpected downturns.
Conservative Watch: Due to the nearing overbought condition and the modest momentum reflected in the MACD, cautious traders might wait for a pullback towards S1 at $0.03299 before establishing positions. This strategy would aim to capitalize on a stronger bounce, offering a more favorable risk-reward ratio.
Conclusion: The CLV/USDT pair shows potential for further gains, but the approach should be cautiously optimistic, given the mixed signals from the technical indicators. Monitoring the price action closely around these key levels and adjusting the strategy based on the strength or weakness observed will be crucial. As always, it is advisable to consider the broader market sentiment and potential fundamental catalysts that could influence price movements, and to employ sound risk management practices to navigate the inherent volatility of cryptocurrency markets effectively.

Good Day CLVlians BearishAs of this Head & shoulder pattern formed on many of the crypto,, this can result a short bearish move to the down side at around $0.029 c.
Always do your own diligence and be aware of the high risks.

# Introducing the "Sez Pro" Indicator for ICT TradersThe "Sez Pro" indicator is an advanced and professional tool in technical analysis that utilizes trading volume and price bands to identify safe entry and exit zones in financial markets. This indicator is specifically designed for ICT (Inner Circle Trader) traders and those seeking a deeper understanding of market trends. Here, we explain the various components of this indicator:
## User Input Parameters
- **Length:** (`manualLength`) The period length used to calculate the highest and lowest prices. The default value is 200, which the user can adjust.
- **Smooth Length:** (`smoothLength`) The period length used to smooth the highest and lowest prices using a simple moving average (SMA). The default value is 5.
- **Volume Threshold Multiplier:** (`volumeThreshold`) The multiplier used to determine buying and selling pressure. The default value is 1.5, with a minimum adjustable value of 0.1.
- **Color:** (`colorSetting`) The color chosen by the user for displaying the price bands.
## Order Block Detection Parameters
- **Order Block Color:** (`orderBlockColor`) The color of the order blocks used to identify critical points.
- **Order Block Border Color:** (`orderBlockBorderColor`) The border color of the order block, taken from the user settings.
- **Order Block Border Width:** (`orderBlockBorderWidth`) The width of the order block border, adjustable between 1 and 5.
## Key Calculations
- **Highest and Lowest Prices:** Calculation of the highest price (`highestHigh`) and lowest price (`lowestLow`) over the specified period.
- **Smoothing the Bands:** Smoothing the highest and lowest prices using a simple moving average (SMA) and creating smooth bands (`smoothHigh` and `smoothLow`).
- **Midline:** Calculating the midline as the average of the smoothed bands.
- **Average True Range (ATR):** Calculating ATR to determine the upper and lower bands based on the midline.
- **Buying and Selling Pressure Detection:** Identifying candles with buying (`buyingPressure`) and selling (`sellingPressure`) pressure using trading volume and the specified volume multiplier.
## Order Block Detection and Safe Entry Zones
- **Order Block Detection:** Identifying and drawing high (`highBox`) and low (`lowBox`) order blocks based on the highest and lowest prices in the specified period.
- **Safe Entry Zones:** Identifying safe entry zones based on the crossover of the closing price above the midline and the lower price being above the midline.
The "Sez Pro" indicator provides a comprehensive analysis of price behavior and trading volume, helping professional traders, especially ICT traders, to identify critical market points and make more accurate trading decisions. This tool allows traders to understand market trends more precisely and improve their trading efficiency.

CLV/USDTAll that can be said is that the tool is in the accumulation phase and is worth your attention. In the long run, it's just space. The monthly schedule confirms this

CLV/USDT- BUY SETUP📈 BINANCE:CLVUSDT SIGNAL
✔︎ENTRY : 0.06185 to 0.05844
🏓TARGETS :
✔︎T1 : 0.07636
✔︎T2 : 0.08744
✔︎T3 : 0.10537
✔︎T4 : 0.12329
✘STOP : 0.05290
🚦Stop Trigger:
• If you make capital management: Stop is activated when one candle opening and closing
below the stop level of the same time frame of the signal.
• If you don't make capital management: Stop is direct without waiting for the candle to close.
💡Risk management :
• Enter the trade with 10% to 20% of your capital to reduce risk and save cash to enter other opportunities.
• Sell (25% to 50%) on (T1) and don't move your stop-loss.
• Sell 50% on (T2) and move your stop loss to the entry point.
• You are safe now, and the next 25% is up to you.
💡Reason for this trade:
This trade gives my trading system a sign of strength:
• My trading system is based on liquidity and reversal zones.
• When the liquidity is swept from one side under certain conditions, we will wait for the price on the other side.
The liquidity will attract the price like a magnet.
• the first side that has been swept:
1- naked POC
2- previous monthly low
3- failuer swing point close to naked POC
• Opposite side targets:
1- previous weekly and monthly high
2- quarterly open
3- liquidty void
💡Entry setup
1- touch naked POC close to previous monthly low
⚠️WARNING:
• I'm not a financial advisor.
• Do your own research (DYOR).

Clover Finance Bullish Signal CLV is attempting to break the current consolidation channel
🎯new targets
In 2024, the team at CLV will continue to focus on building an even more powerful cross-chain and multichain wallet, which will continue to keep in focus user privacy and transparency. The development team will continue integrating new networks that rise in popularity and TLV, thus allowing our wallet to continue leading the way as a cross-chain and multi-chain platform.
Before we delve into the specifics of our roadmap, we’d like to emphasize our commitment to transparency in product development to our community. We acknowledge that, operating in the DeFi sector, adhering to a fixed long-term roadmap can be difficult due to the rapid pace of industry evolution. Nevertheless, we will do our best to activate features that are market fit and can contribute to user experience.
That said, we invite you to check back on this blog post, as we will be continuously updating it with new information on product development

Clvusdt Buy opportunityClvusdt is displaying a potential Inverse Head and Shoulders (ISHS) pattern, characterized by a break out of a descending broadening wedge formation.
The recent pullback has tested the upper trendline of the wedge. The immediate resistance level corresponds to the neckline of the ISHS pattern. A break above this neckline could signal a significant momentum shift.
The chart provides targets for both the pattern and possible extended targets.
We welcome your feedback on this coin and appreciate your support with likes.
Thank you.

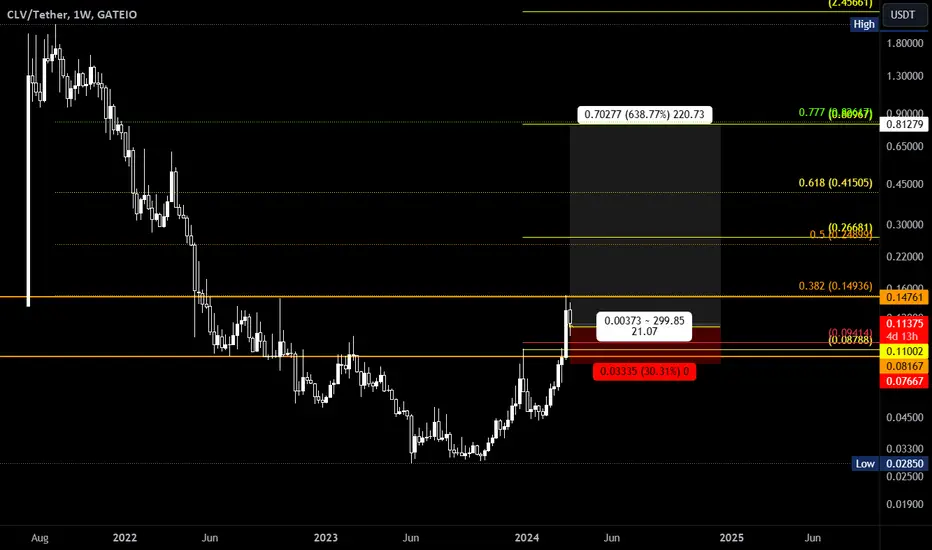
CLV back in Bulls control, target $0.10 to $0.128CLV bulls appear to be back in control after finding daily bottom support at $0.070.
The token is currently trading at $0.0867, and eyeing potential resistance zones soon.
The first hurdle for CLVUSDT is expected to be in the range of $0.10 to $0.112. This zone could present a profitable short-term opportunity for traders looking to take advantage of a potential price stall or reversal.
If the bulls can muster enough strength to overcome this initial resistance, the token could set its sights on $0.12830.
However, this higher price point is also seen as a potential resistance zone, offering another profit-taking area for those with a longer-term view.

CLV BULLISH The 0.618 level combined with a strong support level indicates potential for a significant bounce. If this holds, we can expect a strong rebound.
If this isn't bullish, I don't know what is. I bought here, hoping this trade will be successful.
But as always, BTC will decide the next move.

CLVUSDT(CLV) Daily tf Range Updated till 30-03-24CLVUSDT(CLV) Daily timeframe range. it had its pump now taking a retrace. it would be good if it can stay above 0.12686 or else 0.08723 can be visited. staying above 0.12686 can led it to 0.17155 again.

CLV I am buying some CLV at this level . It's an altcoin as a high risk token .
Don't forget us for another call 😁😉💚

#CLV Risked a small position on #Clover with 2% risk
chart looks good, have good retest, spot only will look to DCA incase dips further
i don't use hard stops on spot positions
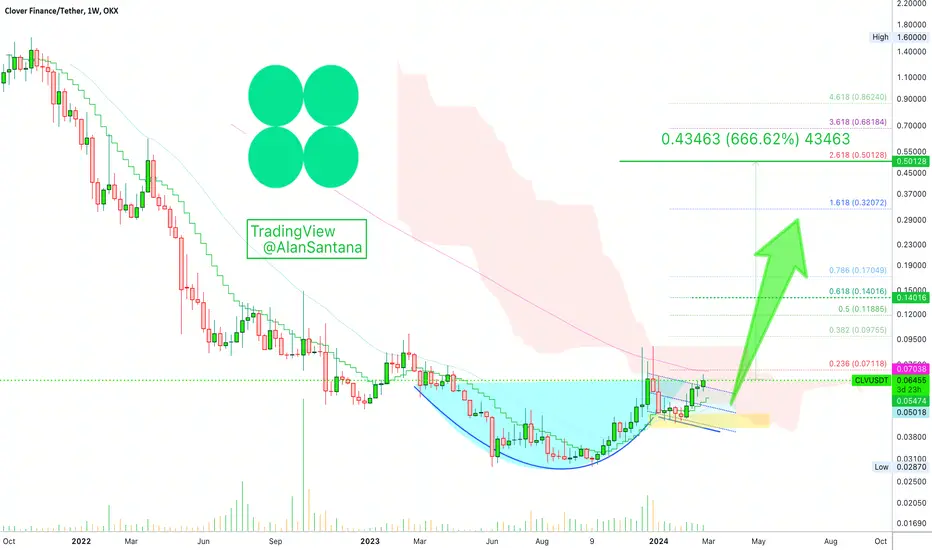
✴️ Clover Finance Cup & Handle Bottom (666.6% Profits Potential)This small batch of trade ideas will end with Clover Finance vs Tether (CLVUSDT); we have the classic C&H pattern.
Together with this pattern the following bullish signals are present:
➖ 4 consecutive week of bullish action.
➖ Very strong RSI; super-strong.
➖ Trading above EMA10/21.
The Cup & Handle pattern is a bottom signal and when coupled with the above becomes very strong.
"Very strong," related to technical analysis and chart reading.
The whole thing just means that this pair is going up.
There are many targets along the way, but I am mapping 666.6% just for fun.
Namaste.
#CLV/USDT#CLV
The price has been moving in a falling wedge since October 2022
The price rebounded more than once from the 0.03150 support area
Currently, the moving average 100 is broken upward
It is supported by my selling saturation on the MACD
The downtrend is broken
Current price 0.04463
The first target is 0.06759
The second goal is 0.09347
Which represents 200% of the current price

CLV Market değeri inanılmaz derece de küçük olan bir coin...
Kaçırmamanızı şiddetle tavsiye ediyorum..
Yükselmesi an meselesi

Clover Finance (CLV) - Bullish divergenceOn the above 4-day chart price action has corrected 97% since 2021. A number of reasons now exist to be long, including:
1) You know why.
2) Price action resistance breakout.
3) Multiple oscillators print positive divergence with price action over a period of 120 days, very bullish.
4) The above divergence has also printed on the BTC pair of this token.
Is it possible price action falls further? Sure.
Is it probable? No.
Ww
Type: trade
Risk: <= 6%
Return: 8 to 15x
Timeframe: between now and Middle of the month. Don’t message me asking if price action will correct again to fill you missed long order! (You’d be surprised how often this very message is received)

CLV ANALYSIS (2D)Before anything, pay attention to the time frame, the time frame is big and time consuming.
A double correction seems to have been completed where the second part of the correction was a diamond diametric.
We have a demand area and a flip line on the chart, which form a strong support area.
The targets are marked on the picture.
There is a supply in front of the price, but by eliminating sell orders in this area, the price can move towards the targets.
We have also specified the invalidation level on the chart. Closing 1 daily candle below this level will violate the analysis.
For risk management, please don't forget stop loss and capital management
When we reach the first target, save some profit and then change the stop to entry
Comment if you have any questions
Thank You

CLVUSDT | 1W 👀To continue the growth, it remains to overcome the upper boundary of the resistance area ($0.09), which has only been touched so far.
Moreover, the price reached the limit support.
- Not financial advice, trade with caution.
✅ Stay updated on market news and developments that may influence the price of Clover. Positive or negative news can significantly impact the cryptocurrency's value.
✅ Exercise patience and discipline when executing your trading plan. Avoid making impulsive decisions driven by emotions, and adhere to your strategy even during periods of market volatility.
✅ Remember that trading always involves risk, and there are no guarantees of profit. Conduct thorough research, analyze market conditions, and be prepared for various scenarios. Trade only with funds you can afford to lose and avoid excessive risk-taking.
#Crypto #Clover #Investment #CLV

CLV/USDT - Clover Finance: Super Trend◳◱ On the $CLV/ CRYPTOCAP:USDT chart, the Super Trend pattern suggests indications that the trend may be gaining or losing strength. Traders might observe resistance around 0.08384 | 0.09184 | 0.11269 and support near 0.06299 | 0.05014 | 0.02929. Entering trades at 0.08226 could be strategic, aiming for the next resistance level.
◰◲ General info :
▣ Name: Clover Finance
▣ Rank: 597
▣ Exchanges: Binance, Kucoin, Huobipro, Gateio, Mexc, Hitbtc
▣ Category/Sector: Infrastructure - Interoperability
▣ Overview: None
◰◲ Technical Metrics :
▣ Mrkt Price: 0.08226 ₮
▣ 24HVol: 4,908,465.542 ₮
▣ 24H Chng: 8.968%
▣ 7-Days Chng: 10.84%
▣ 1-Month Chng: 70.79%
▣ 3-Months Chng: 62.53%
◲◰ Pivot Points - Levels :
◥ Resistance: 0.08384 | 0.09184 | 0.11269
◢ Support: 0.06299 | 0.05014 | 0.02929
◱◳ Indicators recommendation :
▣ Oscillators: BUY
▣ Moving Averages: STRONG_BUY
◰◲ Technical Indicators Summary : STRONG_BUY
◲◰ Sharpe Ratios :
▣ Last 30D: N/A
▣ Last 90D: N/A
▣ Last 1-Y: N/A
▣ Last 3-Y: N/A
◲◰ Volatility :
▣ Last 30D: N/A
▣ Last 90D: N/A
▣ Last 1-Y: N/A
▣ Last 3-Y: N/A
◳◰ Market Sentiment Index :
▣ News sentiment score is N/A
▣ Twitter sentiment score is 0.60 - Bullish
▣ Reddit sentiment score is 0.59 - Bullish
▣ In-depth CLVUSDT technical analysis on Tradingview TA page
▣ What do you think of this analysis? Share your insights and let's discuss in the comments below. Your like, follow and support would be greatly appreciated!
◲ Disclaimer
Please note that the information and publications provided are for informational purposes only and should not be construed as financial, investment, trading, or any other type of advice or recommendation. We encourage you to conduct your own research and consult with a qualified professional before making any financial decisions. The use of the information provided is solely at your own risk.
▣ Welcome to the home of charting big: TradingView
Benefit from a ton of financial analysis features, instruments and data. Have a look around, and if you do choose to go with an upgraded plan, you'll get up to $30.
Discover it here - affiliate link -

CLVUSDT.1DBased on the provided market data, the CLV currency is currently priced at 0.060 USDT. The RSI (Relative Strength Index) values for 4-hour, 1-day, and 7-day are 60.97, 69.90, and 60.97 respectively. These values indicate that the currency is neither overbought nor oversold. However, the 1-day RSI is nearing the overbought threshold of 70, so there might be a potential price pullback.
The MACD (Moving Average Convergence Divergence), a trend-following momentum indicator, shows positive values across all three timeframes (4-hour, 1-day, and 7-day), suggesting a bullish trend.
The Bollinger Bands for 4-hour, 1-day, and 7-day are 0.063, 0.064, and 0.065 respectively. The current price is below the upper band in all three timeframes, suggesting it's not in an overbought condition.
In terms of support and resistance levels, the immediate resistance levels are at 0.061 (4-hour), 0.065 (1-day), and 0.088 (7-day). If the price breaks these levels, it could continue to rise towards the next resistance level. On the downside, the immediate support levels are at 0.059 (4-hour), 0.053 (1-day), and 0.046 (7-day). If the price breaks these levels, it could continue to fall towards the next support level.
In conclusion, the market data suggests a bullish trend for CLV currency in the near term but investors should be cautious as the 1-day RSI is nearing the overbought threshold. As always, it's recommended to use these indicators in conjunction with other tools and to consider the overall market trend before making any investment decisions.
