US100 Index – Potential Bearish Reversal in Key Resistance Zone🧠 US100 Index – Potential Bearish Reversal in Key Resistance Zone
Timeframe: 30-Minute | Chart Published: July 24, 2025
---
🔍 Overview
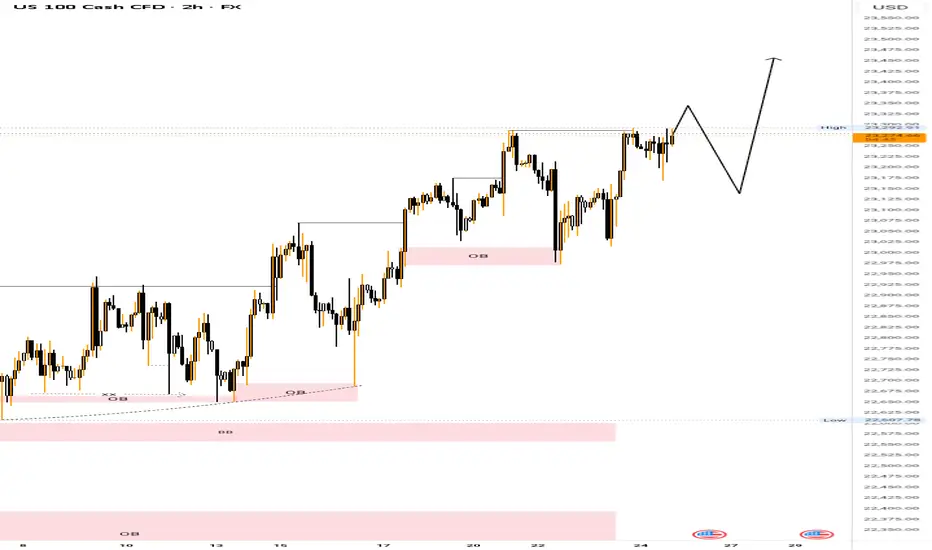
The US100 (NASDAQ) has been trading in a well-structured ascending channel, forming higher highs and higher lows. However, recent price action suggests that the index is testing a critical supply zone near 23,400, with signs of weakening bullish momentum. This may signal a potential corrective phase or bearish reversal.
---
📈 Technical Analysis Breakdown
🔵 Trend Structure:
Price is respecting a clear ascending trendline (blue), connecting multiple higher lows.
Multiple bullish flag/channel formations have been completed within the uptrend, showing healthy momentum until the current point.
🟥 Resistance Zone:
Strong supply zone marked between 23,250 – 23,450.
Price action shows stalling candles and rejection wicks within this zone, indicating buyer exhaustion.
⚠ Bearish Patterns:
The red path projection suggests a head and shoulders-like structure forming at the top of the channel.
This, along with divergence in wave strength and shrinking momentum, supports a potential reversal.
🔵 Key Support:
First support lies around 23,000 — aligning with the ascending trendline and previous consolidation.
If broken, next demand zone is around 22,835 – 22,900, where historical consolidation took place.
---
🔁 Projected Scenario (as per visual path)
1. Price may attempt one last push into the 23,400–23,450 zone (possible false breakout).
2. Rejection from this level could trigger a fall toward the ascending trendline support.
3. A confirmed break of the trendline can lead to a larger correction toward the 22,800 zone.
---
🧠 Unique Insight
This chart combines multi-timeframe structure recognition with a real-time reversal formation inside a long-standing bullish trend. The analysis doesn’t just rely on textbook patterns—it recognizes real-time price behavior shifts, which makes it valuable for proactive traders.
---
📌 Conclusion
While the trend remains bullish overall, caution is warranted as the US100 approaches a historically significant resistance zone. The setup offers a compelling risk-reward short opportunity for aggressive traders, especially if the price confirms a break below trendline support.
---
🔧 Next Steps for Viewers
> “Watch for a clean rejection candle or lower high at resistance before entering short. If trendline breaks cleanly, 22,835 could be the next target zone.”
NDAQ100 trade ideas

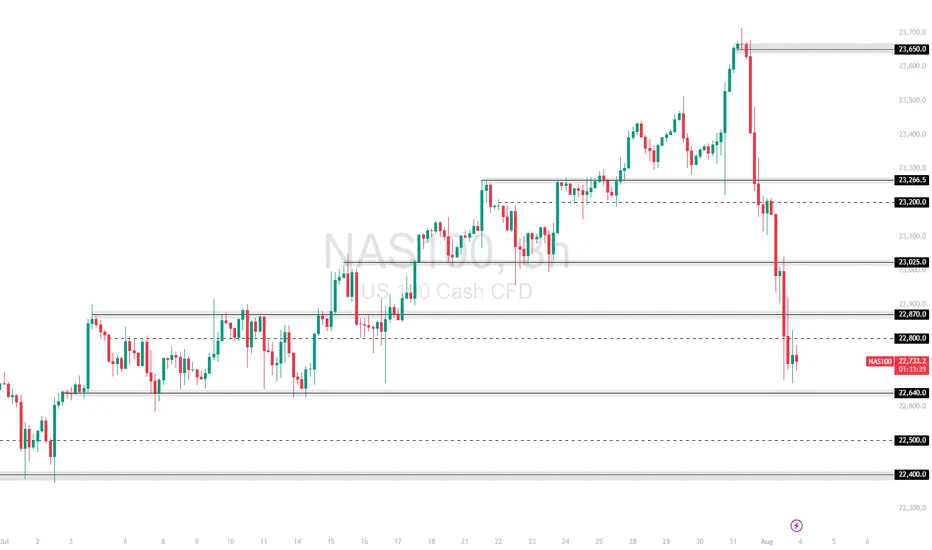
NAS100 Slammed by Fed Data and Trump Trade Remarks Can 22,640 ?The NAS100 plunged after strong US economic data fueled expectations of tighter Fed policy, and Trump's renewed push for aggressive trade deals rattled tech sentiment. After rejecting the 23,665 🔼 resistance, the index dropped sharply through multiple support levels.
Price is now consolidating just above the 22,640 🔽 zone, a key near-term support.
Support: 22,800 🔽, 22,640 🔽, 22,500 🔽
Resistance: 23,025 🔼, 23,277 🔼, 23,332 🔼
Bias:
🔽 Bearish: A breakdown below 22,640 could trigger a move toward 22,500. If that fails, 22,400 becomes the next target.
🔼 Bullish: A reclaim of 23,025 would be the first sign of bullish recovery.
📛 Disclaimer: This is not financial advice. Trade at your own risk.
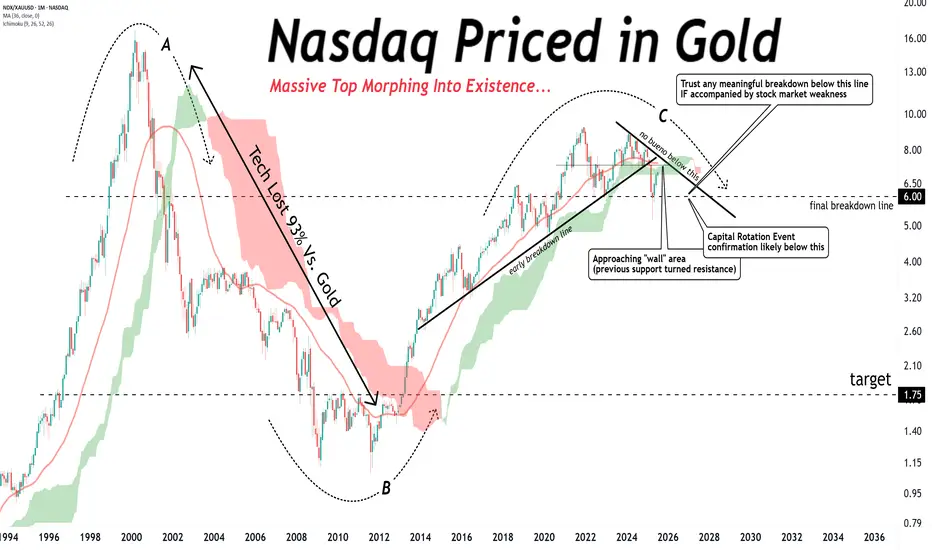
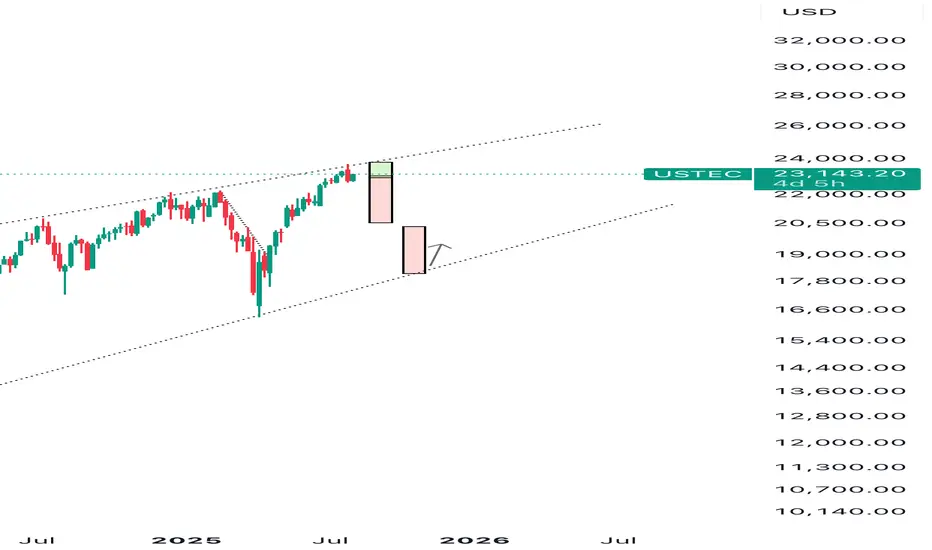
Tech stocks are still not out of the woods, priced in gold.Tech stocks are still not out of the woods, priced in gold.
Right now, it looks like a BIG TOPPING pattern morphing into existence.
No man's land.
Nasdaq Short: Completion of 5 waves with wave 5=wave 1Over here, I present a short case for Nasdaq (and S&P500 by default since their correlations are high). The main reasons are:
1. Completion of 5 waves structure both on the high degree and on low degree, as shown in the chart.
2. Fibonacci measurement where wave 1 = wave 5.
The stop of this idea is to be placed slightly above the high, in this case, I placed it at around 23320. The take profit target is at the bottom of primary wave 4, around 20685.
Take note that this is a positional short, meaning the strategy is to short and hold and periodically adjust your stop loss based on unfolding on wave structure. Sizing is based on your risk tolerance.
Good luck!

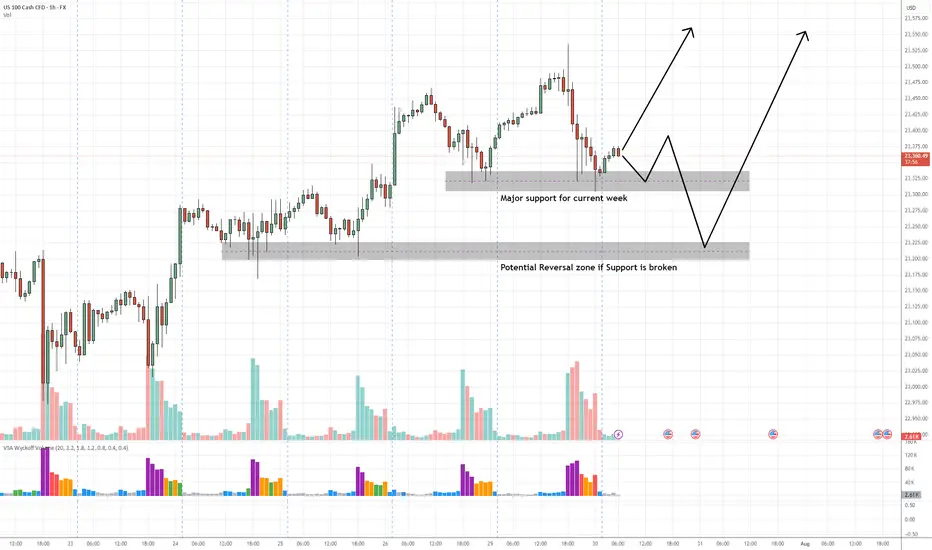
NAS100 Buy Setup – VSA & Multi-Zone Demand Analysis✅ Primary Entry Zone: Major support for current week (around 23,325–23,350)
✅ Secondary Entry Zone: Potential reversal zone if primary support is broken (around 23,200–23,230)
🎯 Target 1 (TP1): Previous swing high near 23,500
🎯 Target 2 (TP2): Extension above 23,550
🛑 Stop Loss (SL): Below 23,170 (beyond secondary reversal zone to avoid false breaks)
📊 Technical Insight (VSA & Price Action Structure)
Support Structure:
The current major support zone has been tested multiple times with no follow-through selling, indicating strong buying interest from larger players.
Volume Spread Analysis Observations:
On the recent decline into the major support zone, we see wider spreads on high volume followed by narrow range candles on lower volume, a classic sign of stopping volume and supply exhaustion.
Within the secondary reversal zone, historical reactions show climactic volume spikes leading to sharp reversals, suggesting this level is watched closely by smart money.
Any test back into the zone on low volume would confirm the No Supply (NS) condition.
Trade Pathways:
Scenario 1: Price respects the major support and begins to climb, confirming demand dominance → target TP1 then TP2.
Scenario 2: Support is temporarily breached, triggering a liquidity grab into the secondary reversal zone, followed by a bullish reversal bar on high volume → strong buy signal with potentially faster move toward TP levels.
📍 Bias: Bullish as long as price holds above the secondary reversal zone.
📌 Execution Tip: Wait for a wide spread up-bar on increased volume from either zone to confirm the start of the markup phase.
Is the NASDAQ Vault Open for a Full Bullish Heist?🧠 NASDAQ Heist Masterplan: Thieves Eye on 24,500 🎯💰
🚨 Asset: NASDAQ100 / US100 / NDX
📊 Plan: Bullish | 🔁 Layering Strategy
🎯 Target: 24,500
🛑 Stop Loss: 22,600
📍 Entry: Any level – the vault’s wide open!
💼 Thief Trader's NASDAQ High-Stakes Robbery Is LIVE! 🤑📈
Welcome, money bandits & market looters! 💼💰
The time has come to launch a full-scale bullish raid on the NASDAQ fortress. We’re not just taking entries — we’re stacking them like a pro with our layered limit order strategy across swing zones. 🔫📉➡️📈
🔓 Entry:
Pick any price! We break in anytime, anywhere.
🔁 Stack your buy limits on 15m–30m swing lows.
🔔 Set your alerts – don’t let the opportunity slip.
🛑 Stop Loss:
Guard your loot at 22,600.
Risk management is the bulletproof vest in this raid. 🎯
Adjust your SL based on lot size and order volume. 📏🔐
🎯 Profit Target:
Thieves retreat at 24,500.
But hey – smart robbers use trailing SL to squeeze every last drop of gold! 🏆💸
💡 Scalpers & Swingers:
Stick to the long side only.
If your pockets are deep – full-send mode ON.
If not, tag along with swing entries. Patience pays big! 💎⏳
📢 Heads Up, Heist Crew:
News drops = landmines. Step carefully.
🚷 No new entries during major announcements.
🛡️ Use trailing SL to defend your profit bags.
🚨 Daily Reminder:
This market isn’t a playground. It’s a battlefield.
Use COT data, macro reports, sentiment scans, and index-specific triggers to fortify your robbery blueprint. Stay smart, stay updated! 📊🧠
💥 Boost Our Loot Crew 💥
Hit that LIKE ❤️ to support the Thief Army!
Stronger visibility = Bigger Loots = More Victory Runs.
See you at the next robbery – we move in silence, but the market hears us loud! 🐱👤💸🔥🚀

NASDAQ-Lets catch 250 Points togetherHello Fellow Traders,
Nasdaq has been wild since a time now. Today, I have spotted a rade to share with my fellow traders.
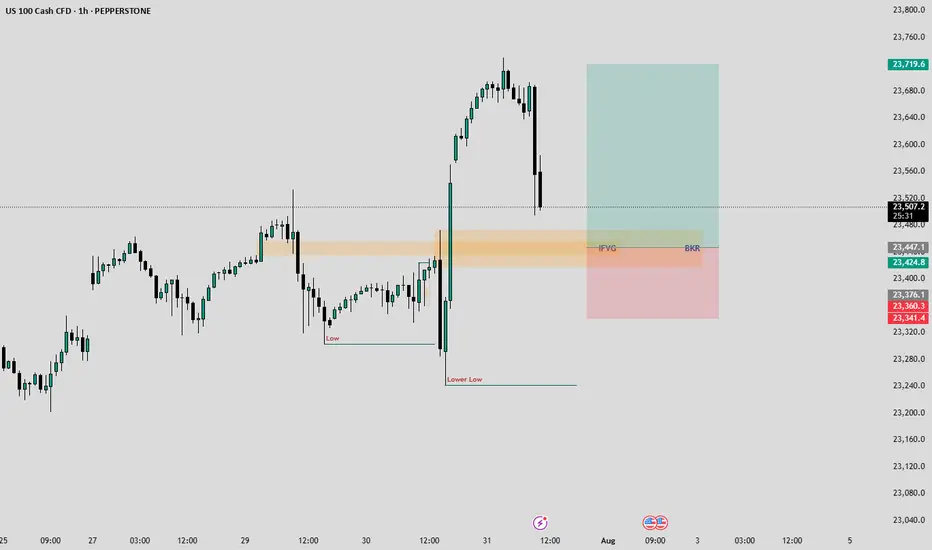
Yesterday closed with a good bullish candle. As the NY seesion has begun now, I am anticipating price to retrace to the highlighted breaker block that accurately aligns with an IFVG as well.
I am waiting for the price to fall into my area where I will monitor price's reaction, if we see signs of ejection from the highlighted areas, I wuld love to take a Buy Trade.
Entry= If rice enters the Breaker and IFVG and shows a good rejection.
SL= 23340
TP= Today's highs or 23700.
Manage your risk according toyour capital and only enter the trade if we happen to see a good rejection from the area. Be patient and don't hurry.
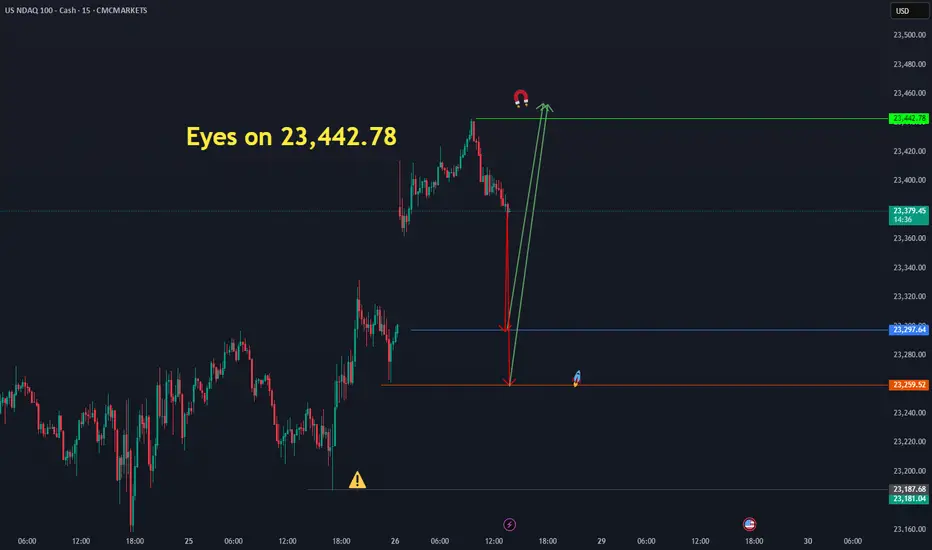
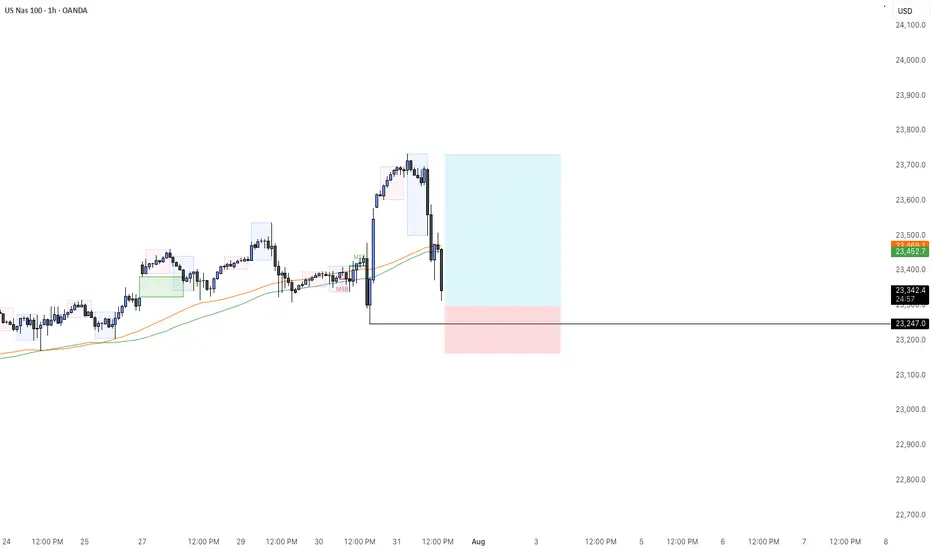
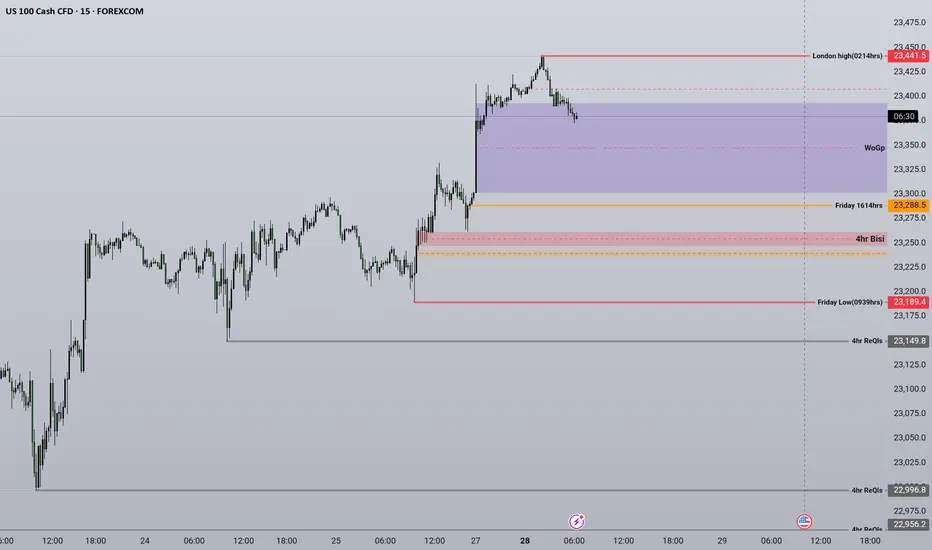
Eyes on 23,442.78 ( us 100 )The Nasdaq has the potential to move upward from the identified price levels of 23,297.64 and 23,259.52, targeting 23,442.78." CMCMARKETS:NDAQ100
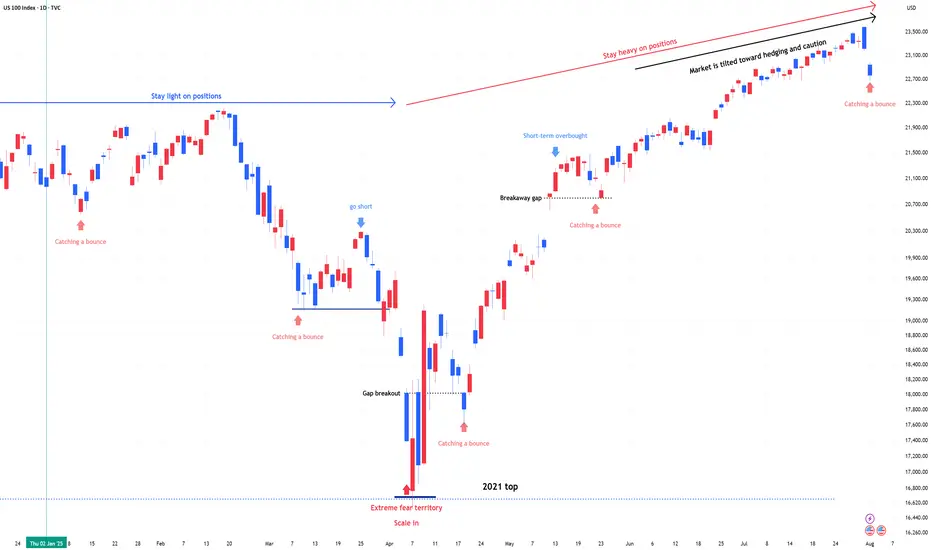
NDX & SPX , Stay heavy on positionsNDX & SPX , Stay heavy on positions (QLD, TQQQ)
Despite downside volatility, the trend remains intact. I’m maintaining the same view as before—this is still a zone to stay heavy.
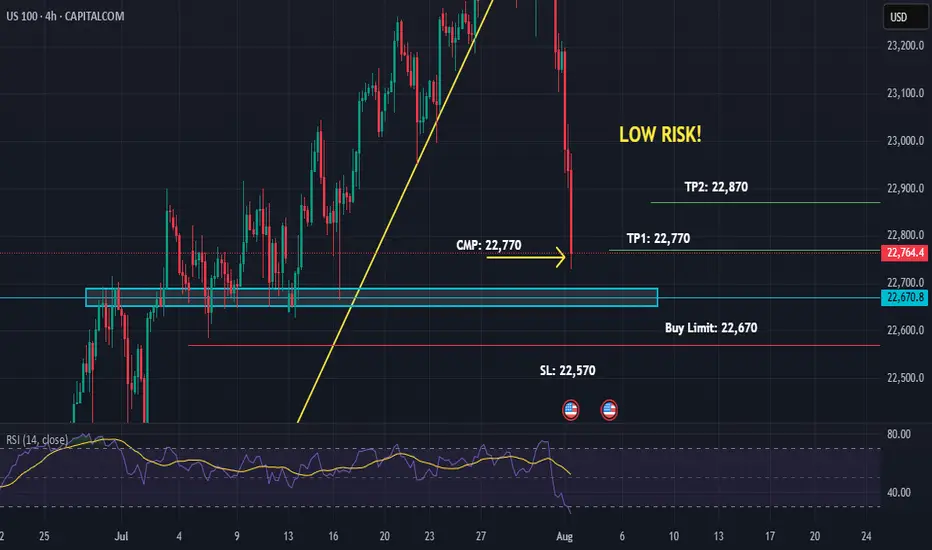
US100 Buy-Limit on Support 4HUS100 Buy-Limit on Support 4H
01-08-25
06:57 PM
Low Risk Trade because market is bearish!
NAS100 - BUYHuge drop as expected today. Now that we are reaching its key level of interest, I will wait for a buy confirmation to take our last nights highs.
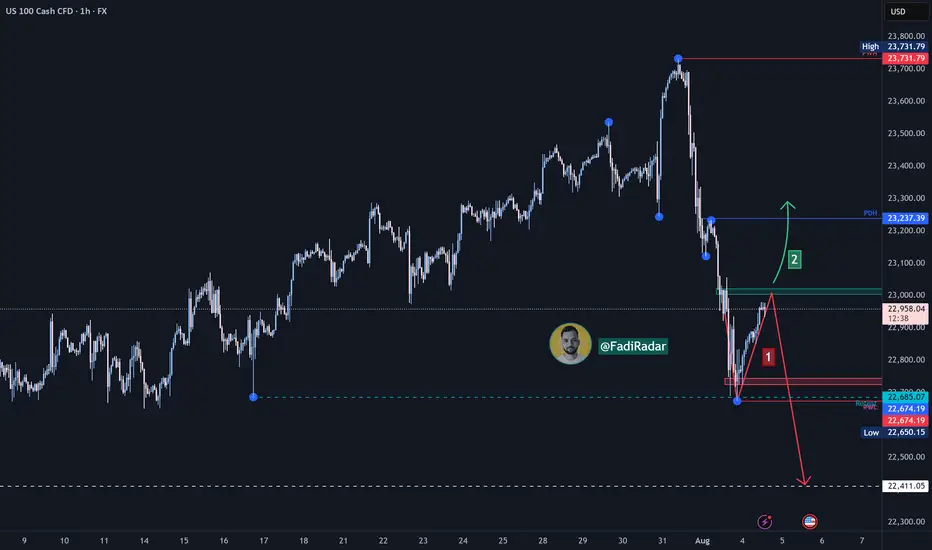
Nasdaq Index (US100 / NASDAQ) Technical Analysis:The Nasdaq index experienced a sharp drop last week, as expected, testing the 22,680$ level. Today, it's showing signs of a corrective move, currently trading around 22,950$.
🔹 Bearish Scenario:
If the price drops back to 22,680$ and breaks below it with confirmation, the next support could be 22,400$.
🔹 Bullish Scenario:
If buying momentum pushes the price above 23,000$, and it holds, we may see an extension toward 23,240$ and possibly 23,500$.
⚠️ Disclaimer:
This analysis is not financial advice. It is recommended to monitor the markets and carefully analyze the data before making any investment decisions.
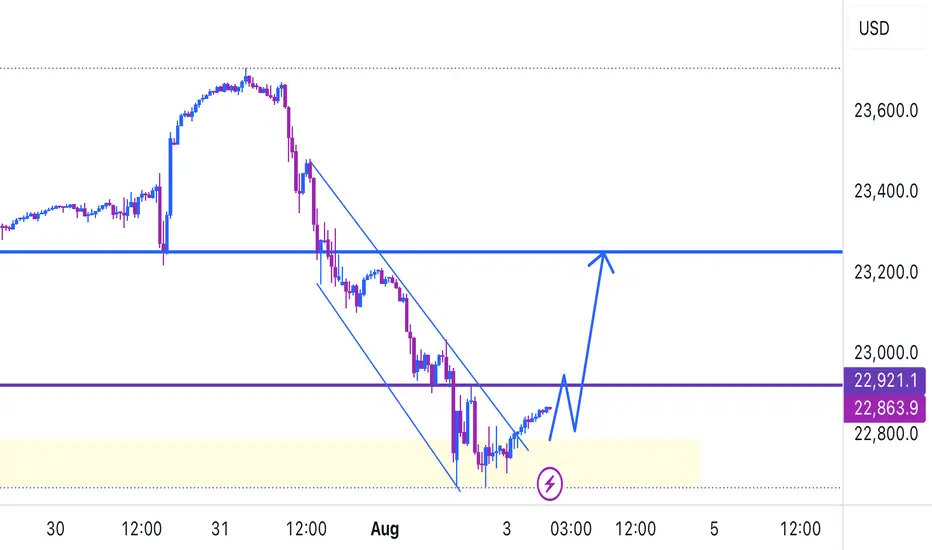
Us100 a strong buyUs100 broke out of your trendline, waiting for the market to retrace to your demand zone, and we can buy from there
Nasdaq is retracing to lower channal line.Nasdaq is retracing to lower channal line. This fall is attributed to Tarrif war.

Nasdaq faces a possible down 5-10/20% downturn.Overconfidence will foreshadow a correction. Risk posed by slowing growth in jobs, trade disputes and high valuations in growth focused companies in the index.
NAS100 - Stock Market Heading Down?!The index is trading in its medium-term ascending channel on the four-hour timeframe between the EMA200 and EMA50. However, if the index corrects upward towards the specified supply zone, it is possible to sell Nasdaq with better risk-reward.
In recent days and weeks, the Nasdaq Composite Index once again approached its historic highs, even setting a new all-time record. However, following the latest jobs data and the Federal Reserve meeting, the index experienced a price correction.
Unlike many previous bullish phases that were driven largely by short-term momentum or emotional reactions, the current upward trend in the Nasdaq reflects structural maturity and market stabilization. Institutional capital inflows and strong corporate earnings have together painted a picture of a more stable and predictable future for this index.
According to recent financial data, U.S. equity funds received over $6.3 billion in net inflows during the final week of July—marking the first positive inflow after three consecutive weeks of outflows.
The key engine behind this growth continues to be the robust performance of tech companies. Firms such as Meta, Microsoft, and AI-oriented companies like Nvidia and Broadcom posted exceptionally strong earnings reports. These results not only exceeded analysts’ expectations but also fueled significant gains in their stock prices, contributing to the Nasdaq’s momentum. Despite some sector-specific concerns—for instance, regarding Qualcomm in the semiconductor space—the broader tech sector has sustained its upward trajectory and even extended that momentum to adjacent industries, especially those involved in cloud and AI supply chains.
Meanwhile, advisors to Donald Trump revealed that he plans sweeping reforms at the U.S. Bureau of Labor Statistics (BLS). This announcement followed the July jobs report, which showed only 73,000 new jobs and sharp downward revisions to prior months’ figures.
On Truth Social, Trump accused the current BLS Commissioner, Erica McEnturfer, of politically manipulating employment data and ordered her immediate removal. Secretary of Labor Lori Chavez-DeRemer subsequently announced that Deputy Commissioner William Witrofsky would serve as acting head. Trump emphasized that economic data must be accurate, impartial, and trustworthy—and not politically skewed.
Following this leadership change, a broader debate has emerged around how employment statistics are collected and reported. While statistical revisions have long been a routine, non-political process since 1979, there are now growing questions about whether a better system for gathering and publishing this critical data could be developed.
As a nonpartisan branch of the Department of Labor, the BLS publishes its monthly employment report at 8:30 AM Eastern on the first Friday of each month. The data is gathered from surveys of around 629,000 business establishments.
Analysts have cited several reasons for the frequent need for revisions:
• Late responses from firms
• Delays from large corporations that distort preliminary figures
• Recalculations due to seasonal adjustments (e.g., holidays or weather)
• Demographic shifts impacted by immigration or deportation
• Annual revisions based on finalized tax records
With a relatively light economic calendar in the U.S. this week, traders have turned their focus to the latest developments in trade negotiations—particularly talks with countries that have yet to finalize trade agreements with Washington.
Although the U.S. has reached deals with key partners including the UK, EU, Japan, and South Korea, no formal agreement has yet been made with China to extend the current trade truce, which is set to expire on August 12.
The new U.S. tariff plan proposes a baseline 10% rate for most countries, but some—like India and Switzerland—face much higher rates of 25% and 39%, respectively. However, since implementation of the tariffs has been postponed until August 7, there’s still time for further negotiations and possible rate reductions. Sources close to the White House suggest the administration is eager to continue talks.
What’s now becoming clear is the sheer magnitude of the proposed tariff shifts—far beyond pre-trade-war averages. These changes could have more severe consequences than previously estimated, potentially pushing up U.S. inflation while simultaneously threatening global growth. As such, markets may be entering a fresh wave of volatility.
Compounding these concerns is the U.S. Treasury’s upcoming bond issuance schedule, which could add to market instability.
Also on the radar is the ISM Services PMI for July, due Tuesday. Its results will be closely watched for signs on the U.S. dollar’s direction and the Fed’s potential actions at its September meeting.
Notably, as of July 18, 2025, the widely-followed Buffett Indicator—measuring the ratio of market capitalization to GDP—was 2.3 standard deviations above its historical average. This level surpasses even the dot-com bubble era of the early 2000s. The indicator is now firmly in the “overvalued” zone, which often precedes market corrections or even crashes. For context, during the 2008 financial crisis, it was roughly 1.5 standard deviations below the historical norm.

UPDATEFriday we closed on the breakeven after that the price reached our 50% level of the trade, so our TP was raised to the breakeven.
Follow for more trades to catch up the next week!

NAS100 MAY FORM THE BEARISH HEAD AND SHOULDERS.NAS100 MAY FORM THE BEARISH HEAD AND SHOULDERS.
NAS100 has been trading sideways since the beginning of the week, forming local highs with lows staying at same price for the most part. The price seem to form the Head and Shoulders reversal pattern
What is a Head and Shoulders?
A Head and Shoulders pattern is a reversal chart pattern signaling a potential trend change. It consists of three peaks: two lower "shoulders" and a higher "head" in the middle, connected by a "neckline" (support level). A bullish (inverse) Head and Shoulders forms at a downtrend's end, signaling an uptrend; a bearish Head and Shoulders forms at an uptrend's end, signaling a downtrend.
Currently the SMA50 is pushing on NAS100 from above, while SMA200 is supporting the price. In case the SMA200 on 30-m minutes timeframe gets broken, we may see the decline towards 23,200.00 support level.

OUR TRADE TODAY ON NASDAQBeen a while since I last posted here, today I’m sharing with you our trade we took 15min ago with an RR of 3
Follow for more

Nasdaq Index Analysis (US100 / NASDAQ):The Nasdaq index continues its medium- to long-term uptrend and has recently reached a new high at 23,466 USD.
1️⃣ A break and close below 23,200 USD could lead to a pullback toward 23,000, followed by 22,920 USD.
2️⃣ However, if the price holds above 23,330 USD, further bullish continuation is expected, potentially leading to a new all-time high.
⚠️ Disclaimer:
This analysis is not financial advice. It is recommended to monitor the markets and carefully analyze the data before making any investment decisions.

Weekly UpdateBased on how the previous weeks have been running, closing bearish is my anticipation looking into the new Month. Today i will sit out and observe.
"NASDAQ 100 Heist – Scalp, Swing, or Hold? (Full Plan)🔥 NASDAQ 100 HEIST PLAN – BULLISH LOOT AWAITS! 🔥
🚨 Attention Market Robbers & Money Makers! 🚨
(Swing/Day Trade Strategy – High-Risk, High-Reward Play)
🎯 Mission Objective: Loot the NDX100/US100 (NASDAQ 100) Like a Pro!
Based on Thief Trading’s ruthless technical & fundamental analysis, we’re executing a bullish heist—targeting the Red Zone (high-risk, high-reward area).
⚠️ WARNING: Overbought market, consolidation zone, potential bear traps—weak bears may get slaughtered! Strong hands only!
🔐 ENTRY: The Vault is OPEN!
"SWIPE THE BULLISH LOOT!" – Any price is a steal, but smart thieves use:
Buy Limit Orders (15m-30m TF) near recent swing lows/highs.
DCA/Layering Strategy – Multiple limit orders for max loot.
Breakout Confirmation – Don’t jump in early; wait for the real move!
🛑 STOP LOSS: Protect Your Stash!
Thief’s SL Rule: Nearest 4H swing low (22,600) – WICK LEVEL ONLY!
DO NOT place SL before breakout! (Patience = Profit.)
Adjust SL based on risk, lot size, and number of orders.
🎯 TARGETS: Escape Before the Cops Arrive!
Main Take-Profit: 24,400 (or exit early if momentum fades).
Scalpers: Longs ONLY! Use trailing SL to lock in profits.
Swing Traders: Ride the wave like a true market pirate!
📰 FUNDAMENTAL BACKUP: Why This Heist Will Work
Bullish momentum in NDX100 driven by:
Macro trends (Fed, inflation, tech earnings).
COT Report & Institutional positioning.
Geopolitical & Sentiment Shifts.
Intermarket correlations (USD, Bonds, Tech Sector).
(Stay updated—markets change FAST!)
⚠️ TRADING ALERT: News = Danger Zone!
Avoid new trades during high-impact news.
Trailing SL = Your best friend.
Lock profits early if volatility spikes!
💥 BOOST THIS HEIST! 💥
👉 Hit LIKE & FOLLOW to strengthen our robbery crew!
🚀 More heists coming soon—stay tuned, thieves! 🚀

Possible direction bias on Nas100FX:NAS100 Now the price is still uptrending and those that think the price is high and want to sell might get their ass wipe. After the break of the current high, I expect a pullback to sweep the LIQ of the low that cause the break and then continue to the upside.