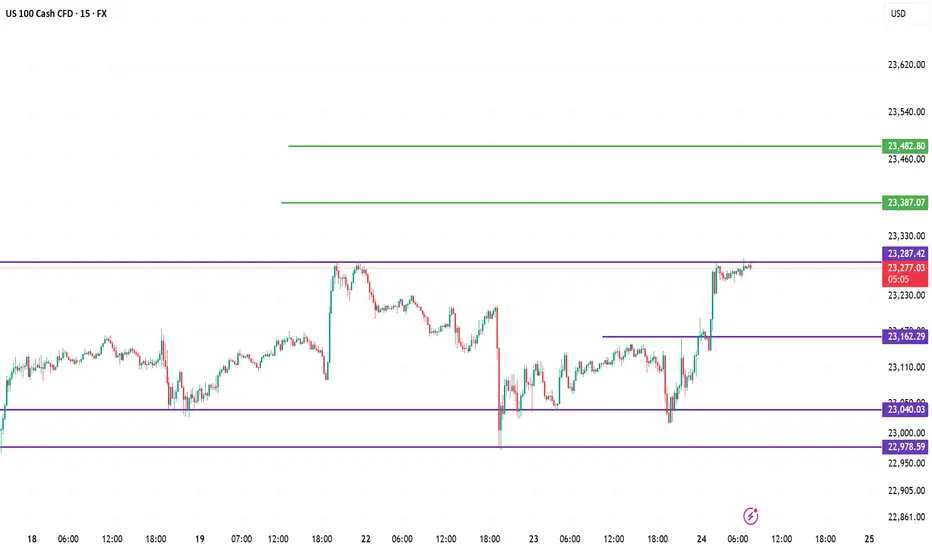
US100 Analysis Report (15m Chart)1. 🔍 Liquidity Grab (Sell-side taken)
Price swept below 23,040 and sharply reversed from 22,978, clearing out weak sellers.
2. 📈 Break of Structure (BOS)
A bullish BOS occurred after price broke above 23,162, confirming short-term bullish intent.
3. 🟪 Rejection Zone
Price is now testing 23,287.42 — a supply/resistance zone. Watch for signs of rejection or breakout.
4. 📊 Bullish Scenario
If price breaks 23,287 cleanly, expect next moves towards 23,387 and then 23,482.
5. 📉 Bearish Setup Possibility
Rejection from 23,287 could pull price back to 23,162 or 23,040 before the next move.
NDAQ100 trade ideas

NSDQ100 another bullish flag developing ?Donald Trump has agreed a new trade deal with Japan, setting 15% tariffs on US imports like cars and launching a $550 billion fund to boost investment in the US. This is lower than his earlier 25% tariff threat. Other allies saw mixed outcomes—the Philippines got a small tariff cut, while Canada’s talks stalled. Goldman Sachs now expects the US baseline tariff rate to rise to 15%.
Trump also suggested that Fed Chair Jerome Powell may not stay in his role much longer, and he’s considering removing capital gains tax on home sales, which could affect the housing market.
Separately, a Chinese-linked cyberattack breached the US nuclear weapons agency, though no classified data was stolen. Meanwhile, SpaceX’s investor documents flagged Elon Musk’s political activity as a potential risk as the company targets a $400 billion valuation.
Conclusion for Nasdaq 100:
The Nasdaq 100 faces short-term uncertainty due to rising trade tariffs, Fed leadership questions, and geopolitical risks. While some US-focused investments could benefit, traders should stay cautious as policy and global tensions evolve.
Key Support and Resistance Levels
Resistance Level 1: 23265
Resistance Level 2: 23670
Resistance Level 3: 23480
Support Level 1: 22953
Support Level 2: 22840
Support Level 3: 22740
This communication is for informational purposes only and should not be viewed as any form of recommendation as to a particular course of action or as investment advice. It is not intended as an offer or solicitation for the purchase or sale of any financial instrument or as an official confirmation of any transaction. Opinions, estimates and assumptions expressed herein are made as of the date of this communication and are subject to change without notice. This communication has been prepared based upon information, including market prices, data and other information, believed to be reliable; however, Trade Nation does not warrant its completeness or accuracy. All market prices and market data contained in or attached to this communication are indicative and subject to change without notice.

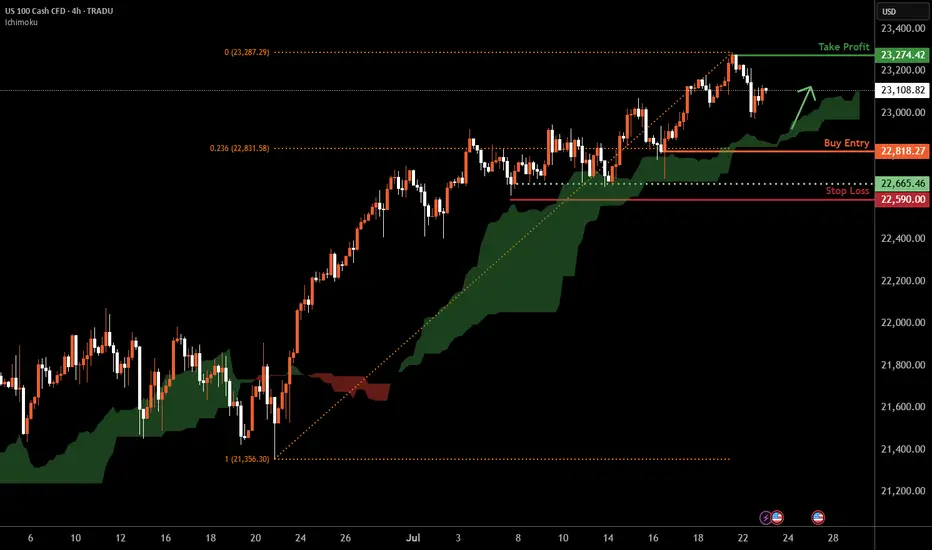
Nasdaq-100 H4 | Bullish uptrend to extend higher?The Nasdaq-100 (NAS100) is falling towards a swing-low support and could potentially bounce off this level to climb higher.
Buy entry is at 22,818.27 which is a swing-low support that aligns with the 23.6% Fibonacci retracement.
Stop loss is at 22,590.00 which is a level that lies underneath a multi-swing-low support.
Take profit is at 23,274.42 which is a swing-high resistance.
High Risk Investment Warning
Trading Forex/CFDs on margin carries a high level of risk and may not be suitable for all investors. Leverage can work against you.
Stratos Markets Limited (tradu.com ):
CFDs are complex instruments and come with a high risk of losing money rapidly due to leverage. 66% of retail investor accounts lose money when trading CFDs with this provider. You should consider whether you understand how CFDs work and whether you can afford to take the high risk of losing your money.
Stratos Europe Ltd (tradu.com ):
CFDs are complex instruments and come with a high risk of losing money rapidly due to leverage. 66% of retail investor accounts lose money when trading CFDs with this provider. You should consider whether you understand how CFDs work and whether you can afford to take the high risk of losing your money.
Stratos Global LLC (tradu.com ):
Losses can exceed deposits.
Please be advised that the information presented on TradingView is provided to Tradu (‘Company’, ‘we’) by a third-party provider (‘TFA Global Pte Ltd’). Please be reminded that you are solely responsible for the trading decisions on your account. There is a very high degree of risk involved in trading. Any information and/or content is intended entirely for research, educational and informational purposes only and does not constitute investment or consultation advice or investment strategy. The information is not tailored to the investment needs of any specific person and therefore does not involve a consideration of any of the investment objectives, financial situation or needs of any viewer that may receive it. Kindly also note that past performance is not a reliable indicator of future results. Actual results may differ materially from those anticipated in forward-looking or past performance statements. We assume no liability as to the accuracy or completeness of any of the information and/or content provided herein and the Company cannot be held responsible for any omission, mistake nor for any loss or damage including without limitation to any loss of profit which may arise from reliance on any information supplied by TFA Global Pte Ltd.
The speaker(s) is neither an employee, agent nor representative of Tradu and is therefore acting independently. The opinions given are their own, constitute general market commentary, and do not constitute the opinion or advice of Tradu or any form of personal or investment advice. Tradu neither endorses nor guarantees offerings of third-party speakers, nor is Tradu responsible for the content, veracity or opinions of third-party speakers, presenters or participants.
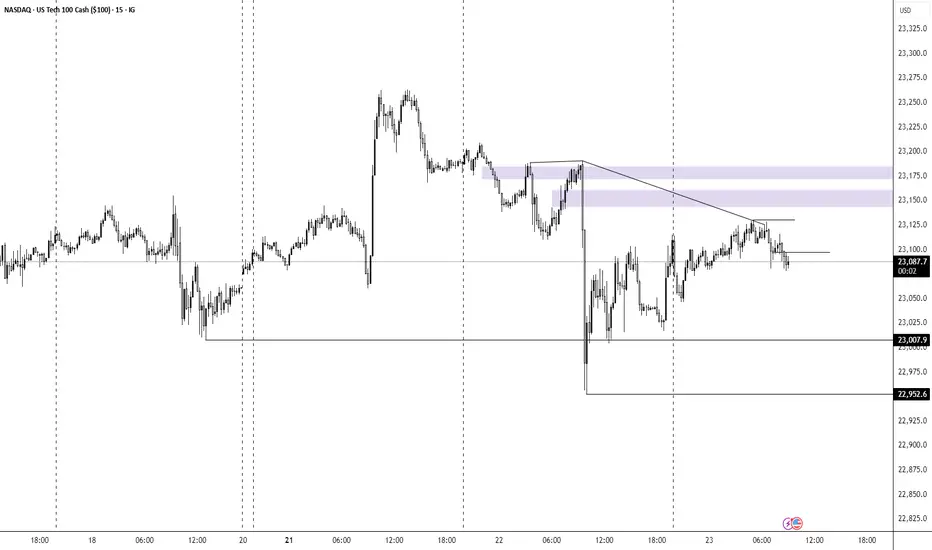
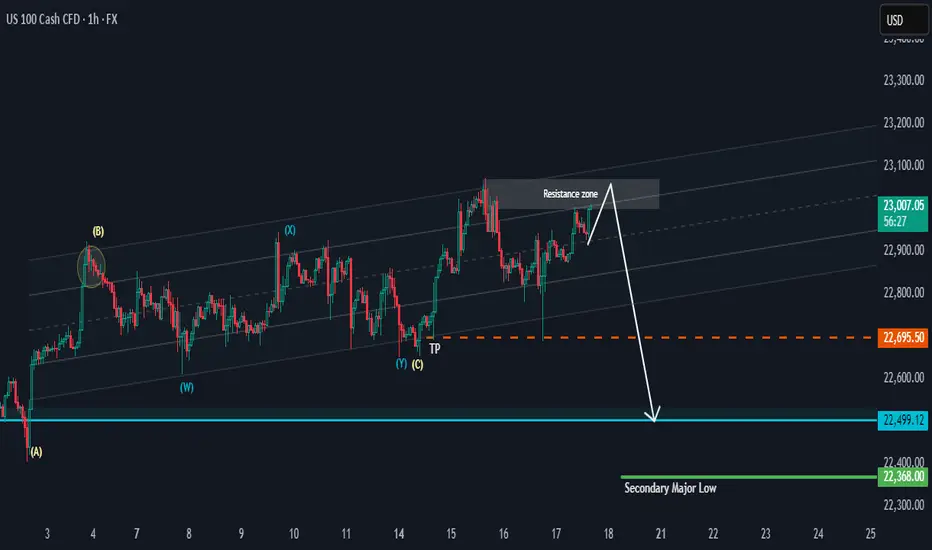
NAS 100 Potential PullbackHi there,
NAS100 has the potential to drop as it keeps testing the resistance zone in the range of 23100. This looks more like bull exhaustion than a reversal. The 22695.50 is the target for a bias of 22499.12
The overall bigger trend is bullish, with price highs aiming as far as 23717.44, 24837.28, and 26222.31, making this a potentially massive bullish trend, and it will take time to reach those highs.
Happy Trading, 🌟
K.
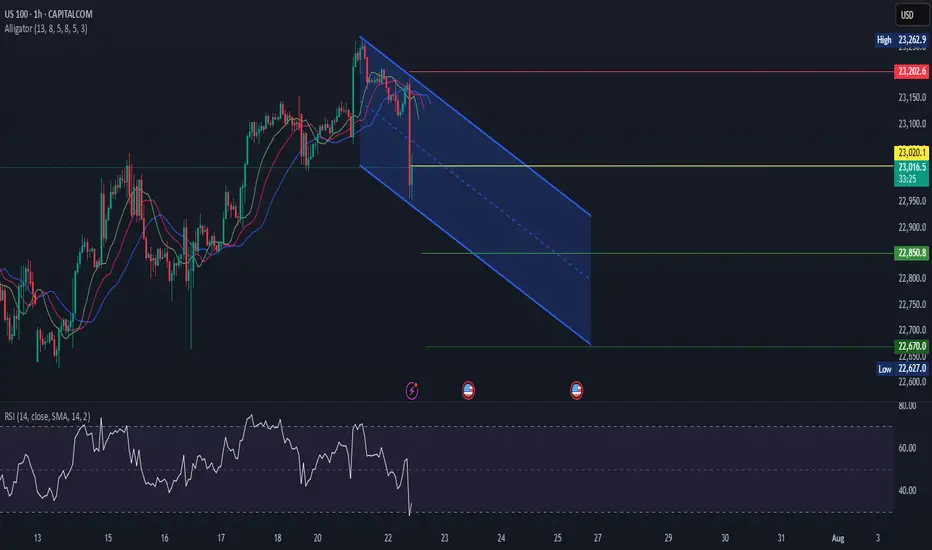
US100US100 is in bearish trend.
Printing LH and LL>
Bearish divergence also shown in RSI.
Alligator mouth open which indicates trend will go downward.
We sell at CMP.
NasdaqThis is 3-5 day buy setup. Followed by a M formation. Inside day formation
Great to scale in near High of day & low of the day after a clear detailed setup with confirmations.

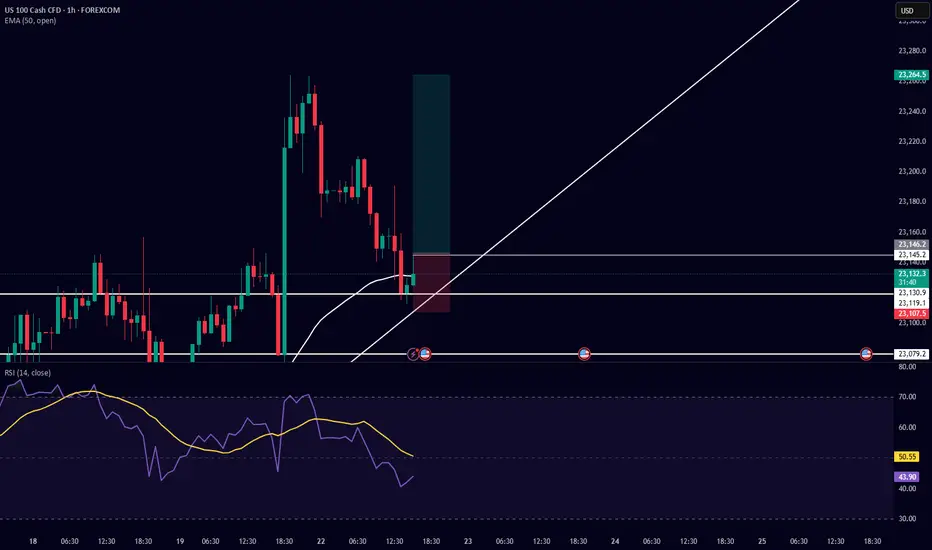
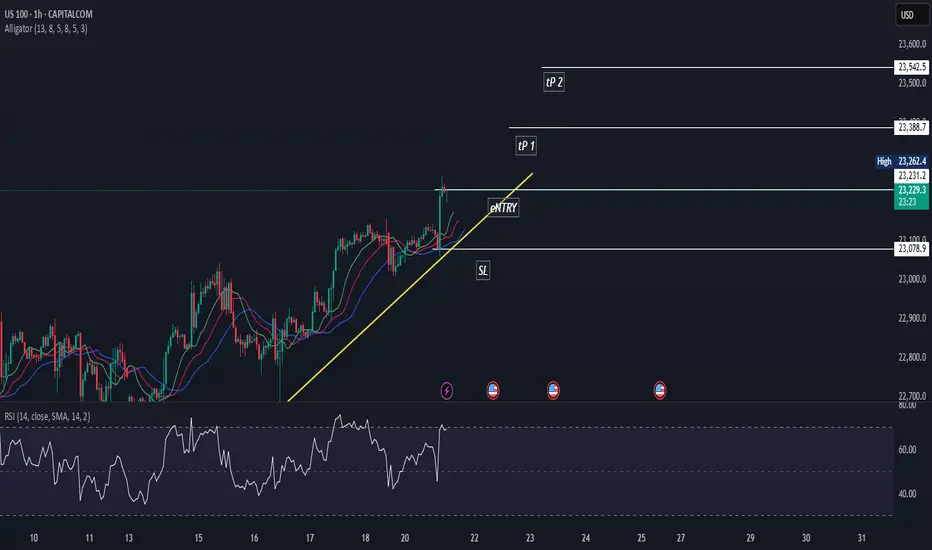
Trade Setup Description (Buy Side) – US100 (Nasdaq 100) 5-MinuteI am taking a buy-side trade on US100 based on the following confluences:
Support & Trendline Respect:
Price respected a horizontal support level near 23,079.2 and is currently bouncing from a rising trendline, showing potential for a bullish move.
Bullish Candlestick Reaction:
After testing the trendline, bullish candles formed, indicating buying interest at this zone.
EMA 50 Reclaim Potential:
Price is attempting to reclaim the 50 EMA (currently at 23,141.3). A successful break and hold above it would confirm bullish momentum.
RSI Confirmation:
RSI is currently around 47 and curving upwards, indicating a potential reversal from oversold/neutral territory. The RSI yellow moving average is also turning up.
Risk-Reward Ratio:
The setup has a favorable risk-to-reward ratio with the stop loss placed just below the trendline and recent wick low, and the target placed above the recent high around 23,264.5.
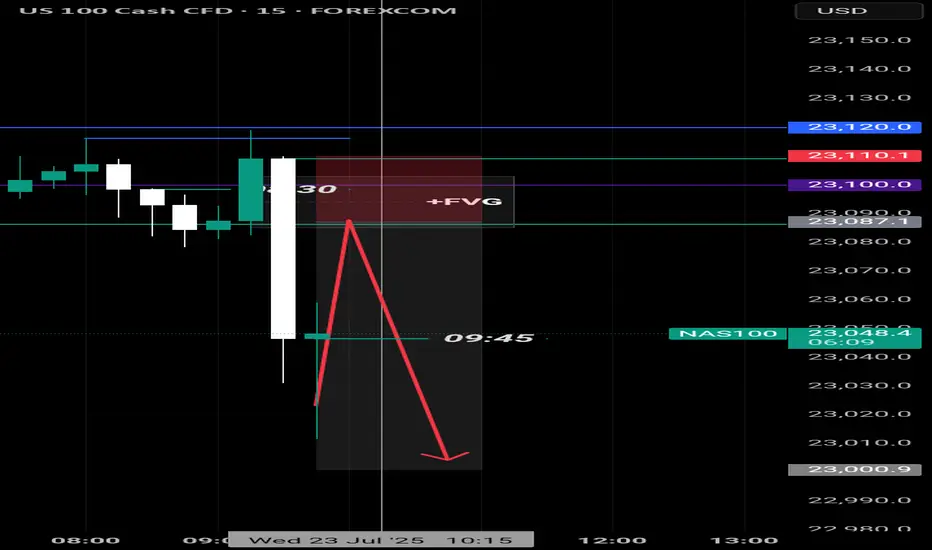
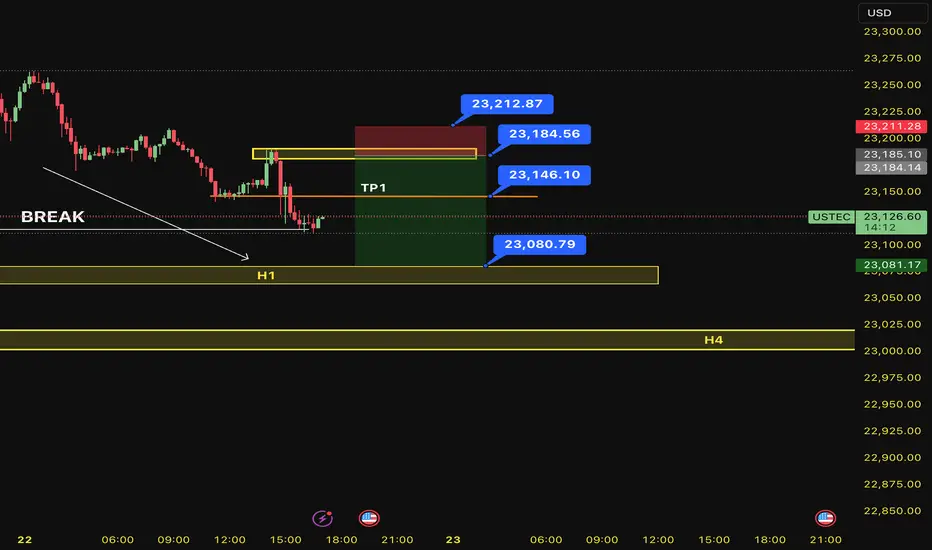
SELL USTEC 22.7.2025Confluence trade order: SELL at M15
Type of entry: Limit order
Condition:
- If the price break down THE LAST TOP confirming the down trend into H1.
Note:
- Management of money carefully at the price of bottom (23,146)
Set up entry:
- Entry sell at 23,184
- SL at 23,212
- TP1: 23,146
- TP2: 23,080
Trading Method: Price action (No indicator, only trend and candles)
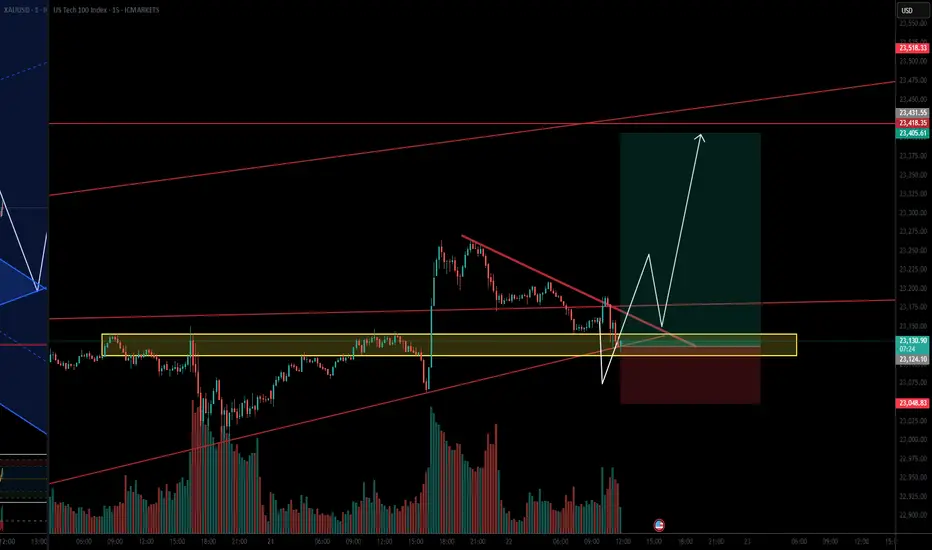
Straight into my SELL zone! NAS100A long into my sell zone, small lot, biggish SL..
I believe this will hit TP before the Powell speech, if both trades work out, it will be a great day!
good luck
NextGenTraders
US 100 (NDQ) : Stay Heavy on PositionsApril Fear & Buy Signals
In early April, the Nasdaq 100 experienced a sharp sell-off, triggering extreme fear sentiment across the market.
At that point, scale-in buy signals appeared—classic "buy the fear" conditions.
Markets swing between greed and fear—unless the whole country collapses. Right now, greed is taking the lead, but the real blow-off top volatility hasn’t even started yet.
Stay Heavy on Positions
Despite short-term uncertainty, I’m maintaining an overweight position on the Nasdaq 100.
As long as we don’t see a major breakdown, the bias remains bullish.

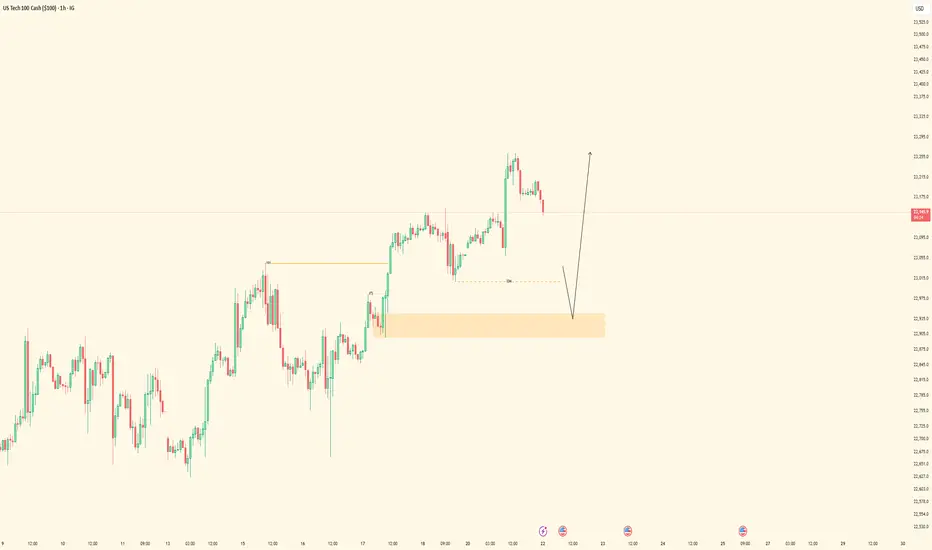
NAS100 - Bullish Setup BuildingPair: NASDAQ (NAS100)
Bias: Bullish
HTF Overview: 1H structure holding bullish after recent break of internal highs. Price pulling back toward a key demand zone.
LTF Confirmation: Waiting for price to mitigate the 1H Order Block, then drop to lower timeframes (15M → 5M) for confirmation entries.
Entry Zone: Watching for bullish reaction within OB, ideally paired with inducement or liquidity sweep before shift.
Targets: Short-term target is the next 1H high — extended targets align with overall bullish momentum continuation.
Mindset Note: Patience over prediction. Let price tap into the zone and confirm — don’t chase, just position smart.
Bless Trading!
I am 100 % short spy and qqq I am BULLISH DXY the chart posted is now setup for the cycle top On several cycles and we have just popped the Shiller p/e above 3866 second highest reading ever . Cycle are into a peak that was due 7/5 to 7/14 So why are we now turning down .? wait the energy from one of the largest solar storms is the time for the transition it is also a new moon . my spirals have called for the top as it did in 12/5 and 2/17 . I see a min drop of over 8 and could see well over 11.8 within the next 90 days . best of trades WAVETIMER

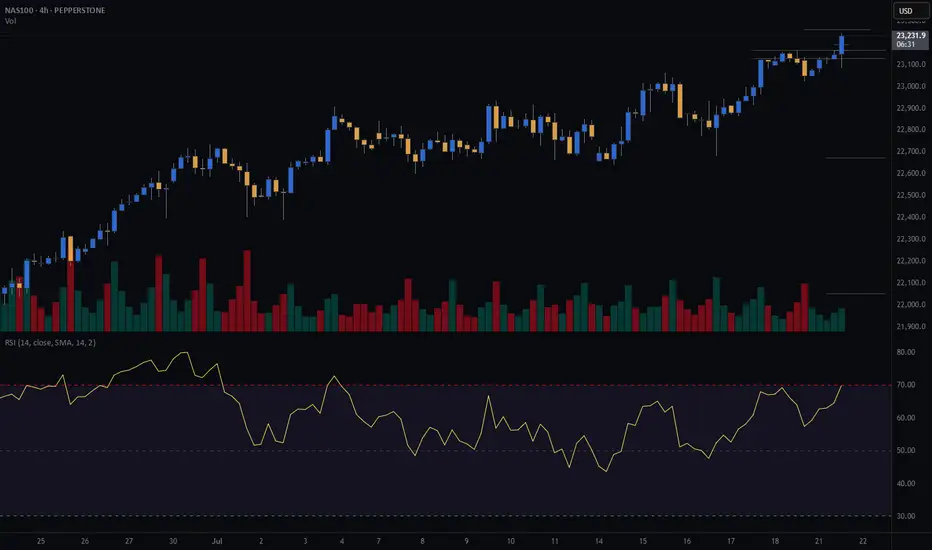
NASDAQ Rebounding on its 1H MA50.Nasdaq (NDX) rebounded today on its 1H MA50 (blue trend-line), third time since Friday's and Thursday's bounce. A Channel Up is emerging and based on the 4H RSI it is a medium-term bullish reversal off the Pivot trend-line, similar to June 20 - 30.
As you can see, that Channel Up targeted the 2.618 Fibonacci extension before breaking below the 1H MA50 to start a lengthy consolidation. Based on that, we are targeting 23650 (Fib 2.618 ext) on the short-term.
-------------------------------------------------------------------------------
** Please LIKE 👍, FOLLOW ✅, SHARE 🙌 and COMMENT ✍ if you enjoy this idea! Also share your ideas and charts in the comments section below! This is best way to keep it relevant, support us, keep the content here free and allow the idea to reach as many people as possible. **
-------------------------------------------------------------------------------
Disclosure: I am part of Trade Nation's Influencer program and receive a monthly fee for using their TradingView charts in my analysis.
💸💸💸💸💸💸
👇 👇 👇 👇 👇 👇

#NDQ - Monthly Targets: 23721.73 or 21387.86?Date: 03-07-2025
#NDQ - Current Price: 22641.89
Pivot Point: 22554.80 Support: 22276.15 Resistance: 22835.11
Upside Targets:
Target 1: 23028.36
Target 2: 23221.62
Target 3: 23471.67
Target 4: 23721.73
Downside Targets:
Target 1: 22082.06
Target 2: 21887.98
Target 3: 21637.92
Target 4: 21387.86

US100US100 is in strong bullish trend.
Alligator mouth is open which shows us trend will go further upward.
All sign shows that trend will continue.
We buy aT cmp.

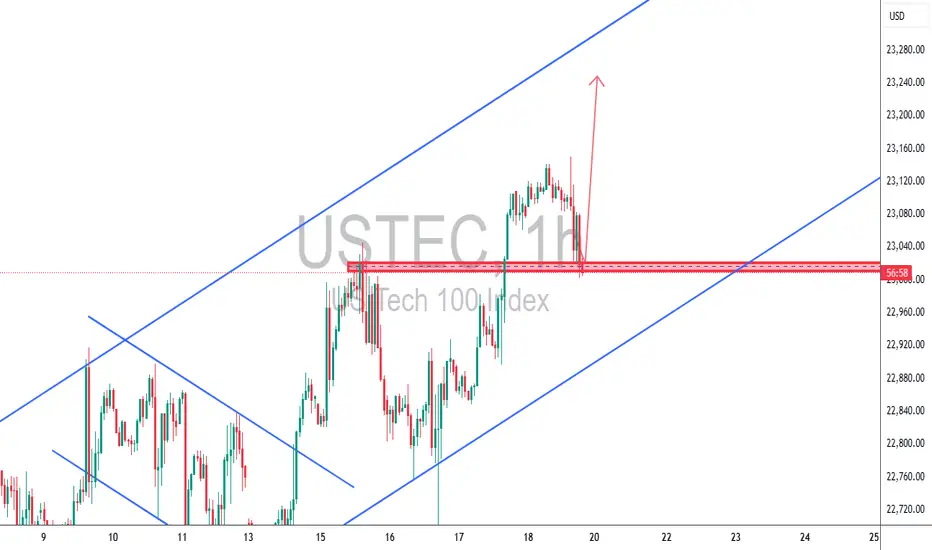
USTEC 1H – Bullish Continuation Play🔥 USTEC 1H – Bullish Continuation Play
Price pulled back into a strong demand zone and ascending channel support. We're in a clear bullish trend, and this retest offers a high-probability continuation setup.
✅ Demand zone confluence
✅ Previous resistance turned support
✅ Trendline + bullish wick rejection
✅ Clean structure with 1:3+ potential
🎯 Targeting 23,250+ while SL remains below 22,990
Strategy: TCB – Trend Phase (Pullback Entry)
Checklist Score: 100% ✅ A+ setup
Bias: Bullish – continuation expected
#USTEC #NASDAQ100 #US100 #TechnicalAnalysis #TCBStrategy #PriceAction #ForexTrading #IndicesTrading #SmartMoney #BreakoutTrading #TrendTrading #ChartAnalysis #BullishSetup #TradeIdeas #TradingView
Let me know if you want custom hashtags for XAUUSD, BTCUSD, USDCAD, or others.
NASDAQ (CASH100) SHORT - Double TOP H4Risk/reward = 11.3
Entry price = 23 190
Stop loss price = 23 270.4
Take profit level 1 (50%) = 22 674
Take profit level 2 (50%) = 22 053
All variables met, and entered the trade.
What is everyone's thoughts on shorting or longing cash100?
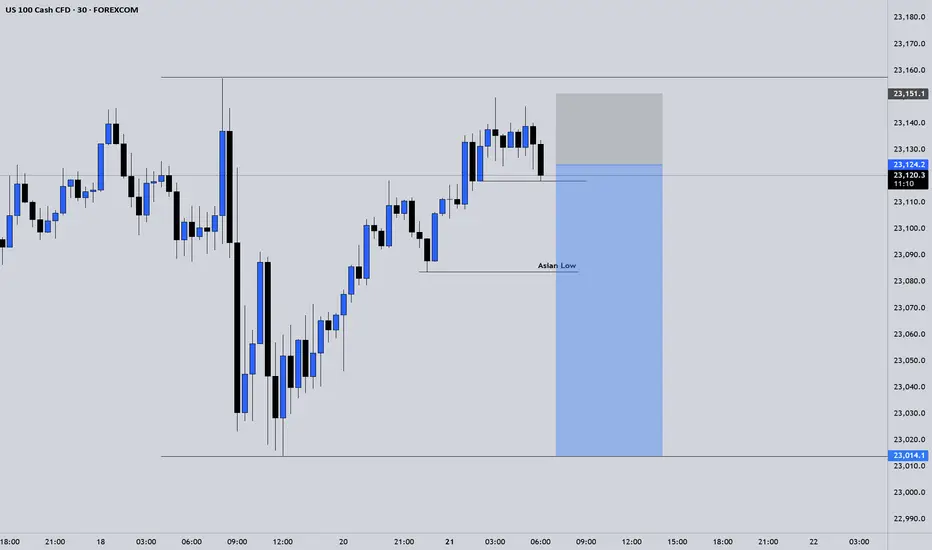
NAS100 | FLUSHPOINTNas1oo is pulling back into HTF keyzones, down below looking to catch sellers to the upside so trade is a bit riskier but we are looking for upside moves overally

Short NAS100Elite Discretionary Analysis
Executed trade on 30m
Price is rejecting the previous liquidity pool zone.
Targeting New York Low and CIC LP.