Bitcoin - Wave C is startingA lot of things about BTC is only clear in hindsight, so everyone is just predicting.
If you study Elliott Wave, the waves have so far been very perfect because BTC is a math model, but it is very hard to do it in real-time is because corrections can get complicated.
So at 48k, it is clear that price has retrace to the previous Wave 2. Unless we move up more, if not this tells us two things:
1) Nov 2021 to Nov 2022 is confirmed to be a 5-wave decline and not an ABC (big diff).
2) Wave 1 from Nov 2021 is an extension (nothing fancy about this).
These are clues that Wave C is just getting started.
Based on standard Wave C fib targets, CvsA or CvsB are unattainable as price will go negative.
The higher probability only one left is the 88.6% retracement level at 10k. 78.6% is at 16k which was already done.
Before bulls dunk on me, I am just a trader. Good if you have conviction to hold spot, but this level, it makes little sense to be long.
Never say never, because there are many unfilled CME gaps below. They may not always get filled, but mostly does.
My target is at 10k.
Just my view.
BTC1! trade ideas

Bitcoin CME gap.There was a gap left on the bitcoin CME futures chart. I expect this gap to be filled.
BTC Finally about to fill the CME GapI noticed this CME Gap since 2 months ago and with all the ETF news, I thought it would never reach it again, but it did lol

BTCCurrently, BTC is in an upward trend. Entry is at 42,000. Stop loss is 41,000 and take profit is 45,000.

🅱️ Bitcoin Enters Correction Based On Elliot Wave Theory (~20K)➖ We have a perfect 5 up wave bullish impulse pattern.
➖ After five up we get three down (ABC).
This is the main premise for the upcoming correction, together with the halving and the Bitcoin Merge but there is more.
See this chart:
This week ended on a very strong bearish candle, we will have a closer look soon. This bearish candle/session has the highest volume since November 2022, after the week of early November 2022, the 8-Jan-2024 session has the highest bear volume on CME Futures. This is a major bearish signal.
Now we have a chance to look closer at the current week, it turns out that the CME chart reveals more data than the spot chart, this is great... Let's proceed.
Ok... Follow me!
The highest close happened 4-Dec., this is the full green candle to the left.
The top of this candle is marked with a green line.
This week we have a large upper wick (buyers buying) but the real body is red (current price below open) and the session ends red (close below open).
The candle close happened below the open and close of the first week of January and also below the close of the early December week, meaning that we have a full rejection in place.
Match this with the previous Doji (indecision), the high bearish volume (bearish strength) and wave count (market cycle), this is all pointing lower.
The fact that we have the launch of a Bitcoin Spot ETF with more hype than the Ethereum Merge, we know the top is in because these events are used to sell.
Then we have related charts such as COIN crashing and even unrelated charts such as TSLA, Gold and the SPX.
The whole thing is screaming: Down!
Now, how far low it is very hard to guess at this point because prices still trade at or near the top.
My early assessment says around 25,000 to 20,000 but soon we will have more information... The ABC wave on the chart is only for illustration, the shape of the wave and actual levels can be quite different.
The correction will last for a few months maximum, 2-4 months.
The initial reaction can be ultra-fast and strong (within 1 month).
👉 After the 2024 Bitcoin halving, we will get sustained, long-term growth.
When the halving is in, it is time to go long.
The chart will let us know and I will be here for you... You can count on my support.
You have my support.
Thank you for reading.
Namaste.

Bitcoin Local Top is in Huge volume at the breakout of the range, candle closed as upthrust and price got rejected, Expect the market to downtrend for a long time short is the play

Below 40k?I'm observing Bitcoin's recent movements with a cautious eye as it teeters on the brink of falling below the $40'000 mark. I've noticed miners ramping up their selling, possibly adding downward pressure on BTC's price. While the technical indicators like the 200-day moving average show some positive signs, the overall market sentiment feels bearish. It's a tricky time, and I'm keeping a close watch on these developments, ready to navigate through this period of uncertainty and potential volatility in Bitcoin's price.

BTC - CME Chart Here is an update to this post where we predicted this move perfectly.
So far we have come up for price to fill the gap and test our old support as new resistance. If this trendline holds as resistance our technical measured move is around $38,810 even though I think we will go a little lower based on other trendline and targets.

BITCOIN GAPS IN PERFECT LOCATION!!?! Still Bullish!There are 2 gaps on the #CME that will most likely get filled.
A short move up to fill the most recent gap , then a move down to fill the gap around $39500.
This will still keep #Bitcoin in an HTF uptrend.
Calculate Your Risk/Reward so you don't lose more than 1% of your account per trade.
Every day the charts provide new information. You have to adjust or get REKT.
Love it or hate it, hit that thumbs up and share your thoughts below!
This is not financial advice. This is for educational purposes only.

Another on the $ $BTC callWe are not trying to toot our own horn with this post.
There have been a few accounts that were warning about a CRYPTOCAP:BTC top.
HOWEVER, they've been saying it for some time. Broken clock is also right daily.
We began to warn few days BEFORE the #BTC melt down.
48k target, like we stated, was likely a short term top.
We rang alarm bells on the 9th & WARNED on 11th.
Another $ call on #Bitcoin.
BTC1!15% off ETF highs
Seemingly most convinced prices less than 40k are coming...
I'm unironically thinking "MID" of the whole move might be low, even if only to chop from MID to 618 and back till halving...

BTC - Short Term AnalysisOn the Left is the CME chart and on the right is a spot chart.
We did open with a gap on CME and that gap almost always get filled. That gap is between $42,365-$43,425. If price goes up to fill that gap it would also be testing our white line of old support that could be flipped into new resistance.
With the spot chart, we see BTC has created railroad tracks upon the open. This occurs when price closes and instantly reverse upon the open. Currently, we have seen these railroad tracks form on every timeframe from the 1min to the 1 week. As long as the low holds we should be able to reach the CME gap with this pattern.

🅱️ 6X Lev Bitcoin SHORT (239% Potential | Adults Only)Let's try again, the previous one was obviously too early.
These are what I call "trade-numbers".
➖ The bold levels are the first stop.
➖ It can go as low as 20K on a wick.
➖ It can take months to fully develop.
➖ Initially it can go fast.
_____
Leverage: 6X
Buy-in: $41,000 - $44,000 | Cp: $42,440
Targets:
1) $40,000
2) $37,500
3) $35,000
4) $32,600
5) $30,000
6) $27,000
7) $25,500
Stop-loss: Close daily above $46,000
Potential profits: 239%
Capital allocation: 5%
____
Disclaimer: Leverage trading is high risk and for adults only. Adults are responsible for their own actions.
Some trades can be a success (win), others can fail (a loss), this is normal.
If you cannot take a loss, then you cannot trade nor do anything in life because losing is part of the game. Making mistakes is part of the game, it is just the way we learn and grow.
I am wishing you success truly.
I am hoping you can achieve your goals.
Do your own research.
Thanks a lot for your support.
I love you 😁
Namaste.

Short BTC before halving BTC before halving have to fill the Gap of CME monthly resistance could stop bullish movement after that the market need to liquid some of short positions around 50 k

BTC big expectancy of free fall againHello
Dear BTC buyers holders, pay attention I see that BTC has some signs of going down:
1- A strong reversal candle in weekly frametime is performing with huge voulume.
2- BTC had already accomplished its 3 correction important levels ( see my previous post) of
Fibonnacci retracement (38%, 50% and 61.8%)
3- The reached level of 48000 was expected more than 1 year as a maximum pick from where a
critical reversal point is would strat.
If BTC is agree with me it will go down until 32000 as a first .
Remember investors that I am not using a cristal ball but I try to be more rationnal whan i make my analysis.
Nb : take a look on my previous posts i listed down.
Break Away Gap(s)This chart shows breakaway gaps and the timing of when and if they can be close . The notion that gaps are always get closed applies to most of the gap types but break-away-gap that is reated by excessive buy or sell volume in the market.
The challenge with gaps is predicting the time __ time in the market is EVERYTHING.

Will Bitcoin ETF Tame BTC Like CBOE DidThis chart is still in play, I don't like the fact that the ETF approval, hasn't sent BTC. The weekly chart still show a bearish diversion, we still have 19 days left for the monthly candle if it doesn't close above the resistance... I'm shorting.

BTC schortI am of the opinion that a Bitcoin ETF will not have a positive impact on the price of Bitcoin. I believe that the price of Bitcoin will remain in the range of 20K to 80K for a long time. From late 2024 to 2027, I anticipate a significant but gradual increase in value.

send bitcoin down hereBitscoin hits resistance here
It is good time to dump it back to 32k here.
Price action is similar

Bitcoin bullish swing into the news!Tracking bullish setup on BTC.
Hard stop, target 55,000. Estimated time horizon 5 days.

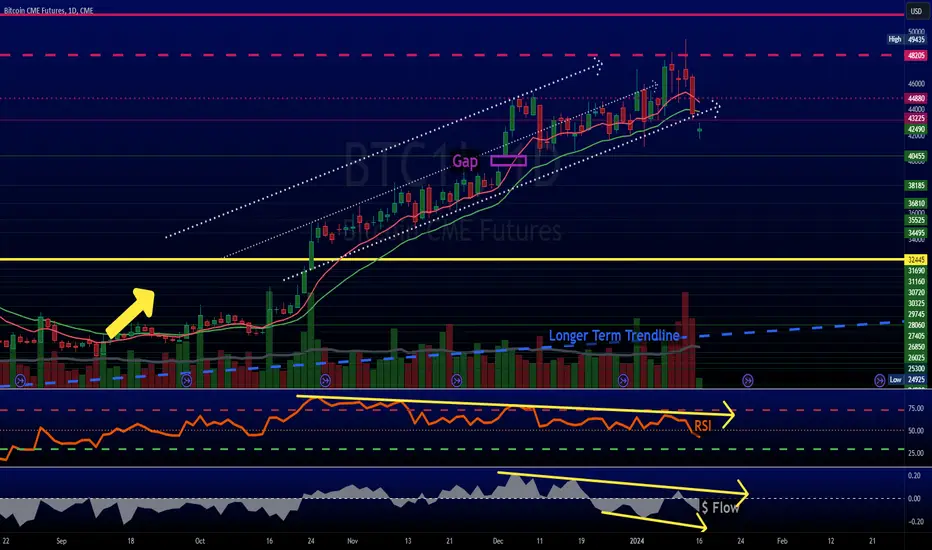
Bitcoin sending mixed signals but trend has been strongCRYPTOCAP:BTC has hit the 1st 24 target.
Volume has been a little mixed lately. Was more buying leading up to the last few days.
#BTC RSI & $ Flow indicators are diverging.
RSI holding 50 but going lower (middle).
$ Flow above 0 going higher (middle).
Weekly
#Bitcoin trend has been strong.
It has been overbought since October.
Monthly
Not overbought, that's RARE when it does happen.
More on this another day.

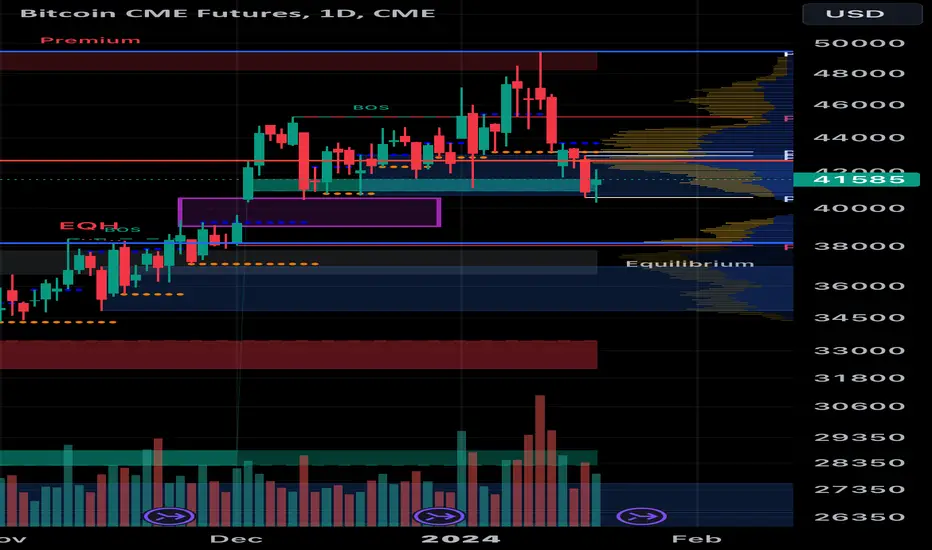
Bitcoin Pullback Imminent? The rally in Bitcoin futures has been impressive. But, without question, the rally is showing signs of fatigue. So the question is - are we gearing up for a pullback?
Technical Outlook :
Concurrent bearish divergence and a declining volume profile is a telltale sign of an impending correction. Why? Put simply, because all of the bulls are already in the market. Meaning that no new buyers bidding up the price. As a result, long liquidation pushes price lower. An initial operative target for a correction would be filling the gap from Dec. 1st and Dec. 4th between 40,390 and 42,500. While this correction would be significant, it may be necessary to sustain the longer-term bull trend.
Check out CME Group real-time data plans available on TradingView here: www.tradingview.com
Disclaimers:
CME Real-time Market Data help identify trading set-ups and express my market views. If you have futures in your trading portfolio, you can check out on CME Group data plans available that suit your trading needs www.tradingview.com
*Trade ideas cited above are for illustration only, as an integral part of a case study to demonstrate the fundamental concepts in risk management under the market scenarios being discussed. They shall not be construed as investment recommendations or advice. Nor are they used to promote any specific products, or services.
Futures trading involves substantial risk of loss and may not be suitable for all investors. Trading advice is based on information taken from trade and statistical services and other sources Blue Line Futures, LLC believes are reliable. We do not guarantee that such information is accurate or complete and it should not be relied upon as such. Trading advice reflects our good faith judgment at a specific time and is subject to change without notice. There is no guarantee that the advice we give will result in profitable trades. All trading decisions will be made by the account holder. Past performance is not necessarily indicative of future results.

FVG has been filledFollowing my last post of new creation of FVG on BTC daily, FVG has beed quickly filled yesterday to close gap
