GF1! trade ideas

FEEDER CATTLE FUTURES (GF1!) DailyThe Djinn Predictive Indicators are simple mathematical equations. Once an equation is given to Siri the algorithm provides the future price swing dates. The Djinn Indicators work on all charts, for any asset category and in all time frames.
Dates in the future with the greatest probability for a price high or price low.

FEEDER CATTLE FUTURES (GF1!) WeeklyDates in the future with the greatest probability for a price high or price low

FEEDER CATTLE FUTURES (GF1!) MonthlyDates in the future with the greatest probability for a price high or price low


Feeder Cattle: Strong Buy Signal on potential Golden Cross.Feeder Cattle is coming off a strong Higher Low rebound early this month with 1D already on strong bullish technical action (RSI = 60.454, MACD = 0.850, Highs/Lows = 3.0514). Since this bullish sequence started on a strong August rebound on the 128.800 1W Support, it is more likely to see an extension towards the 161.000 1W Resistance.
A potential 1D Golden Cross formation in October should come as validation of this just as it has done twice already since 2017. We are long on GF with 155.000 - 161.000 as our Target Zone.
** If you like our free content follow our profile (www.tradingview.com) to get more daily ideas. **
Comments and likes are greatly appreciated.

FEEDER CATTLE FUTURESJuly 22 i gave recommendation buy $127.25-$126.55 stop loss- $124.77 profit $134.77. Everything worked, stop loss in entry point waiting for profit

FEEDER CATTLE FUTURES, #FEEDERCATTLEFUTURES, #feedercattleBuy-$127.25-$126.55
Stop loss-$124.77
Profit-$134.77

there is still more drop For finishing wave 5 there is still more drop For finishing wave 5
if the price Breaks The 195.350 level The count will be invalidated.

Feeder cattle - time to long ?Feeder cattle had quite steep downtrend, however this chart on daily time frame seems very bullish, it´s typical P - profile (strong uptrend in 2017, then consolidation in 2018-2019). Support is very strong, but quite big, but price shouldn´t drop below 130.
COT is very bullish and there is big divergence at commodities spreads ( demand for FC is rising, but price goes down - that´s not usual and price should go up).
Feeder Cattle: Long term Buy opportunity.GF is trading on a 1W Ascending Triangle that is near the 139.225 Support and Higher Low zone (RSI = 46.649, MACD = -0.700, Highs/Lows = 0.0000). This creates ideal conditions for a long term buy towards 159.500.
** If you like our free content follow our profile (www.tradingview.com) to get more daily ideas. **
Comments and likes are greatly appreciated.

Position Solifiying Within Future Months - GF1!Considering the inclinated amount of oscillation over the last few months, there is implication to acknowledge the viability of generating sparatic movement towards either a bearish trend or bullish direction. (Patience is Key) Entry Point at Either 162.025 or 128.450.
Not Investment Advice. For Educational and Analytical Purposes Only. (Be Aware and Stick To Your Trading Itinerary).
-LionGate

The FUTURE High / Low swing dates for FEEDER CATTLE FUTURESAny asset. Any market. Any time frame.
Any questions?
The future belongs to the Djinn.

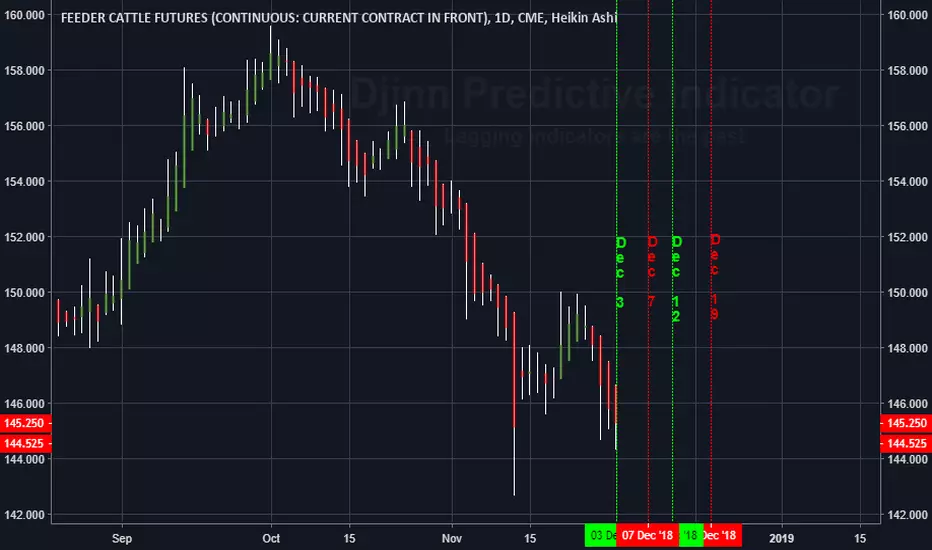
The FUTURE High / Low price swing dates for GF1! (Feeder cattle)These are the FUTURE dates for GF1! with the highest probability for experiencing a price
swing high or low. Apply your own indicator(s) to determine the price swing direction.
The Djinn Predictive Indicator is for sale. Purchase includes Monthly, Weekly, Daily, 4 hour, 1 hour, and 15 minute prediction equations. Training and unlimited follow up support.
Price: 10,000,000 XRP. Bitcoin or Fiat not accepted. I will reluctantly accept Monero. If
the purchase is made in Monero the price is double the 10,000,000 XRP asking price at the at the time of purchase.
Payment must be sent directly to my hard wallet.
The FUTURE High / Low price swing dates for GF1! (Feeder Cattle)These are the FUTURE dates for GF1! (Feeder Cattle) with the highest probability for experiencing a price swing high or low. Apply your own indicator(s) to determine the price swing direction.


Long term setup within the 1W Channel Up.Feeder Cattle (GF1!) is trading within a long term 1W Channel Up (RSI = 63.368, B/BP = 10.8420) on a very stable pace setup (MACD = 2.490, Highs/Lows = 3.4700) that allows us for a better pattern recognition. If those recurrences are valid, the GF should seek a Higher Low near 155.000 before making a Higher High near 164.000 (target).

1D Channel Down. Short.Feeder Cattle is trading within a Channel Down on 1D (MACD = -0.360, Highs/Lows = -0.0614, B/BP = -1.7440). The neutral RSI = 45.095 suggests that it is coming off a recent Lower High, which as seen on the chart was at 151.500. We have opened short and our TP is 146.900 and 144.975 in extension (we will update if needed to pursuit the extension).

Feeder Cattle still correcting?Based on historical charts that are not completely provided by TV, Feeder has completed a 5 wave cycle and is correcting that cycle. Currently in the 4 of the C of the B of the ABC down. You can see I have put in the key points for the missing data. I also provided a snap shot of the full historical chart. im4.ezgif.com
Here is the TV historical chart with the missing data.
Future points and projections are not date specific just visually laid out but price is expected due to measurements.


GF!Positives
1) Weekly on a strong up trend
2) Daily is on a declining up trend
Negative:
1) RSI is above 50 (average gain > average loss) ,but this is declining
2) Negative momentum
Action:
Wait for :
1) a positive RSI above 50 ( this means average gain> average loss and increasing)
2) Prices are above the cloud ( this shows a strong Bullish short-term trend)
3) The green line (conversion) above Base line ( the signifies the the start or continuation of a short term uptrend)
4) Bar colored green ( beginning of an uptrend)
The above signifies the beginning of a short term up trend. But we need to check how long this can be sustained, so we check the weekly chart and check for the same set up. If the weekly said the same, then the trend is sustainable on the long term (at lease for the week). I would pay particular attention to:
A) the slope of the weekly RSI ( this shows sign of reduction in momentum)
B) Prices closing at the to 25% of the price range
I would just wait for things to line up before going long

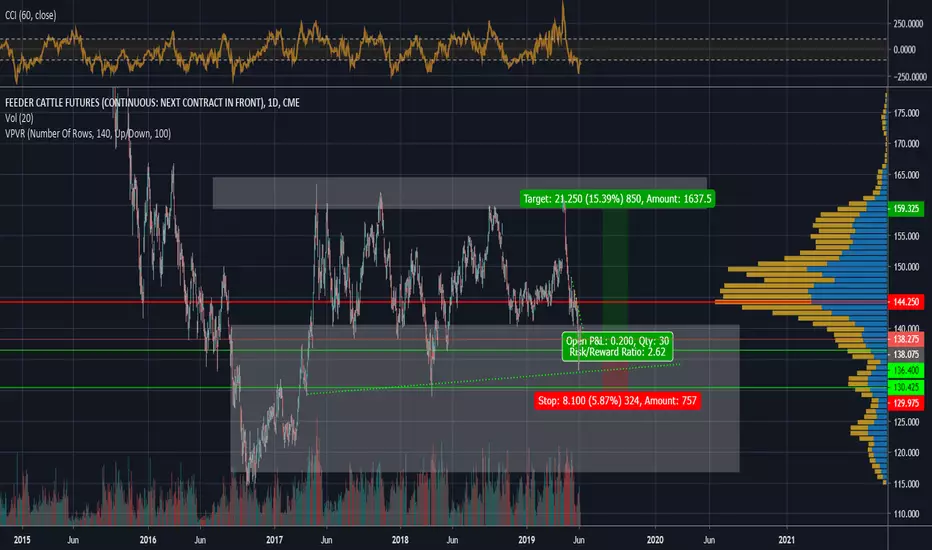
Short GF1Short Plan Fore GF(FEEDER CATTLE)
Downtrend channel is broken
Bearish Bat Pattern completed
Inside Bar breakout and pullback
Entry:149.200
Take Profit:138.775
Stop Loss 152.350

Hit Resistance. Short.Feeder Cattle (GF1!) hit a major 1W Resistance (149.75) and should reverse to test the 140.950 support. There is one last Resistance it may test however before falling, which is located at 151.925. We short with TP = 142.150.
