HE1! Continuous HogsContinuous Hogs- Weekly: The July Contract is driving the continuous chart. Uptrend lines off swing lows, and downtrend lines off swing highs. Creates areas to watch for action and reaction points All time high at 133.60, but we appear to be turning appropriately off the recent touch of the major uptrend line based off the 18’ low. Retracements can be used for support targets….
Further risk in the 75.00 – 70.00 area for 4th qtr Hogs around the 1st week of October
HE1! trade ideas

Lean Hogs Carry Higher as Price Approaches 361.8% Fib ExtensionLean hog prices have continued to surge higher. However, will negative divergences in the Relative Strength Index and MACD oscillators threaten the runaway rally? If not, the 361.8% Fibonacci extension may serve as the next technical barrier before targeting all-time highs.

Lean Hogs going higherIt is still not too late to buy Lean Hogs.
RSI is showing overbought conditions but there are no reversal patterns on the daily chart.

Lean HogzReports of Chinese ASF problems growing. Not clear the extent of the issue and until then continue to believe the US has not factored issues with ASF in China. This with the strong uptrend in prices recently supports a bullish outlook.

Building a higher base, but can it be sustainedTechnicals look okay. Seeing the narrative beginning to change out of China is making me question whether or not this higher base can be sustained. Chinese GDP forecasts have changed and are forecasting slower growth than most were expecting, however the market seems resilient to the fact. As a macro signal pay close attention to the offshore yuan. Although AFS is still in play a weaker yuan will add deflationary pressure to most commodities

Continuous HogsContinuous Hogs- Weekly: The chart is led by the February contract. The shaded areas represent the previous 5 years of price action the Feb contract had acting as the lead month of their represented year.
The parallel lines formed from multi pivots areas (swing highs or swing lows). Current cash contracts (Dec and now Feb) had consolidated on the down trending parallel in the 65.00 area with a recent attempt to break out above.
The neutral area (Gray box) has resistance at 70.80 and support at 61.00. **Attempt last week to break above fell short**
Opportunity area, or area of strength (Blue Box), is between 70.80 and 80.00 Risk area (Red Box) from 61.00 to 47.00

Bull FlagWas on a run and and a significant pull back
Pattern only valid at LE (long entry level)
Targets 2 (T2) are longer term
Trade safely
Just an observation


HEQ20-HEZ20I am adding another contract of this spread as the spread seems to be very strong. Everything shows, that Lean Hogs could start rise again so the spread should be making profit. 1PT could be around 7 points.

Soon to go LONG Lean Hogs near $38ish green target Re-testThis is merely an update of my historical chart showing much the same thing.
Good luck Traders & be safe!
End of ABC dwn, Re-test, small Gap fill visible on 5 min chart, 1.618 completion of larger Gartley pattern, etc
Currently Bearish but see Bullish entry in the days ahead

waiting for HEN2020-HEV2020 to entry There is a big potential for the gorwth of this spread. Normal price difference of those 2 contract months is 10 points. (1pt = 400$)
I will have eye on this spread since i see it as a huuge oportunity, which i do not want to miss.
SL could be set below the recent low: -4.7
PT could be: 5-10
As i already have some contracts of this spread, i will add another contract after the spread close above that indicated level.
I do not recommend to anyone to hold the position as i am doing, because i have a big account and many experiences to manage risk.
But who is looking for good trade, there could be one within days.
Good luck to everyone.

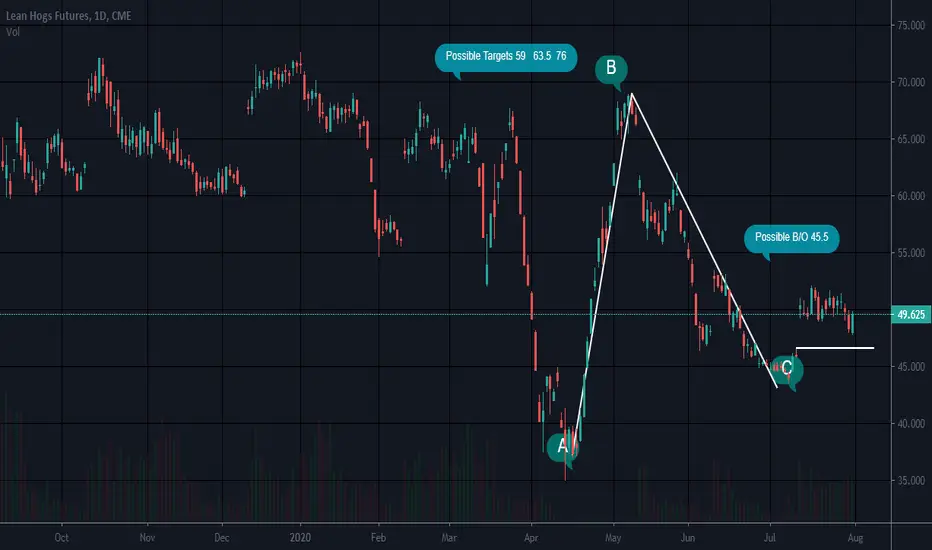
Went SHORT today Lean HogsI see this as the C leg dwn of an ABC or an ABC extension to the 1.27/1.618
I'm SHORT but looking to try a LONG likely at $42.25 ish
Two Gaps to fill below current $52.40 !!!
Wish you all luck trading!

HEN20-HEQ20 is about to explodeFinally i have found the correct spread to trade Lean Hogs bull spread. This seems much stronger than others and is closer to the market, which usually means bet on stronger demand in the near future. From the 15 years of history, the spread is usually trading around 2 points. There is a good potential to get to those levels again soon.

HEN20-HEV20Aggresive spread close to the market is set for seasonal growth. 15year averrage price of this spread is around 12 points. Therefore the price around 0 is way too low to let this spread go without us.
Entry: Once the %R will close above -80, entry the trade.
SL: SL can be set below the recent low
PT: Spread reached this year 8 points, so 1st PT should be about 8 points. The 2nd PT can be about 12 points, which is still very real.


HE1the market has broken level 1 fibo with force so there is a probability of going for level 1.61 fibo.
DISCLAIMER: As a trader you should consider your own risk:reward ratio and do proper lot sizing according to your margin and leverage level. Not every idea is a valid trade. This analysis is a trading idea, not a trading signal for you.

Lean Hogs, Fat Profits $HE_F"Lean Hogs, Fat Profits" is what we titled this chart in last week's institutional note. Prices have ripped nearly 60% in just two weeks and are now approaching our objective at the 38.2% retracement and 2H 2019 lows. $HE_F

LEAN HOGS FUTURES (HE1!) DailyDates in the future with the greatest probability for a price high or price low.
The Djinn Predictive Indicators are simple mathematical equations. Once an equation is given to Siri the algorithm provides the future price swing date. Djinn Indicators work on all charts, for any asset category and in all time frames. Occasionally a Djinn Predictive Indicator will miss its prediction date by one candlestick. If multiple Djinn prediction dates are missed and are plowed through by same color Henikin Ashi candles the asset is being "reset". The "reset" is complete when Henikin Ashi candles are back in sync with Djinn price high or low prediction dates.
One way the Djinn Indicator is used to enter and exit trades:
For best results trade in the direction of the trend.
The Linear Regression channel is used to determine trend direction. The Linear Regression is set at 2 -2 30.
When a green Henikin Ashi candle intersects with the linear regression upper deviation line (green line) and both indicators intersect with a Djinn prediction date a sell is triggered.
When a red Henikin Ashi candle intersects with the linear regression lower deviation line (red line) and both indicators intersect with a Djinn prediction date a buy is triggered.
This trading strategy works on daily, weekly and Monthly Djinn Predictive charts.
This is not trading advice. Trade at your own risk.

Bearish on Hog priceI read something today that caught my eyes.
The Tyson plant in Washington produces enough beef in one day to feed four million people, according to the company. It’s one of the few facilities in the northwestern U.S., with capacity of 2,300 cattle a day. Resuming operations is dependent on a variety of factors, including the outcome of team member testing and how long it takes to get results back.
“We’re working with local health officials to bring the plant back to full operation as soon as we believe it to be safe,” Steve Stouffer, head of Tyson Fresh Meats, said in the company’s statement. “Unfortunately, the closure will mean reduced food supplies and presents problems to farmers who have no place to take their livestock . It’s a complicated situation across the supply chain.”
I'm thinking if suppliers and farmers are stuck with too much supply, then price should be down.

Lean Hog FuturesWe live in interesting times...and as much as I try to remove my opinions from charting, I must on this one. I'm sure many will disagree with my chart as I have forecasted a 3 drive to a bottom out of thin air (in yellow). Facts are, we have completed a BIG ABC & did get a small bounce which tells me (more downside). If you take the ABC and extend it to a 1.27 fib you can argue for that being a finish line, and it may be. I take it a day at a time and look for entries with tight stops. I have not gone LONG yet but will near the $32 area as I see China being slow to purchase the agreed amount of agricultural product they committed to beginning April. Yak, Yak, Yak - I know it doesn't matter what I think, it matters when Buyers come in and Open Interest gets stronger.
If you see something different, let me know as I always love to learn....well, love to make money too.
www.cnbc.com

