Live Cattle FlagMayor Pattern: Weekly Broadening with False/Premature Breakout
Daily Pattern: continuation Flag, if confirmed first target could be the lower band of Broadening
LE1! trade ideas

LE1! next price targetin the chart for long time period at first step, simple cypher pattern exists. tow next price is explainable by shark pattern. the second price target is 160 $ and the third one is 181$. as you see in the chart price reacted to first price target perfectly. but with considering trading volume I can say it's just a retrace and second target is reachable.


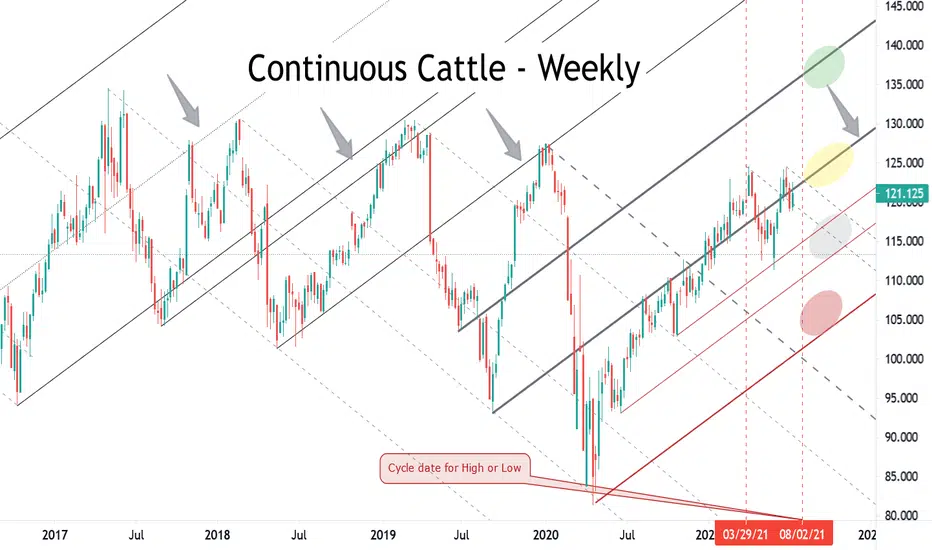
Continuous Live CattleWeekly Cont. Cattle: So far the Parallel uptrend line based off the 2019 low has proved to be a strong action/reaction line. The longer price holds to this line the stronger the bull run is. The Red uptrend line off 2020’s low must hold to continue a stable (potential bull) market for live cattle. Any of the lines on the chart could act as support/resistance (or action/reaction lines)
4th qtr risk in the 115.00 to 120.00 area. Further risk against the Red line at 105.00 to 110.00. Resistance is 130.00 to 135 area.
For the week ending 10/15: Resistance at 128.00, Support at 122.00 & 119.50

Continuous Live CattleWeekly Cont. Cattle: So far the Parallel uptrend line based off the 2019 low has proved to be a strong action/reaction line. The longer price holds to this line the stronger the bull run is. The Red uptrend line off 2020’s low must hold to continue a stable (potential bull) market for live cattle.
Any of the lines on the chart could act as support/resistance (or action/reaction lines)
4th qtr risk in the 115.00 to 120.00 area. Further risk against the Red line at 105.00 to 110.00. Resistance is 130.00 to 135 area.

/LE Breakout in live cattleResistance is broken, took the position. Will average up if will see that the trade is working. Shortage of food is coming to the store near you and most have no clue that it is coming. If you think that it is not possible, think again. Plywood at $100 was a fantasy not long ago. Get ready to pay $50 per pound for meat.

Brazilian cattle trend downCattles in brazil has got some direction of selling pressure... down trend

live cattle. do less bad things. I implore you.I have been doing some fasting recently. I haven't been doing it that much this year compared to usual, and it's a pretty misery inducing process, but I always feel pretty good when it's done. I just finished a 24 hour fast before posting this, and now I have the energy to mark up a chart and ask people to consume less. I have gone as long as 5 days back in the day, but I'm not in the same physical condition I was then, so I'm pretty happy with 24 hours in the present.
Fasting is really good for your health. Even if you can't accomplish the durations you were setting out for originally you will still reap some benefit.

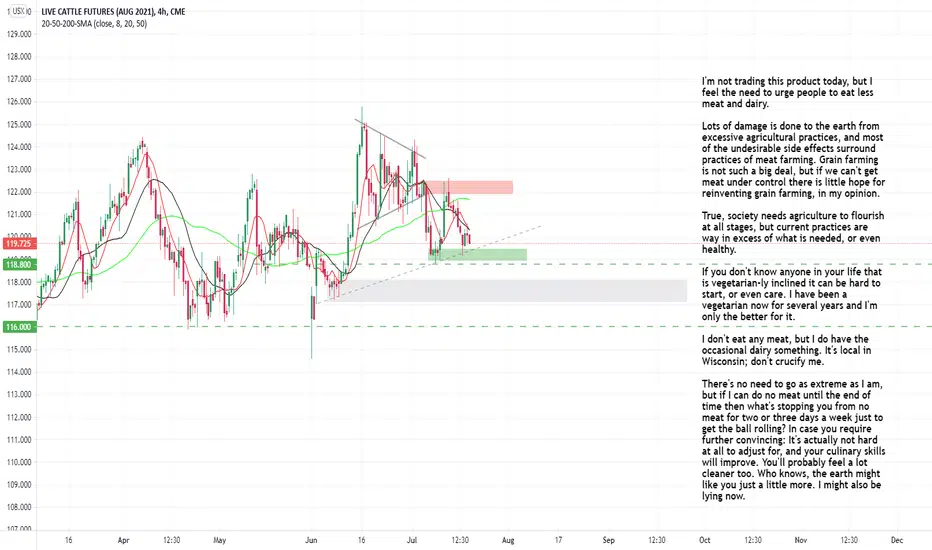
live cattle. pollute less. it couldn't be more serious.Consider what effect your lifestyle has on the planet. If you are reading this you are probably in the top percent of people contributing to climate change, therefore, you also have the most potential to help.
You could say these numbers are slightly skewed because of all the children in africa and india that are, lets just say, not contributing much to global warming. Don't let that make you feel better for too long, or you'll probably be one of them the next time around. I'll bet they know how to appreciate the little things a hell of a lot better than you and me.
------
Looks like price will be climbing higher, but I've marked out the major areas very plainly.

LE1! - Live Cattle Futures Looking BullishConsistent with commodities in general - cattle prices looking ripe for a move up.

leq21. live cattle. eat less meat, you're not a velociraptor.eat less meat. the world will continue to host human life for longer as a direct result. I'm operating on the assumption that prolonged human presence is a good thing. This is what optimism must feel like. I can hardly contain my joy.
Continuous CattleWeekly Cont. Cattle: So far the Parallel uptrend line based off the 2019 low has proved to be a strong action/reaction line.
**Cycle high/low targeted the week of 3/29 and appears to have done the job. Next cycle date will target the week of (or around) 8/02 to place a swing high or low….Range bound support is the gray bubble and resistance is the Yellow bubble. Outside risk is the red bubble and Outside resistance is the blue bubble. Will watch current front month charts for direction to fine tune targets.
Any of the lines on the chart could act as support/resistance (or action/reaction lines)
mastering elliot waves. whats lean cattle doing?Lean cattle, given the selection of m1 that I have chosen to focus my attention on, is showing Rule 7, condition c.
This is an unfortunate selection for the lazy-hearted. Rule 7 Condition c has a lot of extensions, and given the different circumstances could be labeled with an F3, L3, L5, or sL3. I still don't know what those mean, but I can draw some conclusions based off of how the author is writing that an "Irregular Failure Flat" is linked to L5's, "Contracting Triangles" are linked to L3's, "Expanding Terminal Impulses" are linked with :sL3, and "Running Corrections" are also linked to L5's somehow. Furthermore, I don't know what those terms mean, but I am confident that I haven't drawn any false conclusions. Why doesn't this book come with flashcards?
I can't label m1 all of these things. I will now choose the description that I think fits it most closely:
I selected ":F3" because -- if m1 takes the same amount of time (or less) as m0 or m1 takes the same amount of time (or more) as m2, despite any other circumstances, ":F3" is a good possibility; place ":F3" at the end of m1.
The other choices all needed too many things to be true for them to be the proper designation.
The next closest was an ":L3" designation. I discarded this idea because m2 was supposed to be sharper than m2 and it is not. m0 was very sharp on this one. This was the contracting triangle one, which I don't know what that means exactly, but it does break out of a triangle to the casual viewer.
What do you think would you place an F3 or an L3 at the end of m1?
-----------
Wow, this was a ton of work to come up with a shaky conclusion. Looks like I need to read ahead a little because I have no idea how F3 fits into anything anyways.
Here is the definition of (F3):
This structure label is the abbreviation for "First three (3)." An ":F3" either starts a series, occurs after an "x:c3" or is found between two ":5's" (all variations). If you find two ":F3's" next to each other, a new pattern (of a smaller magnitude) begins with the second ":F3." Circle the start of both ":F3's", but do not attempt to connect the two until the second ":F3" can become part of a polywave pattern using waves which proceed it (a polywave is an Elliot pattern composed of three or more monowaves).
It goes on to give a couple lists of how an F3 would fit into a sequence. An example of that would be
1. ? - F3 - c3 - L5 (circle start of F3).
...And so on.
This is mostly just to say none of this really makes sense to me right now, but I have to keep trying to shape these ideas or else I won't be able to use any of this info. I don't really like this book. I have to read every passage several times to make it stick :/ ... Not nearly as enjoyable as looking for simple patterns.
I was going to give more accurate take on live cattle vs feeder cattle, but now I'm kind of bummed so I'll do that another time perhaps.

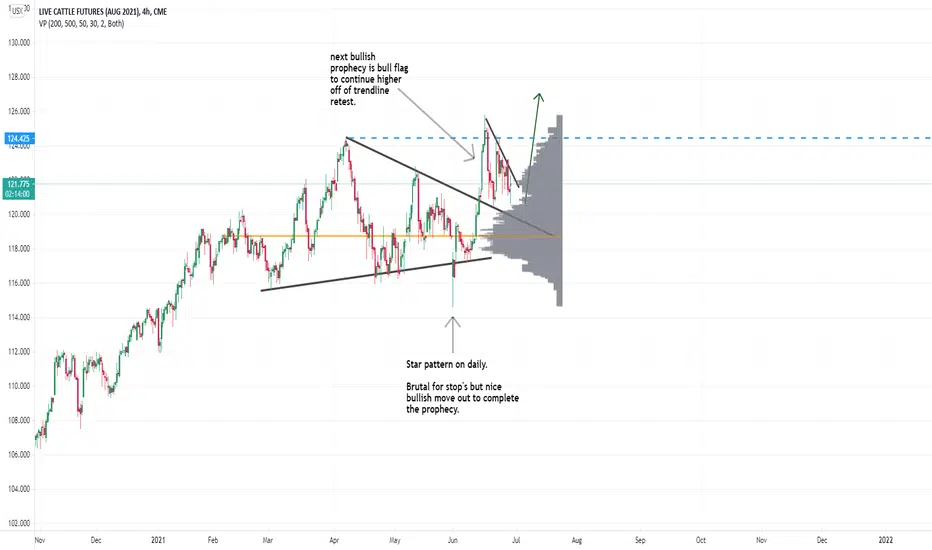
cattle pushing tentatively higher.cattle are moseying upward. looking for continuation out of a bull flag with trendline support.
I like the patterns I see here so I will plan to make an overly-complicated Elliot wave translation of what I'm seeing sometime within the next 10 hours.
Regarding seasonality, I can't remember any good details on seasonality, but I can remember reading two pages on this topic in a book like 3 years ago, but I can't remember what was on the pages. I remember a little bit though now that I'm asking for recall. There's like a 3 part life cycle as far as markets are concerned. There is a baby stage, where they just kind of count the numbers of possible cattle for the months ahead.. then a maturation stage, where some of the cattle are big enough to go to market, and some are sent back into the feeder for more growing, then there's the slaughtering stage, where all the large cattle get shipped out. There is a period of the year generally when they are contributing more attention to the growth of cattle than other times of the year, and the count of these numbers maybe could be used to predict shortages or surpluses. I would guess that's spring and summer, but I'm not certain. I am from Wisconsin so it's a little shameful I don't know this. Then obviously the price of raising cattle is dependent on the price of feeding them so if wheat/corn is higher then it costs more to feed them. I'm not sure if the result is farmers feed 900 cattle instead of the regular 1000 or if they just eat the cost and just feed as many cattle as they can regardless of feed prices. That assumption also relies on farmers following strict rule based feeding schedules, which I think they do pretty well if they are running big farms. But you never know.
I could be getting the stages of cattle mixed up with the stages for hogs. My brain wants to lump them together, but I'm also am finding an asterisk so I think there are significant differences that I'm unaware of. Probably better to do your own research. You can maybe tell I'm more of a price action oriented person.
LEQ2021 Aug Live CattleAug Cattle – Daily: Tenkan support at 121.50, Kijun support at 120.25 and further support at 118.75.
Risk would be priced against the uptrend line
Targets above at the 125.70 high and then above at 127.10, 128.50 with a primary target at 130.50

LE1! Continuous CattleWeekly Cont. Cattle: So far the Parallel uptrend line based off the 2019 low has proved to be a strong action/reaction line. Currently working as a magnet with last week’s close right on it.
**Cycle high/low targeted the week of 3/29 and appears to have done the job. Next cycle date will target the week of (or around) 8/02 to place a swing high or low….Using the parallel lines would have support at that time in the 116 to 112 area, and have upside potential around 136. Any of the lines on the chart could act as support/resistance (or action/reaction lines)

Live Cattle. Reverse, Reverse.Live cattle is still very much bullish. I'm only gloating at this point, because my position is doing very well.
I was following this chart for a while, saying that it was going to go up, and it did go up. This is a needed boost for my confidence at the moment because my stock positions are in a tactical drawdown.
I do not like stocks. Not on a boat. Not on a goat.

We'll Meat Again, Don't Know Where...This one can be a volatile spread, and that goes both ways.
The idea is to buy Live Cattle and sell Lean Hogs for a trade that runs May though to August. The reason for this trade is seasonal. That is, there is a pattern that tends to repeat itself each year.
Heading into mid-year, Cattle slaughter tends to be high while Hogs are at the opposite end. But that pattern reverses itself when we are past mid-year and looking towards the end of the year. That creates the spread movement.
In the last 25yrs, buying April Cattle and selling Dec Hogs, has lost money only 3 times. 22 out of 25 is not bad. Optimized data of course, but there is a pattern there! The average profit in that time has been over $3500 for one spread. You can also do this spread in nearby contracts, eg Dec Cattle.
It’s a volatile one though. Drawdowns can be, what’s the word…interesting. It makes this trade more about getting entries correct. An early to mid-June pull back has happened in more years than not. Waiting for that can give a better entry time.
Caveat: it ain’t that simple. Spread trading takes knowledge, support, patience and trade management, but the gems are there when we look in the right place.
One last thought: you cannot use 'beef stew' as a password. It's just not stroganoff.
- Please follow and like for more trade ideas and learny stuff! -

LEM2021. Live Cattle. The saga continues.I have been following live cattle for a while. I chose it because it seemed like a really random market that I wouldn't be bringing any market prejudices along with me, therefore, might help myself to trade it with a clear eyes.
I feel like I am seeing the market clearly, at least to the best of my present ability, and that live cattle is in a very favorable position to limit your downside and maximize your upside.
For the love of god, at least take this in your sim account so you can be a little more sensitive to it's movements.

LEM21. Live Cattle reacting to lines. Zooming in.Live cattle is playing by the rules. Still waiting for the resistance break.

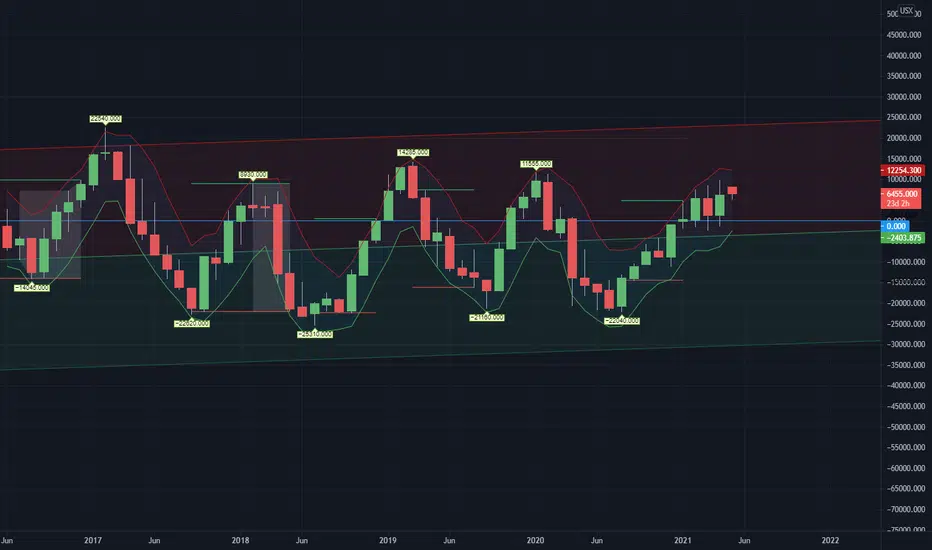
Live Cattle(/LE) vs Feeder Cattle(/GF) 3:2 Ratio Notional ValueLive Cattle(/LE) vs Feeder Cattle(/GF) 3:2 Ratio Notional Value
LE1!*1200-GF1!*1000
Live Cattle Update. Small bounce could become big bounce.We got a small bounce at an important level, and now we are waiting for the trendline to break which would tell us it could become a big bounce.
At the moment we have price hesitation which turned into a pro gap. That's a good bullish sign. But, this downtrend has been very strong, and I'm not willing to be a minute trader for LC. This causes me to wait for the larger time frame candles to show verified momentum. I'm looking for a big green leg candle on the daily before I get involved.
Maybe I will change my mind, but I feel pretty secure with that strategy.

Lean Cattle. Convincing myself it will go higher.It looks really good to me.
I have an incredible lazy streak. It's possible this only appeals to me so that I can take some action and stop paying attention every day. Obviously, this is not the ideal characterization of a profitable trader, but I'm still doing a good job convincing myself it's a high probability outcome.
Sooner or later I'm going to become clever enough to be useful to myself. But, then you might not like me anymore :(.
---
I could also reason one of two things:
1) Price has come down this far : It's a good buy.
2) Price has come down this far: It could go lower.
Unless, there is something like a cow-pox I feel like prices should go higher. I don't think there will be a cow-pox. Just using it as a stand in for 'big-unpredictable-market-specific-catastrophe'.
So door #1 says the .5 level is good enough for me, and I'm thinking it will go back up. In fact, I don't think it will go down, and I think it's a good price possibly for the next full calendar year.
Door #2 says I think it's possible price comes lower, and I think it will come lower.
----
I really don't think #2 is the door most people will open. I think the idea that price might not be this low for another entire year would be enough to make any forward thinking meat distributer want to use at least a good portion of there liquidity in the markets over the next few days. Actually this has been happening as evidence from what the consolidation is telling us.
