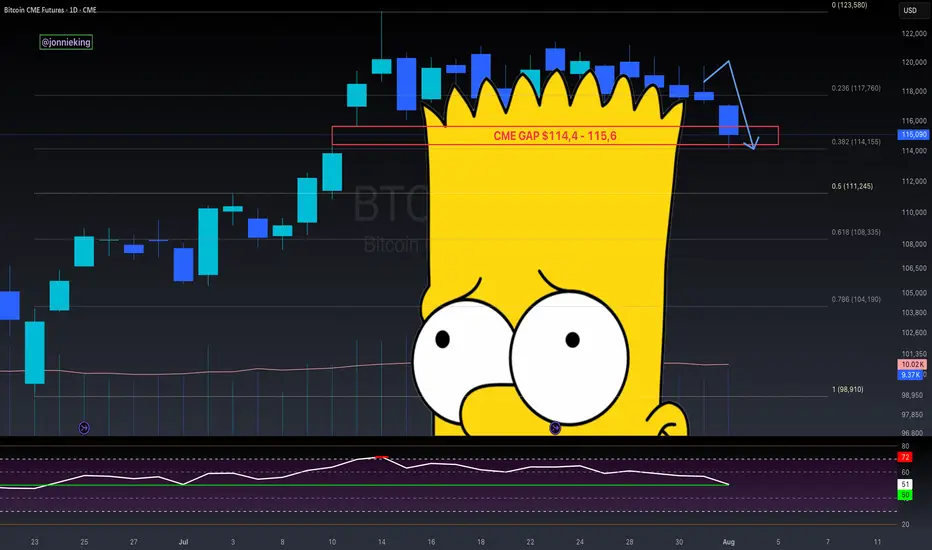
$BTC CME Gap + Bad Bart = Easiest Short EverCME Gap + Bad Bart is like taking candy from a baby 👨🏻🍼
Look at that textbook bounce off the .382 Fib 🤓
Pain ain’t over folks.
RSI still shows room on the downside 📉
Global Liquidity drain on the 4th.
Looking like the 50% Gann Level is next ~$111k
Get those bids in 😎
And never forget the BullTards who were telling you about the “Bollinger Band Squeeze” and UpOnly season 🫠
MBT1! trade ideas
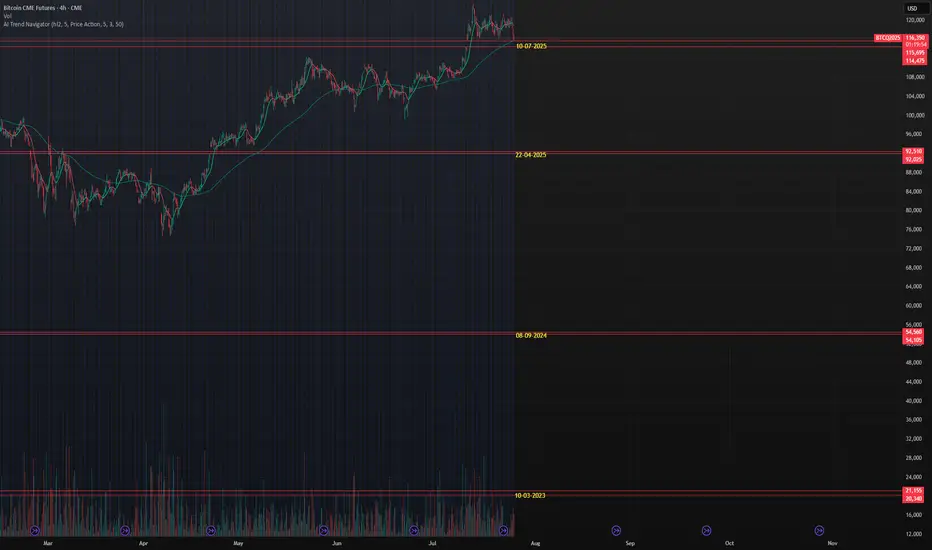
CME Gaps, which will be filled?Currently 4 gaps in the CME futures chart, running back till 2023 (march). What gap will be filled at some point in the future or will some remain open....
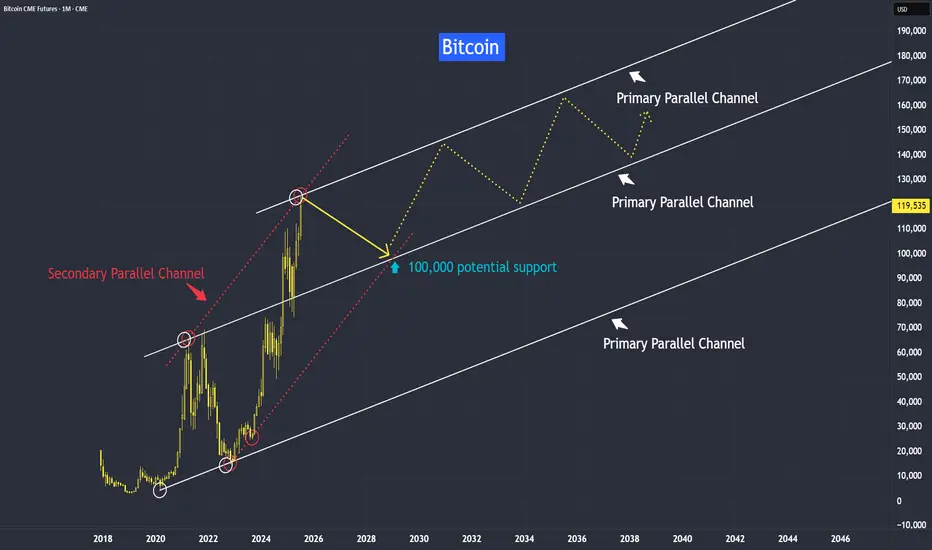
Bitcoin New Support at 100,000Bitcoin’s trend has been growing from strength to strength — and it’s likely to stay that way. Why?
This trend isn’t driven purely by speculation; it’s supported by strong fundamental reasons.
One of the most widely debated topics in finance today is the comparison between Bitcoin and gold. While both are viewed as stores of value, their long-term roles may diverge significantly.
Yes, gold and bitcoin have been moving up in near perfect synchronization with inflation.
Gold is traditionally seen as an inflation hedge, and since June 2022 — when inflation peaked at 9% — we’ve seen both gold and Bitcoin trend higher up to the present day.
Instead of asking why the Fed isn’t cutting interest rates despite the decline in CPI, perhaps we should ask: why the Fed prefers to maintain rates at the current level. What are they seeing with the data and the developments?
When both gold and Bitcoin hold steady at these elevated levels, it suggests that investors still believe the threat of rising inflation remains valid.
In all bull markets, the path is never straightforward — it’s often jagged along with volatility.
What distinguishes a continuing bull market - is the formation of higher lows along its timeline.
However, like gold which we recently discussed, Bitcoin may be approaching a medium-term resistance.
In this first week of this year tutorial, we observed an inverted hammer in the last month of 2024, suggesting a potential correction in Bitcoin, but yet seeing support at around 82,000 level.
As anticipated, the inverted hammer was followed by a correction here toward our support level at around 82,000, with some false breaks along. From that point, the market resumed its upward climb.
Now, it appears to be encountering resistance again.
Still, as long as the market continues to form higher lows, and the threat of rising inflation still remain, the bull trend should remain intact.
This is how the projection might look when mapped with a trendline.
We observed that the primary parallel trendline is reacting in relationship to each other. Next I would like to explore its secondary channel.
Please don’t interpret this as a literal path. Instead, I hope it serves as a guideline to help you form your own projections as the market evolves.
Gold is preferred by older generations, central banks, and conservative investors. Deeply entrenched in traditional finance and cultural value systems.
Cryptocurrency has a rapid adoption by younger investors, tech-native users, and institutions. Millennials and Gen Z are more likely to trust cryptographic assets than governments or fiat systems.
I will keep an open mind to both inflation hedge asset and their instruments.
Its video version for this tutorial:
Disclaimer This analysis is based on technical studies and does not constitute financial advice. Please consult your licensed broker before investing.
Mirco Bitcoin Futures and Options
Ticker: MBT
Minimum fluctuation:
$5.00 per bitcoin = $0.50 per contract
CME Real-time Market Data help identify trading set-ups in real-time and express my market views. If you have futures in your trading portfolio, you can check out on CME Group data plans available that suit your trading needs www.tradingview.com
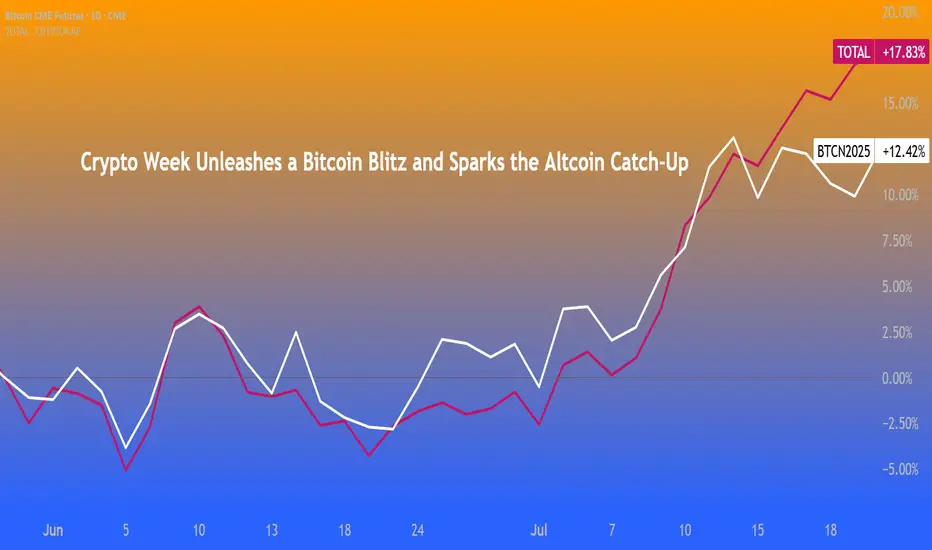
Crypto Week Unleashes a BTC Blitz & Sparks the Altcoin Catch-UpTotal crypto market capitalization has reached a new record high, driven by Bitcoin’s stunning rally. Other major coins, notably Solana and Ethereum, remain below their previous peaks.
These price records coincide with what President Trump has dubbed “Crypto Week.” Market insiders are preparing for an altcoin season as the BTC Fear & Greed Index moves into the greedy zone.
As we’ll note in this paper, things are different this time around, with certain digital assets better positioned to lead. It examines the outlook for Bitcoin, Ethereum, Solana and XRP in light of the crypto bills under consideration in the US. It also explains how inter-asset spreads, which capture relative value between digital assets, can help investors position with reduced risk.
Crypto Week Triggers Surge. Will Sentiment Wane Now?
The week of July 14, 2025 was dubbed “Crypto Week” in Washington, D.C., featuring a string of pro-crypto legislative milestones. The U.S. House of Representatives advanced three major bills – the CLARITY Act (defining crypto market structure and exchange regulations), the GENIUS Act (establishing federal rules for stablecoins), and an anti-CBDC measure – aiming to provide the clear regulatory framework the industry has long sought for.
President Trump, who embraced the moniker of “crypto president,” backed these efforts and swiftly signed the stablecoin GENIUS Act bill into law. This legislative push signalled a historic shift in attitudes, positioning the U.S. to “make America the crypto capital of the world,” as lawmakers claimed.
Crucially, the stablecoin law (the GENIUS Act) could unlock new liquidity for digital assets. It creates a legal framework for U.S. dollar–pegged stablecoins, allowing banks, nonbanks and credit unions to issue their own dollar-backed coins under clear guardrails.
Stablecoins – the lifeblood for trading and DeFi – already play a major role by enabling instant crypto transactions, and their use has grown rapidly despite past regulatory uncertainty. With regulatory certainty, fresh stablecoin supply from traditional institutions may enter the market, increasing on-ramps for investors and flow of capital into crypto. In theory this is a bullish development, as expanding the fiat-backed liquidity pool can support higher valuations across assets.
However, it’s important to note that these U.S. laws are not yet in effect – the stablecoin act will take time to implement even after signing, and the other bills still require Senate approval or further progress.
The optimism of “Crypto Week” has been rapidly priced in by the market, but the practical impacts (e.g. banks actually launching stablecoins or increased U.S. stablecoin adoption) will materialize only gradually over coming months. In the meantime, traders should temper excitement with patience, as regulatory change tends to influence markets with a lag. At the same time, the recent surge in stablecoin supply is undeniable and has come on the back of additional flows to the asset class all year through broader institutional adoption.
BTC and XRP at ATH; SOL and ETH Lag
Bitcoin rallied through Q2 2025 to crest a new peak of $123,000, driven by institutional demand—including record spot ETF inflows totalling $19 billion (YTD) and positive regulatory signals.
XRP echoed this strength, surging past $3.60 to reclaim its 2018 peak after major asset managers filed for XRP based ETFs amid clearer legal status post CLARITY Act.
By contrast, Ethereum and Solana, despite gains of +35% and +24% respectively in Q2, remain roughly 20–30% below their all time highs (ETH ~$4,800; SOL ~$260). SOL’s rebound owes much to network growth and memecoin activity, and but its institutional narrative remains secondary.
ETH’s rally has been supported by rising staking participation and DeFi activity, yet it lacks the concrete ETF catalyst that buoyed BTC and XRP, until now.
Source: Mint Finance Analysis
Net ETF flows this year have been dominated by strong inflows into BTC ETFs, with only a few brief outflow periods. Notably, over the past few weeks, ETH ETF inflows have also accelerated.
Might this signal a shift in momentum, with previously lagging assets poised to rally? It’s possible; however, in a broader market downturn, these same assets could suffer disproportionately. How can investors strategically navigate this environment and position themselves around underperformers?
Relative Value Spreads Using CME Micro Futures
Relative value spreads allow traders to express a view on one asset relative to another while remaining neutral to directional moves in either. This strategy is particularly useful when price direction is uncertain but some assets are clearly outperforming others.
Using CME’s Micro Crypto suite, investors can deploy these spreads on major digital assets with deep liquidity and lower margin requirements than outright positions.
Recent inter-asset spread performance shows most altcoins outperformed Bitcoin during “Crypto Week”
The BTC / XRP ratio declined 30 percent as XRP rallied more strongly than Bitcoin. The BTC / ETH ratio fell 30 percent, while the BTC / SOL ratio fell 22 percent—the smallest decline among the three pairs.
Over the longer term, declines in the BTC / ETH and BTC / SOL ratios reflect nearly a year of altcoin underperformance. As altcoins catch up, the strong momentum in BTC / ETH makes it a viable spread for investors, especially given accelerating inflows into ETH ETFs. The following hypothetical spread consisting of a long position in 32 x CME micro ETH futures (August) and short position in 1 x CME micro BTC futures (August). CME offers margin offset of 40% for this spread as of 22/July.
XRP-based spreads have been heavily influenced by the US election and regulatory developments. Investors seeking to express an outperformance view backed by recent legislative progress can consider the XRP / SOL spread, which has shown strong momentum over the past week
The following hypothetical spread consists of long 1 x CME micro XRP futures (August) and short 2 x CME micro-SOL futures (August). CME offers a 15% margin offset for this spread as of 22/July.
MARKET DATA
CME Real-time Market Data helps identify trading set-ups and express market views better. If you have futures in your trading portfolio, you can check out on CME Group data plans available that suit your trading needs tradingview.com/cme .
DISCLAIMER
This case study is for educational purposes only and does not constitute investment recommendations or advice. Nor are they used to promote any specific products, or services.
Trading or investment ideas cited here are for illustration only, as an integral part of a case study to demonstrate the fundamental concepts in risk management or trading under the market scenarios being discussed. Please read the FULL DISCLAIMER the link to which is provided in our profile description.
BITCOIN CME GAP IS FILLING RIGHT NOW!#Bitcoin CME Futures
Bitcoin is dipping — and all signs point to the CME gap getting filled.
Historically, these dips have been aggressively bought, so a strong bounce from here looks likely.

Survival First, Success LaterThere was once a stone that lay deep in the heart of a flowing river.
Every day, the water rushed past it, sometimes gently, sometimes with force. The stone wanted to stay strong, unmoved. It believed that by holding its ground, it could outlast the river.
For years, the stone resisted. It didn’t want to change. It believed that strength meant standing still, no matter how hard the current pulled.
But slowly, almost without noticing, the stone began to wear down. The river wasn’t trying to destroy it. The water wasn’t cruel. It was simply doing what rivers do - moving, shifting, carving its own path.
One day, the stone realised it wasn’t the same shape anymore. It was smoother now, smaller in places. It hadn’t won by resisting. It had survived by adapting. It had learned to let the river shape it without breaking it apart.
The stone couldn’t control the river. All it could do was endure without letting itself be shattered.
Trading is NOT so different.
The market moves like a river. It doesn’t care if you want it to go left or right. It doesn’t reward those who stand rigid against its flow. It rewards those who learn when to hold their ground, when to let go, and how to survive the constant pull of forces bigger than themselves.
This is NOT a story about rivers and stones. It’s a story about YOU.
About learning to endure without breaking. About understanding that survival comes not from fighting the current, but from learning how to live within it.
Much like the stone, every trader begins with the same illusion, that strength means control, that certainty can be conquered with enough knowledge or willpower.
But time in the markets teaches you otherwise. It shows you, again and again, that survival isn’t about resisting the flow. It’s about learning to move with it, to protect yourself from the inevitable storms without being broken by them.
And so, this is where the real story of trading begins.
Trading often appears simple from a distance. You buy, you sell, you make a profit, and then you repeat the process.
But anyone who has spent enough time in the markets will tell you the truth. This isn’t a game of certainty. This is a game of survival.
The market humbles you early. It doesn’t care how much you know, how brilliant you think you are, or how much confidence you bring. The market doesn’t reward ego; it breaks it down piece by piece.
Almost everyone starts with the same mindset. You want to win. You want to make money. You believe you can figure it out if you study hard enough, work smart enough, hustle more than the next person.
But eventually, reality steps in. You begin to understand this game isn’t about knowing where the price will go next. It’s about knowing where you will stop, where you will cut a loss, where you will step aside and wait.
The traders who survive are not the ones who chase perfection or seek to predict every move. They are the ones who learn how to lose properly - small losses, controlled losses. Losses that don’t bleed into something bigger, mentally or financially.
Most people can’t do that. They fight the market. They fight themselves. They refuse to accept small losses, believing they can somehow force a different outcome.
Those small losses eventually snowball. Blowups rarely come from one bad trade. They come from ignoring the small signs over and over again. The market isn’t cruel. It’s just indifferent. It’s your responsibility to protect yourself.
Good trading isn’t loud. It isn’t exciting. It isn’t full of adrenaline and big calls.
Good trading is quiet, repetitive, and frankly, a little boring. It’s built on discipline, not drama. Your job is to manage risk, protect your capital, and let time do its work.
There is no holy grail. There is only process. A process you can repeat with a clear head, day after day, year after year, without losing yourself in the noise.
Wins will come. Losses will come. Neither defines who you are. What defines you is how you respond.
⦿ Can you stay calm after a red day?
⦿ Can you follow your plan even after a mistake?
⦿ Can you sit on your hands when there’s nothing to do and trust the work you’ve already done?
Patience, in the end, is the real edge. Most won’t have it.
They’ll bounce between strategies, searching for certainty where none exists. They’ll burn out chasing shortcuts. They’ll forget that progress comes through small, steady steps taken over years, not through chasing big wins.
Trading is a mirror. It reflects your fear, your greed, your impatience. It shows you who you really are. Ignore what it reveals and you’ll keep paying for the same lesson until you finally learn it.
In the end, this game isn’t about the market. It’s about YOU.
⦿ Learn to protect yourself.
⦿ Learn to sit with boredom.
⦿ Learn to lose well.
⦿ Learn to wait without losing faith.
If you can do that, the market has a way of rewarding you in time.

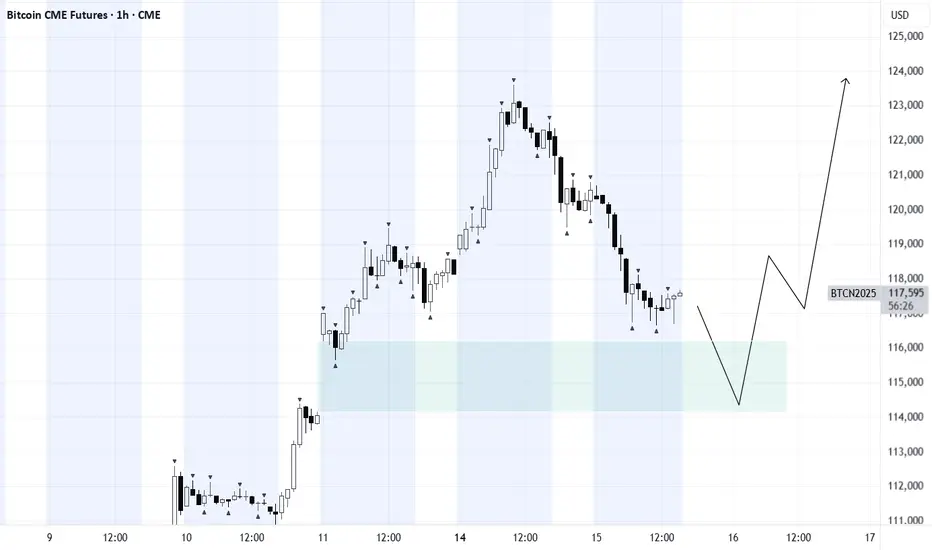
CME Gap: $115.8K–$116.8K Target or Trap?There’s a clear gap between $115,800 – $116,800 on the Bitcoin CME Futures chart. Historically, BTC tends to revisit and fill these gaps. Will we see a pullback to close it before the next move up? 📊
🧠 Watching price action closely around this zone. Share your thoughts below! 👇

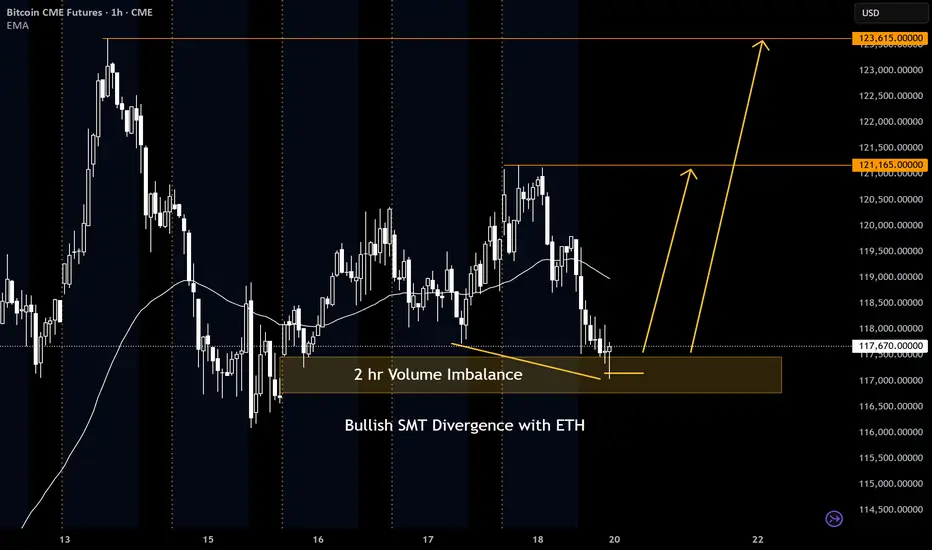
BTC Futures hitting ATH again???? Hmm....Looking at BTC futures, we have some bullish divergence with ETH. We also have a liquidity sweep into a 2 hr volume imbalance.
I will be looking at two areas to target. The first area is at 121,165 at the previous high and the second area is at 123,615 where the ATH will be broken.
Lets drop down to the 5 minute timeframe and wait for an FVG entry.
Let me know what you guys think.
Bitcoin and Upcoming TrendBitcoin’s trend has been growing from strength to strength — and it’s likely to stay that way. Why?
This trend isn’t driven purely by speculation; it’s supported by strong fundamental reasons.
One of the most widely debated topics in finance today is the comparison between Bitcoin and gold. While both are viewed as stores of value, their long-term roles may diverge significantly.
Yet, they’ve been moving in near-perfect synchronization, with potential resistance ahead, but their trend still remain intact — and here’s why.
Mirco Bitcoin Futures and Options
Ticker: MBT
Minimum fluctuation:
$5.00 per bitcoin = $0.50 per contract
Disclaimer:
• What presented here is not a recommendation, please consult your licensed broker.
• Our mission is to create lateral thinking skills for every investor and trader, knowing when to take a calculated risk with market uncertainty and a bolder risk when opportunity arises.
CME Real-time Market Data help identify trading set-ups in real-time and express my market views. If you have futures in your trading portfolio, you can check out on CME Group data plans available that suit your trading needs www.tradingview.com

Will the gap be filled or not?During the bull run of 2020/21, there were gaps that remained unfilled until the bear market. So it's possible that the one at 114.3k will stay unfilled for now, but it's also hard to imagine, since we're so close.
BTCA gap is currently in play. For further upside, it would be healthy to see a full or partial fill in the near term, followed by a strong reaction.
Such a move would signal strength and validate bullish momentum.
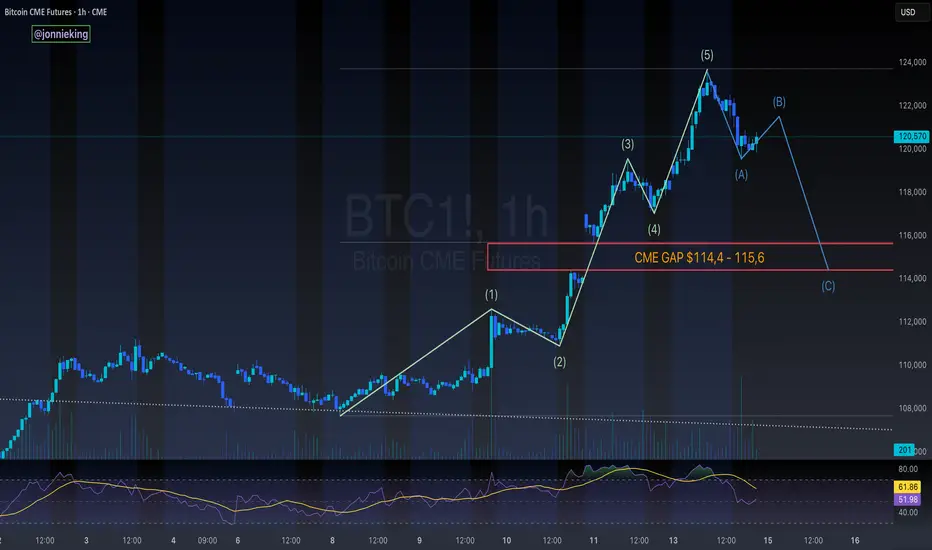
$BTC 5-Wave Impulse > ABC Correction > CME GapCRYPTOCAP:BTC appears to be headed towards an ABC correction after this impulsive 5-wave move to the upside
Would be a great opportunity to fill the CME gap ~$114k
Lines up perfectly with the 50% gann level retracement to confirm the next leg
don't shoot the messenger..
just sharing what i'm seeing 🥸
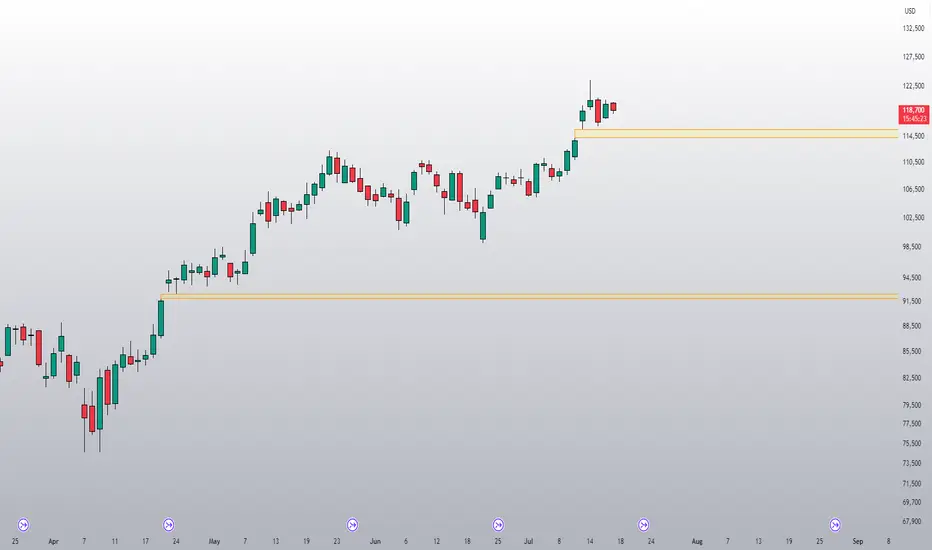
Bitcoin Breakout: Charting the Next TargetsWe’re taking another look at #Bitcoin, which has surged higher and broken above its long-term channel — a move that’s caught the attention of many market watchers.
🔍 Key technical insights:
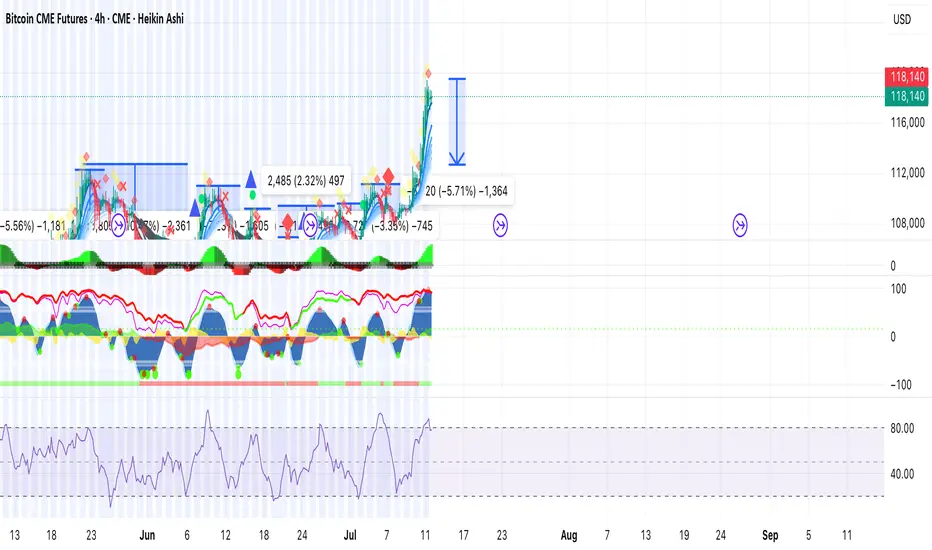
✅ The recent consolidation appears to be a midway pause in the uptrend. By measuring the preceding flagpole and projecting from the breakout, we derive an overall target near $145,000.
✅ Using Fibonacci extensions:
• From the September 2023 low to the March 2024 peak, projected off the July 2024 low, we see an interim resistance around $127,000.
• A secondary extension from the July 2024 low to the January 2025 high, projected off the March 2025 low, points to approximately $134,500.
📊 The broader bull trend remains intact while Bitcoin holds above its 55-day moving average. For those seeking tighter risk parameters, the 4-hour chart with cloud analysis suggests initial support around $119,500.
⚠️ As always, it comes down to your individual risk tolerance. (This is not investment advice.)
💬 I’d love to hear your perspectives:
• Are these targets on your radar?
• Where do you see Bitcoin heading next?
Disclaimer:
The information posted on Trading View is for informative purposes and is not intended to constitute advice in any form, including but not limited to investment, accounting, tax, legal or regulatory advice. The information therefore has no regard to the specific investment objectives, financial situation or particular needs of any specific recipient. Opinions expressed are our current opinions as of the date appearing on Trading View only. All illustrations, forecasts or hypothetical data are for illustrative purposes only. The Society of Technical Analysts Ltd does not make representation that the information provided is appropriate for use in all jurisdictions or by all Investors or other potential Investors. Parties are therefore responsible for compliance with applicable local laws and regulations. The Society of Technical Analysts will not be held liable for any loss or damage resulting directly or indirectly from the use of any information on this site.

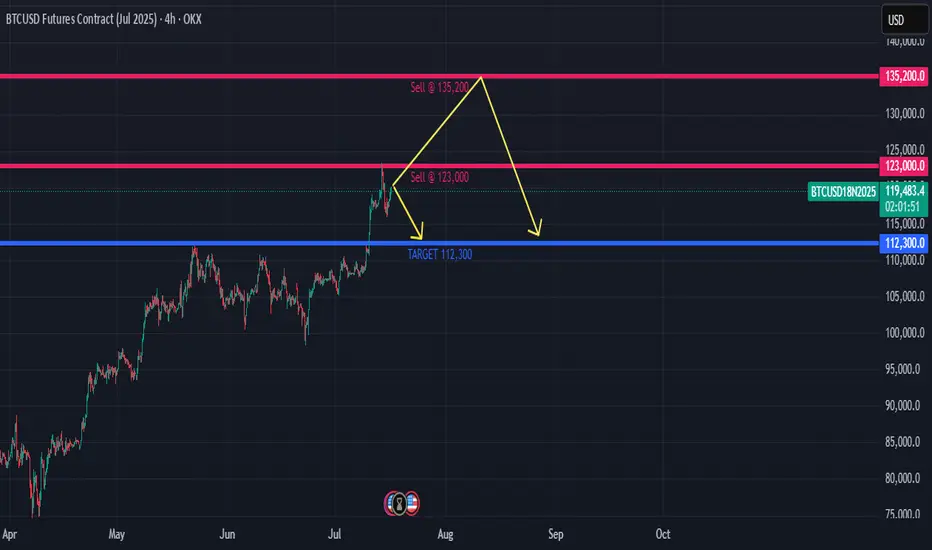
5% correct is needed BTCI believe follow the past we can see on 4h chart usually BTC always correct at least a 4%/6% and in a bigger case it correct 10%.
So now the price is in discovery mode we go some selling at 118k I guess a 5% drop from here is needed.
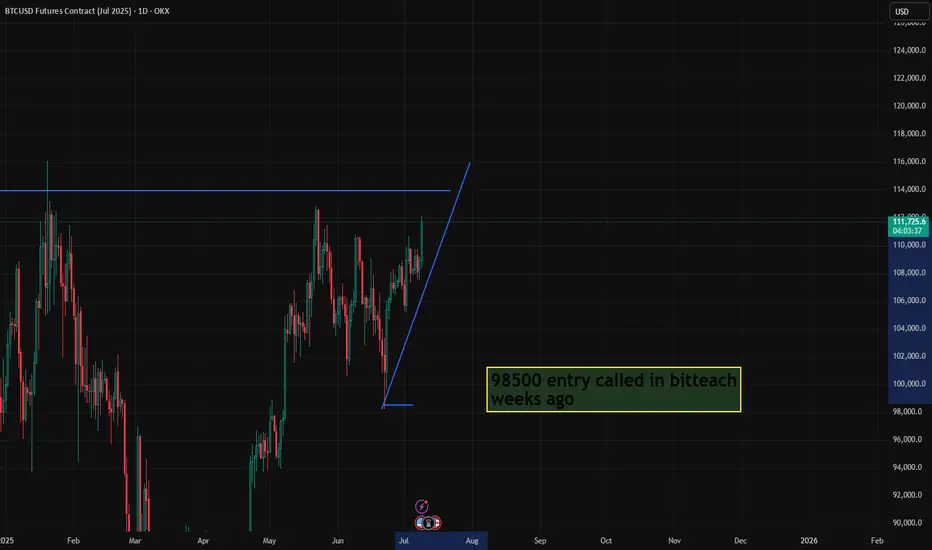
Beautiful Bitcoin breakout, as called. PLEASE SEE PROFILE FOR MORE INFO!
What an absolutely gorgeous Inverse Head & Shoulder for #Bitcoin.
Had suspicion this time WAS different for #BTC.
Let's talk ROUGH ESTIMATES for social #gold.
CRYPTOCAP:BTC is no longer a hard to anticipate as it's become an institutional asset. Follow the $, volume. ETF's are performing similar. Leveraged funds, not so much
Anyway, enjoy the ride #Crypto!
Previous trade working nicelyTaking 80% profit here as topping out - leave the rest to run and move stop to BE.
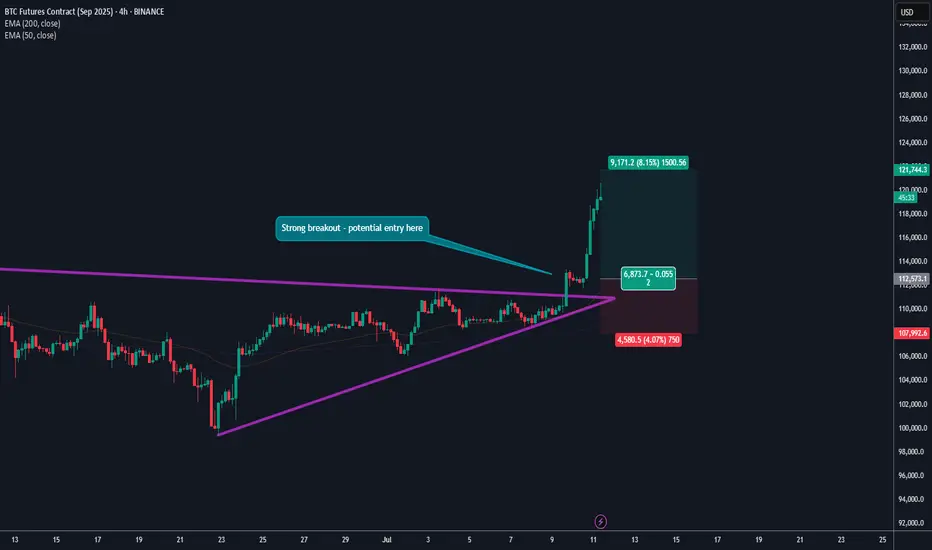
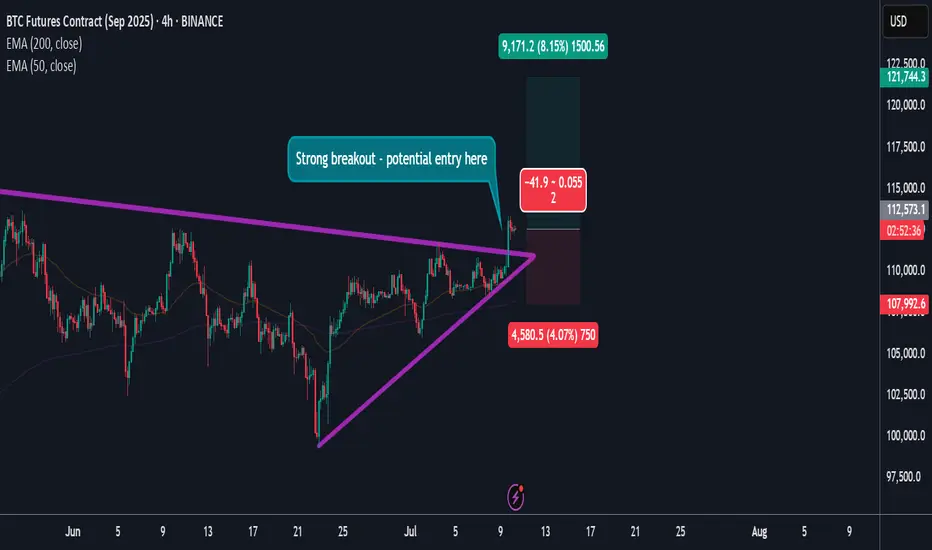
BTC Breakout OpportunityRecent BTC breakout.
Potential entry on 4h.
2:1 target with around 4% stop loss under recent low.
Higher risk as still under ATH. I would want to run some of this one.
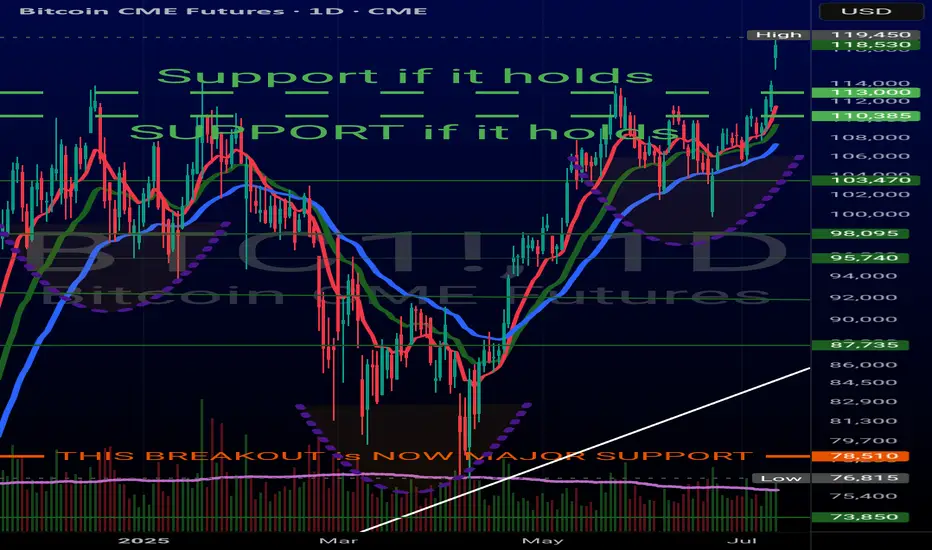
Bitcoin UpdateBitcoin has just broken out above its recent consolidation pattern, staying firmly in an uptrend and finding solid short-term support at its 55-day moving average.
We're now pushing toward the previous high at 112,345, chipping away at that level. Once cleared, our eyes turn to the weekly chart, which reveals a 4-year ascending channel — with the top sitting around 114,480, our broader target.
Disclaimer:
The information posted on Trading View is for informative purposes and is not intended to constitute advice in any form, including but not limited to investment, accounting, tax, legal or regulatory advice. The information therefore has no regard to the specific investment objectives, financial situation or particular needs of any specific recipient. Opinions expressed are our current opinions as of the date appearing on Trading View only. All illustrations, forecasts or hypothetical data are for illustrative purposes only. The Society of Technical Analysts Ltd does not make representation that the information provided is appropriate for use in all jurisdictions or by all Investors or other potential Investors. Parties are therefore responsible for compliance with applicable local laws and regulations. The Society of Technical Analysts will not be held liable for any loss or damage resulting directly or indirectly from the use of any information on this site.

i called the bottom and now im calling 150k BTC 150k BTC is coming in the near future.
we are seeing a nice breakout and we will test ATH yet again here. if we break ATH we will be going parabolic and the ALT season will begin!
hats on. pants clean. we are about to crap upwards in money printing
ETH: Buying in the DipCME: Micro Ether Futures ( CME:MET1! ), #microfutures
On May 22nd, #Bitcoin reached a new all-time high of $111,814. The king of cryptos rallied as bullish sentiment built up behind the most pro-crypto U.S. administration. As of last Friday, bitcoin realized a one-year return of +90.8%. For comparison, holding S&P 500 only yields 11.8% for a year, even after the US stock index made its ATH last week.
Meanwhile, #Ethereum, second only to Bitcoin in the cryptocurrency world, experienced a dramatic decline in 2025. ETH is currently trading around $2,500, down 40% since December. It is a far cry from its ATH of $4,815 on November 9, 2021.
Why Is Ethereum (ETH) Falling?
The most significant challenge facing Ethereum is the proliferation of Layer 2 scaling solutions. Networks such as Arbitrum, Base, and Optimism were developed to address Ethereum's scalability issues, but they've created a revenue problem for the main chain.
When users conduct transactions on these Layer 2 networks, transaction fees flow to third-party organizations rather than to the Ethereum network itself. Revenue diversion has weakened Ethereum's economic model.
Ethereum could counter the revenue erosion by implementing a fee on Layer 2 transactions. However, it would undermine the very purpose of these networks. Layer 2 solutions were designed specifically to reduce transaction costs by processing operations off-chain and submitting only batched results to the main network. Adding fees would increase costs and diminish their competitive advantage.
Increased competition in the blockchain space has further eroded Ethereum’s dominance. Investors have been withdrawing funds from Ethereum and redirecting them to competing projects with potentially better returns or technological advantages.
Future Outlook
Ethereum’s path forward appears challenging. While the platform still hosts thousands of decentralized applications and maintains a large developer community, its economic model is under pressure from multiple directions. Without finding new ways to generate value, Ethereum may continue to lose market share to more nimble competitors.
The platform’s supporters point to upcoming technical improvements and the maturation of the proof-of-stake consensus mechanism as potential catalysts for recovery. The recent approval of staking enabled ETF for Ethereum in Hong Kong is one of the ways forward. However, with increasing competitive pressures, Ethereum faces an uphill battle to reclaim its former status as the undisputed leader in smart contract platforms.
While the future remains challenging, Ethereum still has upside potential at the current price level. As ETH dropped below $1,500 in April, bargain hunters came in to scoop it up. As a result, ETH had a spectacular rebound of 70% in the last three months, outrunning Bitcoin’s 25% gain for the same period.
There are over 17,000 cryptocurrencies in existence, according to Coin Gecko. However, only a handful of them have proven to have a lasting investment value. We could refer to Bitcoin and Ethereum as the digital form of Gold and Silver. Historical trend shows that the spike in gold prices would likely prompts investors to buy silver at a lower cost, helping maintain a stable Gold/Silver price ratio. The same could be true for the BTC/ETH relationship.
For extensive reading, please refer to my Editors’ Picks, The Gold-Silver Ratio Explained, published on TradingView on April 28th.
Recent regulations on #stablecoins in the US and Hong Kong are good news to the crypto space. It legitimates crypto offerings from mainstream financial institutions. Bitcoin is positioned for another big lift as investors reallocate assets into cryptos.
On July 4th, President Trump signed into law the “Big and Beautiful Bill”. Above all, this massive package funds deficit spending and raises the national debit by $5 trillion. While we will carry the debt burden for many years, in the short run, injecting huge liquidity into the economy and the financial market would pop up asset prices.
The latest CFTC Commitments of Traders report shows that, as of June 24th, the total open interest for Micro Ether futures are 128,500 contracts.
• Leverage Fund has 94,167 in long, 112,442 in short, and 1,854 in spreading
• The long-short ratio of 0.84 does not provide a good indication of what the “Smart Money” views about Ethereum.
In summary, I hold the view that ETH may regain ground above 3,300 before year end. Investors sharing this bullish view could explore CME’s Micro Ether Futures ( NYSE:MET ).
Long Futures with Stop Loss
Last Friday, the August Ether Futures contract (METQ5) was settled at 2,518. Each contract has a notional value of 0.1 ETH, or a market value of $251.8. To buy or sell 1 contract, a trader is required to post an initial margin of $84. The margining requirement reflects a built-in leverage of 3-to-1. It’s cost-effective to invest with CME MET futures, vs. buying ETH from the spot market.
Let’s use a hypothetical trade to illustrate how the long futures with stop loss strategy would compare with buying spot ETH.
Hypothetical Trade:
• Buy 1 METQ5 contract at 2,518, and set a stop loss at 2,400
• Trader pays $84 for initial margin
High Price Scenario: Ethereum rises to $3,000
• Futures gain will be $48.2 (= (3000-2518) x 0.1)
• Futures return will be +57.4% (= 48.2 / 84)
• This compares to a 19.1% for investing in spot ETH. (= (3000 /2518) – 1)
Low Price Scenario: Ethereum drops to $2,000
• Futures stop loss at 2,400, and the maximum loss is $11.8 (= (2518-2400) x 0.1)
• Futures return will be -14% (=11.8 /84)
• This compares to a 20.6% loss for investing in spot ETH. (= (2000 /2518) – 1)
The above scenarios show that
• When ETH goes up, futures will have higher returns due to its leverage nature.
• When ETH falls, the stoploss will kick in to reduce losses.
Happy Trading.
Disclaimers
*Trade ideas cited above are for illustration only, as an integral part of a case study to demonstrate the fundamental concepts in risk management under the market scenarios being discussed. They shall not be construed as investment recommendations or advice. Nor are they used to promote any specific products, or services.
CME Real-time Market Data help identify trading set-ups and express my market views. If you have futures in your trading portfolio, you can check out on CME Group data plans available that suit your trading needs www.tradingview.com

Strategy H2 2025. BTC Airless Plot Near $100'000 Choking PointOver the past 6 months, Bitcoin (BTC) has demonstrated a very mixed up/down performance, marked by significant price fluctuations, appreciation and volatility.
From late December 2024 to June 2025, BTC's price rose from approximately $92,000 to around $108,000, representing a gain of about 17.26% over this period.
On the other hand. the price fluctuated between last price in 2024 $92,000 and BTC' low near $74,491 achieved in early April 2025, posting the similar, nearly 20 percent year-to-date decline.
Bitcoin's price trajectory during this time was influenced by several factors. Early in 2025, BTC reached a new all-time high near $109,000 but faced a pullback triggered by profit-taking and macroeconomic uncertainties, dropping nearly 30% to about $74,000 by April. This decline was short-lived, as Bitcoin quickly rebounded by roughly 24%, climbing back to mid-$90,000 levels and eventually surpassing $100,000 again by June, signaling wide range fluctuations are getting for longer.
The technical setup suggests that Bitcoin is poised for further swings around $100'000 choking point.
In summary, Bitcoin’s performance over the last six months has been characterized by sharp correction, mixed technical buy and sell signals, with no any solid fundamental support from institutional investors.
These factors collectively indicate a mixed outlook for BTC, with further price fluctuations in wide range, as a mid-term pricе action perspective for H2 2025 and for longer.
Similar like a year ago 52-week SMA could be considered as major support level.
--
Best wishes,
@PandorraResearch Team 😎

Bitcoin UpdateWe’re back looking at the #Bitcoin chart. While BTC stays above the 55-day MA (currently at 101,116), we remain overall bullish. But here’s the catch:
🔍 What I’m watching:
• The MACD is still below zero — no clear buy signal yet.
• The RSI is encouraging (above 50), but…
• 📉 No surge in volume = caution.
• DMI also not giving a strong green light.
👉 So, we might need more consolidation before the next leg higher. Patience is key!
If BTC clears these highs?
🎯 I’d target ~114,000 (top of the long-term channel since 2021).
For now, staying positive but waiting for that volume confirmation. 💪
Disclaimer:
The information posted on Trading View is for informative purposes and is not intended to constitute advice in any form, including but not limited to investment, accounting, tax, legal or regulatory advice. The information therefore has no regard to the specific investment objectives, financial situation or particular needs of any specific recipient. Opinions expressed are our current opinions as of the date appearing on Trading View only. All illustrations, forecasts or hypothetical data are for illustrative purposes only. The Society of Technical Analysts Ltd does not make representation that the information provided is appropriate for use in all jurisdictions or by all Investors or other potential Investors. Parties are therefore responsible for compliance with applicable local laws and regulations. The Society of Technical Analysts will not be held liable for any loss or damage resulting directly or indirectly from the use of any information on this site.
