I had already taken this trade, just documenting itNothing significant to mention, just that it is a good opportunity of a bounce
MBT1! trade ideas

CME Futures PREMIUM —Bitcoin Will Continue To GrowThe PREMIUM between Bitcoin's CME Futures and spot price is still on. This means that Bitcoin continues bullish.
In a previous article, I used this signal to predict a bullish breakout and bullish continuation. When there is a bullish bias Bitcoin becomes more expensive on CME vs spot, it means buy demand is very strong. With a strong demand for Bitcoin from the public, prices continue to grow.
There is a huge difference between the double top in 2021 and the chart structure in 2025.
The double top in 2021 came out of a 5-up waves pattern. The current top comes out of a 7 months long consolidation phase. Based on Elliotts law of alternation, the bull market will end in a blow off top in 2025 rather than a double top. This means that we will see one final and very strong move up followed by a crash, and that's how the bull market will end. Think of 2017/2018 and you can get a perfect picture of how the bull market will end. The only question that remains is about how far up prices will go, will the bullish wave end at $157,425 or will it go to $211,855?
Six months is enough to reach the second target.
This is a friendly reminder.
Bitcoin will continue to grow.
Namaste.

The Leap - June 2025 (Pre-Month Analysis)This is my analysis for the upcoming TradingView competition pairs for the month of June. I'll do a weekly analysis each week, starting at the beginning of the month and after each week.
Good luck to all who are joining!
- R2F Trading

Here's your chance to get in on the shortSo btc has failed auction and risen towards the structure POC
it is also the 0.75/0786
if this doesnt hold im looking at the 113,575 (1.25 fib)
and the 1.618 at 115430
i dont know which will hold i just know where i want to look for a hedge.
in order to do so i want a good high (long selling tail) and good oscilation data.
shorts are getting rekt and squeezed.
as we make new ath's
soon there wont be any more liquidity to grab

Short & Long Position on Bitcoin Futuredescription is explained on the chart for better understanding

Bitcoin levels to watchI'm Bullish on this asset, however I'd be interested to engage when the inefficiencies below the current market price has been mitigated. It'll get there sooner or later, and until it happens I'm just going to sit on my hands.
BTC Futures : My first attempt with a target price of 0Hello friends; I think not believing in Bitcoin is as natural as believing in Bitcoin.
I can't express my opinion here with moving averages and/or RSI levels.
The Beyond Technical Analysis might make sense for this trade.
If we are wrong, what is important here is our position and risk management. We do not open a transaction to say "I told you so".
I cannot explain this with any technical analysis method, blockchain data, etc.
Technically; everything that will be built based on this is the same as building a sand castle.
I don't think Bitcoin has an equivalent.
If we consider serious inflation rates, it is obvious that people will have much bigger and more vital priorities than buying Bitcoin or other cryptocurrencies. I am not even talking about electricity costs.
I definitely don't think it can be in the same class as Gold.
This trade alone offers us a very good risk/reward ratio.
I chose the contract covering the next period ending on May 30th, not the continuous CME contract, in order to save time.
A good place for a first try.
I will definitely try something similar.
I don't think I will have any views other than the short side in the future.
For years I have been asked, "If you don't believe us, why don't you open a short position?" I will try to achieve this.
So there's also an experimental side to this.
HIGHLIGHTS
We are closing our position before the contract switch date of May 30, 2025, without looking at the price. If necessary, we will try again in the next contract.
The value of 113690 is our stop value. We end our trade at this value.
We choose the smallest value as the position size.
If you expect something to be 0,
you should choose trading instruments that evaluate your position in currencies rather than in BTC value.
I chose CME because it is suitable for this.
Contracts that are further away are definitely not liquid.
It may be difficult to find buyers even at high values.
Target : 0
Absolutely no margin addition.
Best regards.

these shorts are getting easy like muscle memoryIn from the CVD absorption value area high retest
my edge is: ES confluence, trapped longs.
CVD data
the past bottoms/tops were failed auctions in electronic trading sessions and not in regular trading hours
the amount of donwside liquidity (24 billion liquidations for 92k)
on a higher timeframe we have hidden bearish divergence.
stop is tight position size is 20400 x2

Bitcoin - Do Or DieThis is the spot where things either get spicy or go limp. If we see weakness here — same old chop, same range, nothing to see.
But if Bitcoin punches through this zone with conviction, we’re looking at some serious upside. Targets are mapped, and the path is clear if bulls step up.
No breakout? Don’t expect fireworks.
Breakout? Strap in.
This is a decisive moment


1 Billion USD+ SHORTs Liquidation —Bitcoin BullishGood morning my fellow Cryptocurrency trader, I hope you are having a wonderful day.
We all know that life is not a game of checkers, it is more like fifth dimensional chess. It can be easy once we master how to play but it is actually hard to learn the game. The same goes for trading Cryptocurrencies, it is not an easy game.
Billions of dollars are about to be liquidated from SHORT traders. The All-Time High liquidation. This is a friendly reminder.
» If you are bullish, congratulations. You are good and you will do great.
» If you are bearish, there is still time, you don't have to lose knowing beforehand what will happen next.
The whales and market manipulators are setting up a trap right now, but they can never fool you because you know best.
What do you know?
» You know Bitcoin to be bullish because it is easily trading above 100K.
» You know Bitcoin is rising because it has been moving up since the 7-April low.
» You know a continuation will soon follow because we have signals coming from the Altcoins, the Stock market and Gold. Everything is pointing up.
I know you are smart and thank you for coming back and reading again. In only a matter of days, billions of dollars worth of SHORTs will be liquidated. Make sure not to be caught on the wrong side of the fence.
» Bitcoin is going up.
Namaste.

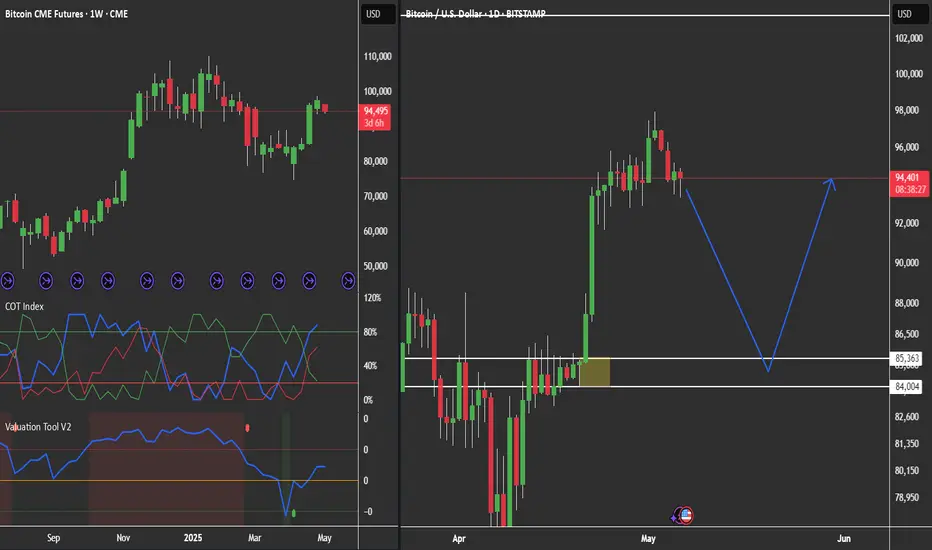
When to buy Crypto and when to sell The only measure I've found that seems to have some consistency to assign relative value to crypto is by comparing BTC futures performance VS Nasdaq Total Return...
When BTC futures are in deep discounts it is time to Buy, when in wide premiums, it is time to sell!
Right now it's time to sell!

BTCUSDT - 4H - GAP 92K - Chicago Futures - SHSBTCUSDT - 4H - POSSIBLE SHS
TRADEX BOT NEWS:
In addition to the automated execution of individual trading strategies, we are working on enabling the bot to perform COPY TRADING STRATEGIES.
We want Trading View developers to be able to monetize their INDICATORS and STRATEGIES by allowing COPY TRADING STRATEGIES.
If the indicator generates profits, the developer will collect a percentage of the profits generated.
We will soon have the first version of the TradeX BOT, which will function as a second-layer Order Book on CEX markets, hiding our greed (TP) and fear (SL) from exchanges.
More news soon!
Thank you!
_______________________________________________________
BTCUSDT - 4H - POSSIBLE SHS
LEVELS:
Resistance: 105k
DYNAMIC SL: 101k
2nd SHOULDER: 91k - 92k
Why could BTC make a SHS breakout?
It seems BTC is again topping out at 105k (coinciding with the horizontal shoulder line).
We have a SELL signal at these levels.
And third, we have a GAP at 92k in the Chicago FUTURES.
If BTC makes this correction, we would have a bullish SHS pattern that could take BTC to 140k.
To be successful in trading, it is essential to be faithful to our strategy. Be clear about where we are, where we want to go, and when it is best to be liquid. __________________________________________________
Automated cryptocurrency trading bots: All of these strategic alternatives can be configured with TradeX BoT, as it allows you to position in both directions without having to lock any amount per position. All that's required is for the conditions, either up or down, to be met for the orders to be executed in either direction, withdrawing the necessary deposits from the portfolio.
TradeX BoT (in development): Tool for automating trading strategies designed in TradingView. It works with indicators and technical drawing tools: parallel channels, trend lines, supports, resistances, etc. It allows you to easily set SL (%), TP (%), Trailing SL, multiple strategies on different securities, simultaneous buy and sell orders, and conditional orders.
This tool is in development, and the beta version will be available soon for testing.
FOLLOW ME and I'll keep you informed of our progress.
I share with you my technical analysis assessments on certain securities that I follow as part of the strategies I design for my portfolio, but I do not recommend trading with these indicators. Get informed, educate yourself, and create your own investment strategies. I hope my comments help you on your journey :)

Bearish sign but we think it pushes to MAJOR RESISTANCEYesterday CRYPTOCAP:BTC formed a BEARISH ENGULFING. We've spoken on this pattern countless times.
However, we didn't bring it up because we didn't/don't think it's relevant.
WHY? Look at the paltry volume. Bitcoin volume is SUPER LOW.
BTC is still in Bullish mode from Late 2022.
---
We turned Bullish again on CRYPTOCAP:BTC around early April:
A) We saw that huge Bitcoin selloff 4/7
2) Which reversed that same day
3) Followed by some buying a couple days later
4) More BTC accumulation 4/21 when it was under 88k
Major resistance coming up soon.
Pause HIGHLY LIKELY.

Bitcoin CME Futures Daily Trend AnalysisMarkets move in cycles, and different cycle durations help confirm trends ranging from short-term to long-term. Based on my analysis of the 5-day cycle, the Bitcoin CME Futures show a bearish signal. This suggests that the closing price on May 16, 2025, is likely to be lower than the opening price on May 13, 2025, which is 103100.
The current trend remains bullish, with a trailing stop-loss placed at 101059. A close below this level would confirm a sell signal.
Disclaimer: This is my personal market view and not a buy or sell recommendation. Traders should conduct their own technical analysis and follow sound risk management practices before taking any position.

BTC CME Gap in Play – Will It Pull Price Lower?📉 BTC CME Gap Alert
There’s a visible gap between 91,950 and 92,560—these often act like magnets, with price revisiting them more often than not. 🕳️
🔍 Why It Matters:
CME gaps tend to get filled, especially in trending markets.
🎯 What to Watch:
If BTC shows signs of weakness near local highs, a short-term move toward this gap is possible.
🚨 Stay alert—this zone could offer entry opportunities or fakeouts before further upside develops.

Big, but biggerIn fact, I think it's possible that BTC will leave a CME gap (yellow box) unfilled for the first time since October 2020, and that we're repeating the marked 2020 fractal in a much bigger way.

War of gapsBTC decided to fill the CME gap at 97.3k first, while the gap at 92k remains unfilled, what makes a retracement to 92k at some point still highly likely since CME gaps almost never remain unfilled.

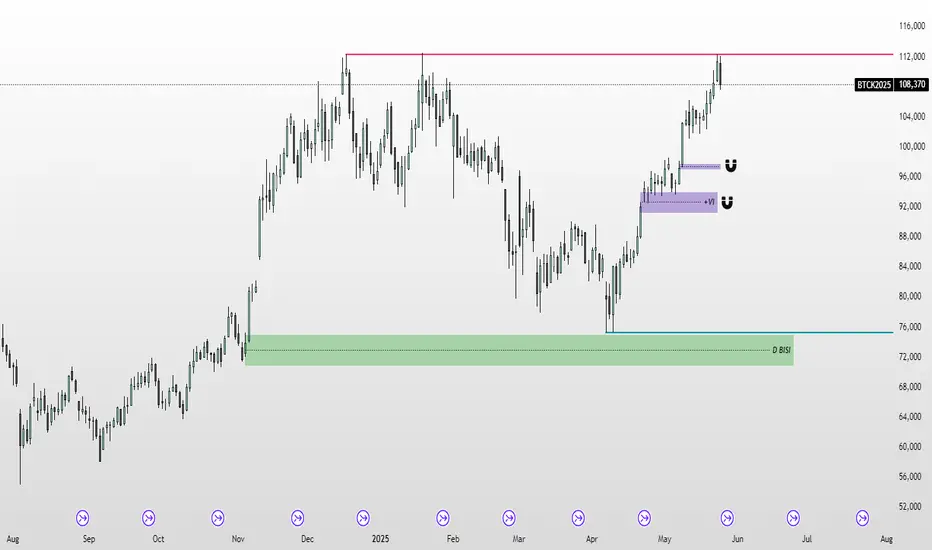
POT Long play $BTCUSDIf by the time that this demand zone get's hit, the red line (retailers) are bearish and atleast 20% line, I'll go for a long play at that Demand zone

Bitcoin: Strength Within the TrendThe Bitcoin chart continues to look constructive, showing strength within a long-term uptrend that’s been in place since 2021.
🔍 While the daily chart may not tell the full story, a look at the weekly chart reveals the bigger picture:
✅ Price recently bounced off the 55-week moving average
✅ Structure remains intact and bullish
✅ The market looks well-positioned to retest the January 2025 high at $110,150
🎯 Longer-term target: Top of the uptrend channel around $113,000 and rising
This long-term view suggests the next leg higher could already be underway.
Disclaimer:
The information posted on Trading View is for informative purposes and is not intended to constitute advice in any form, including but not limited to investment, accounting, tax, legal or regulatory advice. The information therefore has no regard to the specific investment objectives, financial situation or particular needs of any specific recipient. Opinions expressed are our current opinions as of the date appearing on Trading View only. All illustrations, forecasts or hypothetical data are for illustrative purposes only. The Society of Technical Analysts Ltd does not make representation that the information provided is appropriate for use in all jurisdictions or by all Investors or other potential Investors. Parties are therefore responsible for compliance with applicable local laws and regulations. The Society of Technical Analysts will not be held liable for any loss or damage resulting directly or indirectly from the use of any information on this site.

WEEKLY ANALYSIS FOR BITCOIN/BT/BTCBitcoin is one everyone's radar with analysts expecting another bullish run. Prices are definitely looking bullish and I'm on board with the thesis that new highs will soon be delivered, but for now I'm bearish on the next week and think you can enter on better prices.

Could the gap remain unfilled?If BTC doesn't fill the CME gap at around 92K, it will be the first unfilled CME gap since October 2020.
