Solana: On the Verge of a BreakoutCME: Solana ( CME:SOL1! ) and Micro Solana Futures ( CME:MSL1! ), #microfutures
On August 7th, President Donald Trump issued an executive order concerning the 401(k) retirement plans. The key points:
• The order aims to broaden the investment options available to participants in defined contribution plans by directing the Department of Labor (DOL) to explore regulatory changes.
• The order focuses on making "alternative assets" more accessible as investment options, including private equity, private credit, real estate, and digital assets.
• The order directs the DOL to review existing guidance and clarify fiduciary duties regarding alternative assets, with a focus on mitigating litigation risk that might discourage fiduciaries from offering these investment options.
Cryptocurrency market surged upon this big news. This order could open a significant new pool of capital in the form of 401(k) savings to cryptocurrencies. Market size of 401(k) is currently estimated at $8.7 trillion. Potentially, this could expand to cover the $12.2 trillion held in all employer-based defined contribution (DC) retirement plans.
According to CoinMarketCap, as of August 11th, the Top 5 Cryptos by market cap (excluding stablecoins) are:
1. Bitcoin (BTC), $2.4 trillion. At $120K, the king of Cryptos gained 27% year-to-date
2. Ethereum (ETH), $517 billion. At $4300, ETH also gained 27% in 2025
3. XRP, $190 billion ($3.20 each)
4. BNB, $111 billion ($800 each)
5. Solana (SOL), $96 billion. At $180, SOL is down 7.8% year-to-date
Why did SOL fall while BTC and ETH rebounded and reached new highs?
Solana is a blockchain platform that has rapidly gained popularity due to its focus on high speed, scalability, and low transaction costs. It is designed to support a wide range of decentralized applications (dApps), decentralized finance (DeFi) protocols, NFTs, and Web3 applications. Since its launch in March 2020, Solana has quickly become a leading challenger to rival Ethereum.
Solana's price declined in 2025 due to a combination of factors including broader market corrections, a decrease in activity on the network, particularly related to meme coins, and the impact of token unlocks from the FTX bankruptcy. Additionally, the Solana blockchain has experienced several outages, which have negatively impacted investor confidence.
In my opinion, the tail wind propelling BTC and ETH will also push SOL higher. The 401(k) new capital infusion could have an outsized impact on SOL due to its smaller market cap. Bargain hunters may scoop up SOL because of its relatively low prices. Earlier, ETH rebounded from $1,500 to $4,300 after BTC initiated a bull run. A similar catchup rise could happen to SOL.
Trading with SOL and MSL
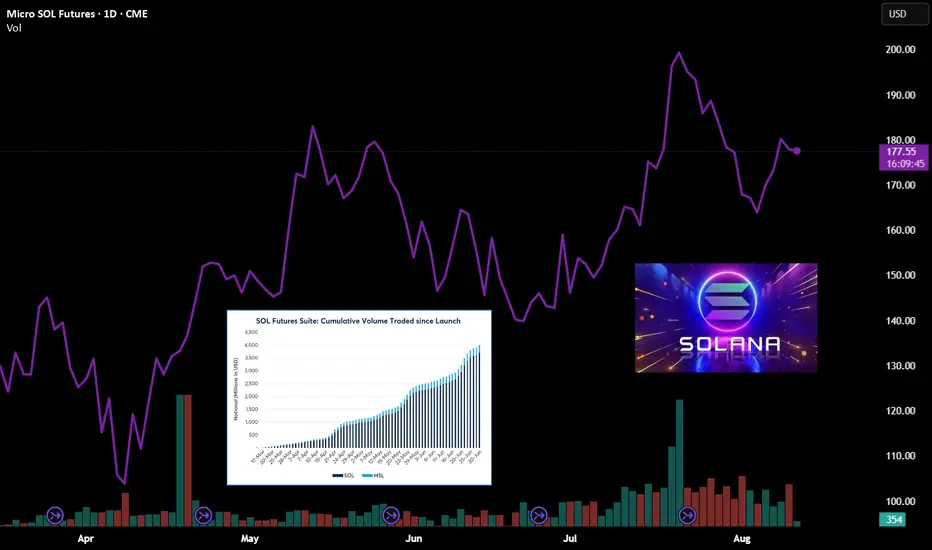
CME Group launched Solana futures (SOL) and Micro Solana futures (MSL) on March 17th. Since launch, SOL and MSL have seen a total of 153.1K contracts traded, representing $4.6B in notional value and 31.2K equivalent SOL.
A trader sharing a bullish view on Solana could explore CME SOL or MSL futures.
SOL futures have a notional value of 500 Solana coins. With the current market price at $180, each SOL contract is valued at $90,000. To buy or sell one contract, a trader is required to post an initial margin of $38,210.
MSL futures have a notional value of 25 coins. Each MSL contract is valued at $4,500 at the current price level. A trader is required to post an initial margin of $1,911.
To maintain a long position in Solana over the long run, while enjoying capital efficiency through leverage, a trader may employ a futures rollover strategy.
Rollover is when a trader moves his position from the front month contract to another contract further in the future, prior to the expiration of his existing holding.
These steps illustrate how to hold a long Micro Solana Futures position overtime:
• In August, a trader buys (going long) a September contract (MSLU5).
• About two weeks before the contract expires on the last Friday in September, the trader will enter an offsetting trade, going short on MBTU5 to close his existing position. He would book a profit or loss, determined by the difference in selling and purchasing prices.
• Simultaneously, the trader would buy a December contract (MSLZ5) and reestablish a long position in Solana.
• In mid-December, the trader will close out MSLZ5 (going short), and buy a March 2026 contract (MSLH6), and continue to hold a long position on Solana.
• The trader would repeat the above steps, so far as he holds a bullish view.
Warnings: Solana prices are extremely volatile. Holding spot Solana coins with no leverage could face potential drawdown of 70%-80%. With leverage embedded in futures, a price move in the wrong direction could quickly deplete the available fund and trigger margin calls.
One advantage Micro Solana futures contracts have over the spot asset is the daily price limit. If MSL moves up or down 10% within the trading day, futures trading will be halted. This will give the market time to cool off and help investors avoid being blown out by short-term panic.
Happy Trading.
Disclaimers
*Trade ideas cited above are for illustration only, as an integral part of a case study to demonstrate the fundamental concepts in risk management under the market scenarios being discussed. They shall not be construed as investment recommendations or advice. Nor are they used to promote any specific products, or services.
CME Real-time Market Data help identify trading set-ups and express my market views. If you have futures in your trading portfolio, you can check out on CME Group data plans available that suit your trading needs www.tradingview.com
MSL1! trade ideas
SOLANA CRYPTO THE RESULT
Follow for more Simple And accurate swing analysis on Indices, Currency, Commodities.
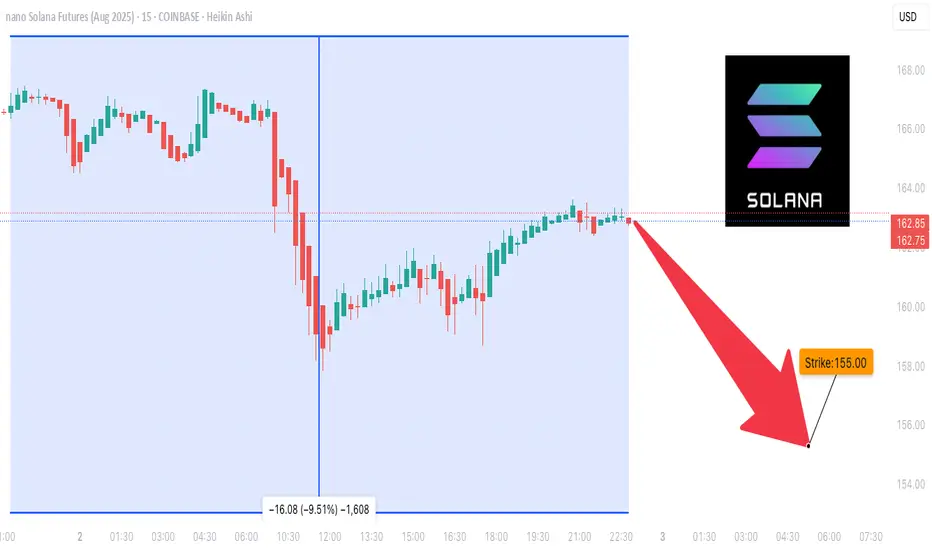
$SOL CRYPTO FUTURES SETUP – BEARISH BIAS (Aug 2, 2025)
🚨 **\ CRYPTOCAP:SOL CRYPTO FUTURES SETUP – BEARISH BIAS** (Aug 2, 2025) 🚨
Multi-Model AI Consensus | 🔻 Short Bias with Defined Risk
---
### 📉 **MARKET CONTEXT**
* **Current Price**: \$158.84
* 🔻 Trading below all key MAs:
* SMA20: \$178.72 (-11.1%)
* SMA50: \$161.29 (-1.5%)
* SMA200: \$162.06 (-2.0%)
* 🔻 Market Structure:
* **Death Cross** confirmed
* **Lower highs/lows** across all timeframes
* **-12.36%** drop over 5 days = capitulation signal
* 🔥 Liquidity Zone: **\$155.29** = key bounce OR breakdown level
* 📉 Volume declining = no buyer conviction
* 💣 Volatility High: BB Width = 26.2% of price (⚠️ Stop risk!)
---
### 🧠 **MULTI-TIMEFRAME MODEL SIGNALS**
**1-Hour**:
🟥 Bearish MACD, RSI \~39 (no reversal yet)
**4-Hour**:
🔻 Still trending down, no structure break
**Daily**:
⚠️ Death Cross active, must hold \$155.29
💡 Reclaim of \$162.06 = **bullish trigger**
---
### 🔬 **TECHNICAL INDICATOR SYNTHESIS**
* **RSI (14)**: 39.84 → nearing oversold
* **MACD**: Strong bearish momentum, no reversal
* **Bollinger Bands**: Price hugging lower band @ \$155.29
* **Volume**: Weak, no accumulation on dips
* **Funding Rate**: Neutral (0.0001%) = no squeeze setup
---
### 🔎 **TRADE SETUP (OA MODEL)**
🛑 **Direction**: SHORT
🎯 **Entry**: \$158.84
📉 **Target**: \$155.29
🛡️ **Stop**: \$161.29
💪 **Confidence**: 80%
🕰️ **Timing**: Market Open
🧠 Model Notes: Favoring momentum short w/ tight stop & fast exit
---
### ❌ **DS MODEL (No Trade)**
🟡 Recommends standing aside due to:
* Missing OI data
* Elevated volatility
* Lack of reversal OR divergence
---
### 🤖 **FINAL CONSENSUS**
🧠 **Models Agreed**: 2
📊 **Average Confidence**: 68%
📉 **Bias**: SHORT
📛 **Risk Level**: MODERATE
🚨 **Key Breakdown**: < \$155.29 = opens door to \$145
---
### ⚠️ **WATCH LEVELS**
* 📈 **Bull Trigger**: Close above \$162.06 (SMA200) + MACD cross
* 📉 **Bear Continuation**: Break < \$155.29 = fast drop to \$145
* 📌 **Optimal Long Setup**: RSI divergence + volume spike @ support
---
🧨 **RISK WARNING**: High volatility zone – futures carry liquidation risk >100%. Always use proper sizing and stops.
---
📢 #CryptoFutures #SOLUSDT #TradingView #AITradeSignal #BearishSetup #SolanaAnalysis #MultiModelConsensus
Fading Risk Sentiment Supports Solana Amid Crypto SlumpLast week, Mint Finance published a comparison of Solana with other blockchain networks, focusing on speed, transaction costs, network size, and valuation. We emphasized Solana’s unique position in the decentralized application (dApp) space—particularly in NFTs and meme coin trading—where it has cultivated a loyal user base by offering low fees and fast transaction speeds.
While Solana’s network growth has been notable, its token performance tells a more nuanced story. The token generally trades with a high correlation to broader crypto markets, though it has experienced periods of divergence that have presented attractive spread opportunities.
Solana sits further out on the risk curve compared to BTC and ETH, exhibiting higher volatility. It tends to outperform in risk-on environments, delivering stronger returns during market rallies. However, during risk-off periods, it typically underperforms as investors favor more established and resilient assets like BTC.
Amid the current turbulence in crypto markets, this paper examines Solana’s relative outlook versus BTC and ETH, and outlines how investors can position accordingly using CME Solana and Micro Solana futures.
Recap of Solana Performance and Volatility
After a strong recovery from its 2022 lows following the FTX collapse, Solana began trading closely in line with BTC throughout 2024. Both were among the top-performing crypto assets last year. However, since January, this trend has reversed, with Solana surrendering most of its year-to-date gains.
Data Source: TradingView
Historical volatility across SOL, ETH, and BTC follows a similar trend but varies in magnitude. SOL consistently exhibits the highest volatility, followed by ETH, with BTC being the least volatile. These differences become more pronounced during volatility spikes, while during calmer periods, their volatility levels tend to converge.
The trend in implied volatility (IV) mirrors that of historical volatility, with SOL showing the highest IV and BTC the lowest. Recently, IV has begun to moderate, driven in part by the tariff rollback.
Relative Performance During Risk-On/Risk-Off Periods
During periods of risk-off sentiment—indicated by spikes in the VIX index—Solana typically underperforms, often experiencing the steepest declines among major crypto assets.
Conversely, during market rallies, Solana tends to outperform, often posting the strongest gains by a significant margin.
Technicals Sentiment
Technical indicators suggest a weakening bearish trend for Solana. Although prices have been declining since January, a rising RSI and MACD are signaling that the downtrend may be approaching a turning point. While the broader macro environment remains challenging, the postponement of U.S. tariffs has offered some short-term relief. Nonetheless, continued macro stress may weigh further on prices. The USD 100 level could serve as a potential support, offering psychological significance for the market.
A review of near-term technical indicators reflects a similar outlook, with multiple signals aligning toward a Buy summary. However, the 1D timeframe still shows a Sell signal, indicating that further downside may be possible before a definitive bottom is established.
In contrast, the near-term outlook for ETH remains bearish, with a Sell signal across most timeframes. Any sentiment improvement has yet to materialize for ETH.
Hypothetical Trade Setup
Solana sits further out on the risk curve compared to assets like ETH and BTC, as reflected in its higher implied and historical volatility, as well as its more extreme price movements. It typically experiences the steepest declines during market corrections but also leads gains during bullish periods.
Since the start of the year, Solana’s price has been in steady decline. However, early technical signals suggest the downtrend may be approaching a turning point, though some near-term weakness could persist.
BTC continues to serve as the crypto market’s safe haven. Despite a 20% correction since January, it has significantly outperformed both SOL and ETH. While Solana has been the weakest performer among the three for most of the downturn, it has recently begun to close the gap with ETH as the correction appears to be nearing its end.
With the performance gap between ETH and SOL narrowing as the correction approaches its end, a tactical long SOL / short ETH position may be attractive. If prices continue to rise or consolidate, SOL is likely to outperform ETH due to its higher beta.
Alternatively, for investors expecting further downside in crypto markets, a long BTC / short SOL position could be compelling. This setup aims to capture relative strength in BTC, which tends to benefit from safe haven flows during periods of market stress.
In order to express these views, investors can deploy CME futures which offer compelling margin offsets for inter-market spreads involving cryptocurrencies which can enhance capital efficiency.
Long Micro SOL, Short Micro ETH
Long 1 x Micro SOL April futures: 117.2 x 25 SOL/contract = notional of USD 2,931
Short 19 x Micro ETH April futures: 1554 x 0.1 ETH/contract x 19 = notional of USD 2,952
This trade requires margin of USD 2,185 as of 11/April (USD 1,255 for 1 x MSL and USD 931 for 19 x MET (49/contract)
CME offers 40% margin offset for this trade as of 11/April reducing margin requirements to USD 1,311
A hypothetical trade setup with a 2x reward to risk ratio is described below:
Long Micro BTC, Short Micro SOL
Long 1 x Micro BTC April futures: 81,250 x 0.1 BTC/contract = notional of USD 8,125
Short 3 x Micro SOL April futures: 117.2 x 25 SOL/contract x 3 = notional of USD 8,793
This trade requires margin of USD 5,678 as of 11/April (USD 1,913 for 1 x MBT and USD 3,765 for 3 x MSL (1,255/contract)
CME offers ~25% margin offset for this trade as of 11/April reducing margin requirements to USD 4,261
A hypothetical trade setup with a reward to risk ratio of 1.6x is described below:
To access the standard size contract spreads, investors can use the ratios of 1 x BTC to 6 x SOL and 2 x ETH to 3 x SOL.
MARKET DATA
CME Real-time Market Data helps identify trading set-ups and express market views better. If you have futures in your trading portfolio, you can check out on CME Group data plans available that suit your trading needs tradingview.com/cme .
DISCLAIMER
This case study is for educational purposes only and does not constitute investment recommendations or advice. Nor are they used to promote any specific products, or services.
Trading or investment ideas cited here are for illustration only, as an integral part of a case study to demonstrate the fundamental concepts in risk management or trading under the market scenarios being discussed. Please read the FULL DISCLAIMER the link to which is provided in our profile description.

Primer: Solana - A Blazing BlockchainCME Group’s newly launched Solana futures enable institutional grade access to the cryptocurrency, offering investors access to compelling relative value opportunities.
This paper provides a background to Solana in relation to other major blockchain networks and cryptocurrencies. Mint Finance will outline the execution of crypto market spread trades using CME futures in an upcoming paper.
Solana is a high-performance public blockchain launched in 2020 by Solana Labs, founded by Anatoly Yakovenko (a former Qualcomm engineer). Yakovenko first proposed Solana’s novel Proof of History (PoH) concept in 2017 as a solution to blockchain scalability. He assembled a founding team including former Qualcomm colleague Greg Fitzgerald and others and named the project after a California beach town.
Backed by early venture funding, Solana’s mainnet launched in March 2020. The vision was to enable ultra-fast, low-cost transactions for decentralized applications (e.g. DeFi, gaming), addressing limitations of Bitcoin & Ethereum in speed and fees.
Solana has grown rapidly to become one of the most used networks and amassed a market cap of USD 64 billion, making it one of the largest digital assets. What is behind the massive surge? Is it due to flip ETH as the home of DeFi?
How Does Solana’s Blockchain Rank?
While Solana’s low fees and fast transaction speeds have driven high trading volume, transaction count, and wallet growth, it still trails ETH in Total Value Locked (TVL). To achieve its high transaction throughput, Solana has made certain compromises on decentralization.
In terms of ecosystem development, Solana is seeing rapid growth. The Electric Capital 2024 developer report found Solana attracted the most new developers in 2024 – more than any other ecosystem (even Ethereum’s, despite Ethereum’s broader base).
Solana now has ~2,500 monthly active developers, second only to Ethereum’s ~8,900 (which includes many working on Layer-2s). This loyal & expanding developer base has been a key factor behind Solana’s explosive growth.
DEX Surge and Meme Coin Mania
Solana’s early growth was driven by NFTs, supported by low fees and a loyal community that made it a hub for NFT trading. These factors continued to attract users even after the NFT boom subsided. Its fast, low-cost blockchain and strong developer base have enabled the launch of many user-friendly and popular applications. More recently, Solana’s growth has been fuelled by surging decentralized exchange (DEX) volumes and a wave of meme coin minting.
By November 2024, meme coin trading accounted for an all-time high 65% of monthly DEX volume on Solana’s largest DEX, Raydium. Raydium even overtook Uniswap in monthly volume that month.
Solana’s advantages in cost and speed have been pivotal in this trend. Transaction fees on Solana are negligible and on-par with L2 chains. This cost advantage makes minting and trading low-value tokens (like meme coins) economically feasible on Solana but prohibitively expensive on Ethereum layer-1. Similarly, Solana’s block times (~0.4 seconds) and high throughput enable rapid trading. Traders can execute many rapid swaps on Solana DEXs without the delays and slippage that Ethereum’s ~12-second blocks and occasional congestion introduce. Solana’s speed and low fees thus attracted a flood of retail speculators for meme coins and high-frequency trading strategies.
Ethereum’s ecosystem still offers deeper liquidity and broader dApp selection, but Solana capitalized on specific niches (e.g. meme coins, real-time trading) where Ethereum’s costs are a barrier.
However, this explosive growth was not without turbulence. In early 2025, a “meme coin meltdown” saw activity cooling off after several scam tokens collapsed. By February 2025, Solana’s share of total on-chain DEX volume, which had topped 51% in January, retreated to 24% as some froth cleared.
Data Source: Artemis
Scandals like a fake “Libra” token (which vaporized $4.4B in market cap) and a Trump-themed token rug pull dented retail sentiment. Even so, Solana’s DEX volumes remain on par with Ethereum’s entire ecosystem (L1 + L2), a remarkable feat. VanEck’s Feb 2025 report noted that despite an 80%+ drop in new meme token launches since January, Solana DEX activity “is still holding its own – roughly matching the entire ETH ecosystem”.
In short, the meme coin mania has demonstrated Solana’s capacity to manage massive retail-driven bursts of activities that might overwhelm other chains.
Market Metrics For BTC, ETH, and SOL
Since the bottom of the bear market following the FTX collapse. Solana has delivered a stunning recovery, far outperforming both BTC and ETH, but the massive gains were partly explained by the much sharper decline following FTX.
During 2024, SOL performance moved in lockstep with BTC with both assets delivering stunning returns. However, the performance diverged sharply after Jan/2025, coinciding with the collapse in DEX trading volume. The sharp correction since has erased most of the 2024 gains while BTC has remained resilient.
Solana has, nevertheless, managed to outperform ETH which has suffered an even deeper correction over the past few months.
Data Source: TradingView
Historical volatility for all three assets shows a similar trend but differ in magnitude. SOL has the highest volatility while ETH follows second and BTC is least volatile. During spikes, the differences become exaggerated, but during lows, the values can reach similar lows.
For traders, higher volatility can be both an opportunity and a risk.
While SOL’s performance is positively correlated with both ETH and BTC, this correlation breaks frequently (more commonly with ETH) and these periods of divergence present compelling spread opportunities.
The trend for implied volatility (IV) is like HV with SOL’s IV the highest and Bitcoin’s IV the lowest. Recently, IV has started to edge up again following a decline through March.
Trading Solana and Crypto Spreads
With the launch of CME’s Solana and Micro Solana futures, investors can express views on Solana’s growth and take tactical positions that benefit from relative outperformance. Mint Finance will outline the execution of crypto market spread trades using CME futures in an upcoming paper.
CME Solana futures provide exposure to 500 SOL per futures contract and reference the CME CF Solana-Dollar Reference Rate.
CME Micro Solana futures offer a smaller notional value to create more balanced spreads and for fine-tuning exposure. The micro contract provides exposure to 25 SOL.
Additional details about the contract including margins, calendars, and specifications are available on the CME Solana product page .
MARKET DATA
CME Real-time Market Data helps identify trading set-ups and express market views better. If you have futures in your trading portfolio, you can check out on CME Group data plans available that suit your trading needs tradingview.com/cme .
DISCLAIMER
This case study is for educational purposes only and does not constitute investment recommendations or advice. Nor are they used to promote any specific products, or services.
Trading or investment ideas cited here are for illustration only, as an integral part of a case study to demonstrate the fundamental concepts in risk management or trading under the market scenarios being discussed. Please read the FULL DISCLAIMER the link to which is provided in our profile description.

