S&P 500, what target for the end of 2025?With the S&P 500 index (the S&P 500 future contract is used as a reference in this analysis) having surpassed its all-time record of 6,165 points at the end of June, and still against a backdrop of trade diplomacy, what technical and fundamental price target can we aim for over the next 12 months? 6,500 points? 6,700 points? 7,000 points? To answer this question, we need to cross-reference the median opinions of financial analysts with the theoretical objectives of technical analysis to assess the remaining potential of the S&P 500.
In terms of fundamentals, the new deadline for trade negotiations between the United States and its trading partners is Friday August 1, and the Fed is unlikely to cut the federal funds rate on Wednesday July 30.
1) Fundamentals and technical analysis: what are the common targets for the end of 2025?
I'd like to start by looking ahead to the next few months and establishing an average target for the S&P 500 between now and the end of the year. Naturally, this is a medium-term projection (several months) and leaves room for short-term correction/retraction phases. Bear in mind that even an underlying uptrend alternates between bullish impulses and short-term correction periods.
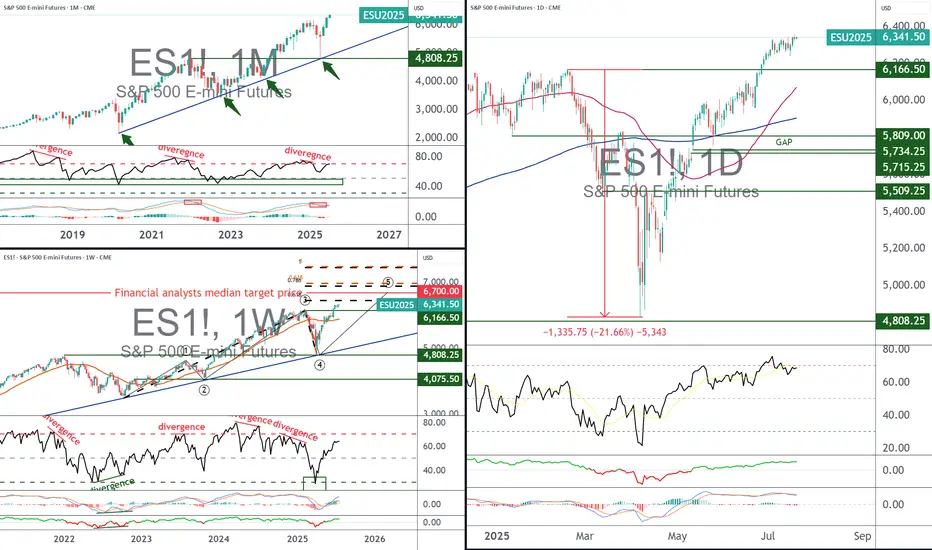
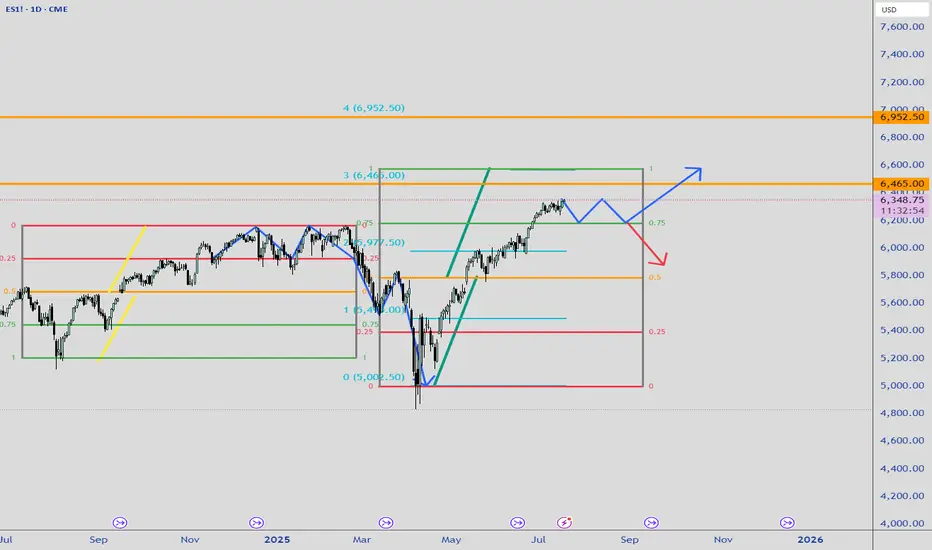
According to FactSet, financial analysts' median price target for the S&P 500 over the next 12 months is 6,700 points. As for the theoretical price targets of technical analysis, they are based here on Elliott waves and Fibonacci extensions, giving a range of between 6450 points and 6900 points.
The chart below shows the Japanese candlesticks in weekly data for the S&P 500 future contract with theoretical technical targets based on Fibonacci extensions.
The chart below comes from FactSet and represents the median target of financial analysts for the S&P 500 index with a 12-month horizon
2) Market tops are built on euphoria, and at this stage, sentiment indicators are not in a state of extreme optimism
Is the underlying bullish move under threat from market sentiment that has become over-optimistic? The answer is negative, according to the latest sentiment survey from the American Association of Retail Investors (AAII). The seller's tank is still full, with 39% expecting a bear market. Bear in mind that final market tops are built in euphoria, when the % of sellers falls to the bottom.
The survey below is conducted once a week by the American Retail Investor Association
3) Quantitative analysis does not yet describe an extreme overbought technical situation for S&P 500 stocks
Another approach, the quantitative approach to financial markets, also shows that the market is not yet in a risk zone of hyper-exposure to buying. The percentage of S&P 500 stocks above the 50-day moving average is not yet in the overbought zone.
In conclusion, although there will always be short-term technical corrections, the underlying uptrend of the S&P 500 is not threatened at this stage.
The blue curve below represents the percentage of S&P 500 stocks above the 50-day moving average. This is a quantitative analysis of the financial markets.
DISCLAIMER:
This content is intended for individuals who are familiar with financial markets and instruments and is for information purposes only. The presented idea (including market commentary, market data and observations) is not a work product of any research department of Swissquote or its affiliates. This material is intended to highlight market action and does not constitute investment, legal or tax advice. If you are a retail investor or lack experience in trading complex financial products, it is advisable to seek professional advice from licensed advisor before making any financial decisions.
This content is not intended to manipulate the market or encourage any specific financial behavior.
Swissquote makes no representation or warranty as to the quality, completeness, accuracy, comprehensiveness or non-infringement of such content. The views expressed are those of the consultant and are provided for educational purposes only. Any information provided relating to a product or market should not be construed as recommending an investment strategy or transaction. Past performance is not a guarantee of future results.
Swissquote and its employees and representatives shall in no event be held liable for any damages or losses arising directly or indirectly from decisions made on the basis of this content.
The use of any third-party brands or trademarks is for information only and does not imply endorsement by Swissquote, or that the trademark owner has authorised Swissquote to promote its products or services.
Swissquote is the marketing brand for the activities of Swissquote Bank Ltd (Switzerland) regulated by FINMA, Swissquote Capital Markets Limited regulated by CySEC (Cyprus), Swissquote Bank Europe SA (Luxembourg) regulated by the CSSF, Swissquote Ltd (UK) regulated by the FCA, Swissquote Financial Services (Malta) Ltd regulated by the Malta Financial Services Authority, Swissquote MEA Ltd. (UAE) regulated by the Dubai Financial Services Authority, Swissquote Pte Ltd (Singapore) regulated by the Monetary Authority of Singapore, Swissquote Asia Limited (Hong Kong) licensed by the Hong Kong Securities and Futures Commission (SFC) and Swissquote South Africa (Pty) Ltd supervised by the FSCA.
Products and services of Swissquote are only intended for those permitted to receive them under local law.
All investments carry a degree of risk. The risk of loss in trading or holding financial instruments can be substantial. The value of financial instruments, including but not limited to stocks, bonds, cryptocurrencies, and other assets, can fluctuate both upwards and downwards. There is a significant risk of financial loss when buying, selling, holding, staking, or investing in these instruments. SQBE makes no recommendations regarding any specific investment, transaction, or the use of any particular investment strategy.
CFDs are complex instruments and come with a high risk of losing money rapidly due to leverage. The vast majority of retail client accounts suffer capital losses when trading in CFDs. You should consider whether you understand how CFDs work and whether you can afford to take the high risk of losing your money.
Digital Assets are unregulated in most countries and consumer protection rules may not apply. As highly volatile speculative investments, Digital Assets are not suitable for investors without a high-risk tolerance. Make sure you understand each Digital Asset before you trade.
Cryptocurrencies are not considered legal tender in some jurisdictions and are subject to regulatory uncertainties.
The use of Internet-based systems can involve high risks, including, but not limited to, fraud, cyber-attacks, network and communication failures, as well as identity theft and phishing attacks related to crypto-assets.
ES1! trade ideas
ES Weekly Outlook & Game Plan 20/07/2025ES Weekly Outlook & Game Plan
🧠 Fundamentals & Sentiment
Market Context:
ES continues its bullish momentum, driven by institutional demand and a supportive U.S. policy environment.
📊 Technical Analysis:
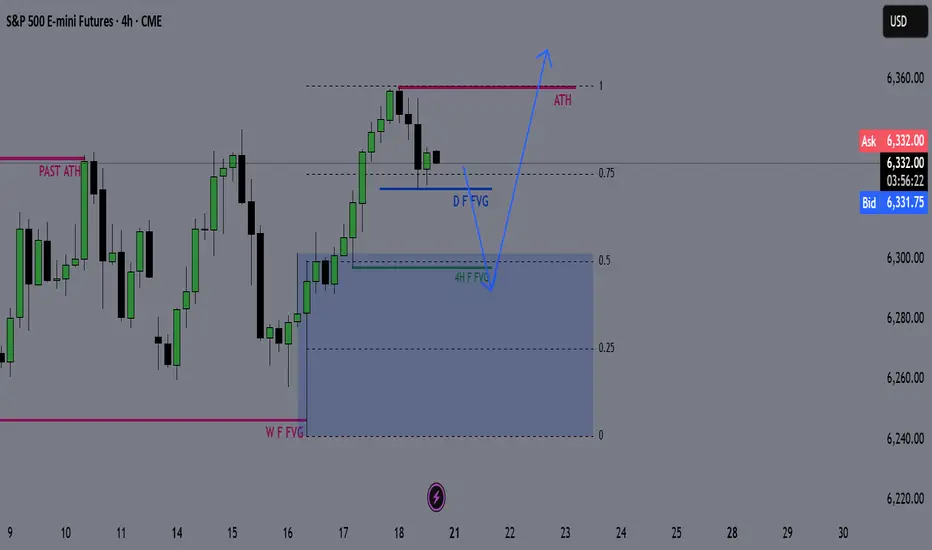
Price is currently in price discovery, and the weekly structure remains strongly bullish — so I prefer to follow the strength.
We might see a minor retracement before pushing further above the all-time high (ATH).
🎯 Game Plan:
I'm expecting a potential retracement to the 0.5 Fibonacci level, which is the discount zone in a bullish environment.
Interestingly, the 4H liquidity zone aligns perfectly with the 0.5 Fib level — this confluence suggests price may gather enough energy from there to make new highs.
✅ Follow for weekly recaps & actionable game plans.
NASDAQ: Still Bullish! Look For Valid Buys!Welcome back to the Weekly Forex Forecast for the week of July 21-25th.
In this video, we will analyze the following FX market:
NASDAQ (NQ1!) NAS100
The Stock Indices are strong, and showing no signs of selling off. Buy it until there is a bearish BOS.
Enjoy!
May profits be upon you.
Leave any questions or comments in the comment section.
I appreciate any feedback from my viewers!
Like and/or subscribe if you want more accurate analysis.
Thank you so much!
Disclaimer:
I do not provide personal investment advice and I am not a qualified licensed investment advisor.
All information found here, including any ideas, opinions, views, predictions, forecasts, commentaries, suggestions, expressed or implied herein, are for informational, entertainment or educational purposes only and should not be construed as personal investment advice. While the information provided is believed to be accurate, it may include errors or inaccuracies.
I will not and cannot be held liable for any actions you take as a result of anything you read here.
Conduct your own due diligence, or consult a licensed financial advisor or broker before making any and all investment decisions. Any investments, trades, speculations, or decisions made on the basis of any information found on this channel, expressed or implied herein, are committed at your own risk, financial or otherwise.

S&P 500: Buyers Are Still In Control! Continue To Look For LongsWelcome back to the Weekly Forex Forecast for the week of July 21-25th.
In this video, we will analyze the following FX market:
S&P 500 (ES1!)
The Stock Indices are strong, and showing no signs of selling off. Buy it until there is a bearish BOS.
Enjoy!
May profits be upon you.
Leave any questions or comments in the comment section.
I appreciate any feedback from my viewers!
Like and/or subscribe if you want more accurate analysis.
Thank you so much!
Disclaimer:
I do not provide personal investment advice and I am not a qualified licensed investment advisor.
All information found here, including any ideas, opinions, views, predictions, forecasts, commentaries, suggestions, expressed or implied herein, are for informational, entertainment or educational purposes only and should not be construed as personal investment advice. While the information provided is believed to be accurate, it may include errors or inaccuracies.
I will not and cannot be held liable for any actions you take as a result of anything you read here.
Conduct your own due diligence, or consult a licensed financial advisor or broker before making any and all investment decisions. Any investments, trades, speculations, or decisions made on the basis of any information found on this channel, expressed or implied herein, are committed at your own risk, financial or otherwise.

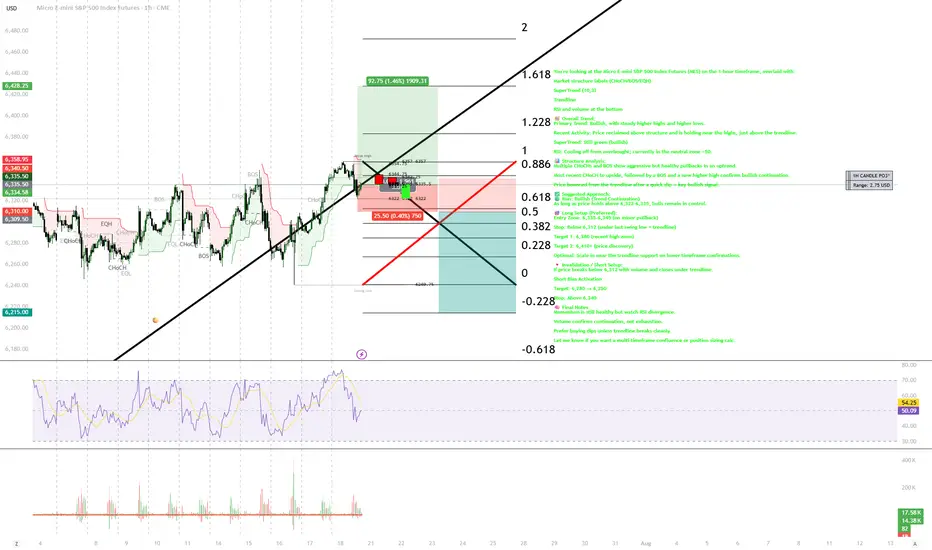
CHAT GPT TRADING You're looking at the Micro E-mini S&P 500 Index Futures (MES) on the 1-hour timeframe, overlaid with:
Market structure labels (CHoCH/BOS/EQH)
SuperTrend (10,3)
Trendline
RSI and volume at the bottom
🧭 Overall Trend:
Primary Trend: Bullish, with steady higher highs and higher lows.
Recent Activity: Price reclaimed above structure and is holding near the highs, just above the trendline.
SuperTrend: Still green (bullish)
RSI: Cooling off from overbought; currently in the neutral zone ~50.
📊 Structure Analysis:
Multiple CHoCHs and BOS show aggressive but healthy pullbacks in an uptrend.
Most recent CHoCH to upside, followed by a BOS and a new higher high confirms bullish continuation.
Price bounced from the trendline after a quick dip — key bullish signal.
✅ Suggested Approach:
🟢 Bias: Bullish (Trend Continuation)
As long as price holds above 6,322–6,335, bulls remain in control.
🎯 Long Setup (Preferred):
Entry Zone: 6,335–6,345 (on minor pullback)
Stop: Below 6,312 (under last swing low + trendline)
Target 1: 6,380 (recent high zone)
Target 2: 6,410+ (price discovery)
Optional: Scale in near the trendline support on lower timeframe confirmations.
🔻 Invalidation / Short Setup:
If price breaks below 6,312 with volume and closes under trendline:
Short Bias Activation
Target: 6,280 → 6,250
Stop: Above 6,340
🧠 Final Notes:
Momentum is still healthy but watch RSI divergence.
Volume confirms continuation, not exhaustion.
Prefer buying dips unless trendline breaks cleanly.
Let me know if you want a multi-timeframe confluence or position sizing calc.
ID: 2025 - 0084.16.2025
Trade #8 of 2025 executed. So simple, yet far from easy...
Trade entry at 93 DTE (days to expiration).
The last few weeks have been quite challenging, mostly due to increase volatility (3rd highest expansion in history), as well as widening bid/ask spreads. This trade idea will dovetail with trade id: 006 to balance delta without incurring more slippage due to spreads. This trade will hold to expiration without any adjustments until the final 30 days of trade life.
Happy Trading!
-kevin

Inside day on MondayThe structure in the daily S&P 500 chart implies an inside day for Monday. It indicates a loss of momentum and is potentially bearish.

DIYWallSt Trade Journal:$238 Lessons From Monthly Expiration07/18/25 Trade Journal, and ES_F Stock Market analysis
EOD accountability report: +238.75
Sleep: 5. hours
Overall health: Was working late last night and didn't get much sleep.
VX Algo System Signals from (9:30am to 2pm)
— 8:30 AM Market Structure flipped bullish on VX Algo X3!
— 10:30 AM Market Structure flipped bearish on VX Algo X3!
— 11:10 AM VXAlgo ES X1 Buy signal (didn't work that well)
— 12:10 PM VXAlgo NQ X1DD Sell Signal
— 12:19 PM Market Structure flipped bullish on VX Algo X3!
What’s are some news or takeaway from today? and What major news or event impacted the market today?
Today was monthly expiration for options and we got a lot of X7 Sell signals but structure was bullish so I tried to take a long at MOB and got burned. Flipped bearish and started shorting the rest of the day and ended up making money back.
News
*US STOCKS MOVE LOWER AFTER REPORT SAYS TRUMP PUSHES FOR 15-20% MINIMUM TARIFF ON ALL EU GOODS
What are the critical support levels to watch?
--> Above 6335= Bullish, Under 6315= Bearish
Video Recaps -->https://www.tradingview.com/u/WallSt007/#published-charts

ES! Daily LookWe are still in Mid-month of July and Markets is still strongly bullish. A retracement to previous pivots before completing the symmetry might be a high probability case here. Let see how it turn on in the next few days.
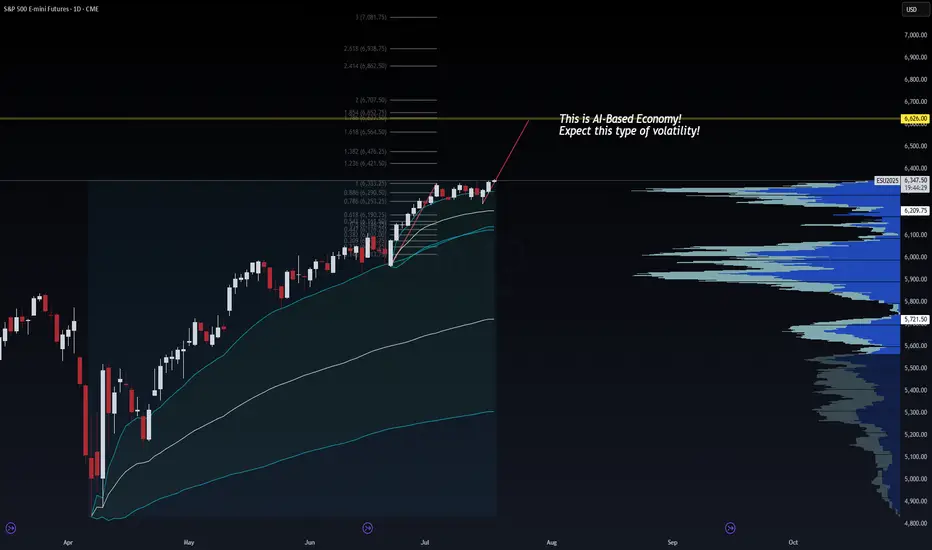
AI Economy Surge: ES Heading to 6626? | VolanX Protocol in Actio🧠 AI Economy Surge: ES Heading to 6626? | VolanX Protocol in Action
📅 Date: July 17, 2025
📈 Instrument: ESU2025 – S&P 500 E-mini Futures
🔍 Timeframe: Daily
🔗 Powered by: WaverVanir DSS | VolanX Protocol
🌐 Macro Backdrop:
📉 Fed on Pause: Market pricing implies a 70% probability of a rate cut in September 2025, driven by disinflation, labor softness, and rising default rates in CRE and consumer credit.
🤖 AI Productivity Shock: Mega-cap tech is driving EPS beats, but real productivity gains are lumpy. We're witnessing a volatile transition to an AI-dominated economy.
💼 Liquidity Conditions: Treasury issuance rising but absorbed for now. Reverse repo drains slowing. This creates windows of upward momentum, though fragile.
📊 Technical Outlook (VolanX DSS):
Price rejected 0.786–0.886 retracement zone, confirming institutional defense near 6,300.
Momentum has shifted back to bulls with a clean reclaim of short-term VWAP bands.
Fibonacci extension targets:
🎯 1.236 = 6,421.50
🎯 1.618 = 6,654.50
🟡 High-probability magnet = 6,626 (aligned with 1.5 std dev extension + volume node gap fill)
📌 Key Levels:
Support: 6,290 • 6,209 (HVN) • 5,721 (Macro POC)
Resistance: 6,421.5 • 6,626 • 6,938
🎯 Trade Setup (Options Strategy):
🛠️ High Conviction Trade – Bull Call Spread
Buy ESU25 6350 Call
Sell ESU25 6625 Call
DTE: 30–45 days
Max Risk: Defined
Max Reward: Captures full extension to 6625 zone
✅ This spread is risk-defined, benefits from moderate upside, and avoids IV crush vs outright long call.
🎯 Use if you expect a grind higher with spikes, not a straight melt-up.
Trade Journal: Missed Morning Move & Trading Into New Highs07/17/25 Trade Journal, and ES_F Stock Market analysis
EOD accountability report: +447.50
Sleep: 5 hours
Overall health: My health ring is signaling that my body isn't well the last few days.
VX Algo System Signals from (9:30am to 2pm)
— 8:53 AM Market Structure flipped bullish on VX Algo X3!
— 12:17 PM VXAlgo ES X1 Sell Signal (triple sell signal)
— 1:12 PM VXAlgo ES X3 Sell Signal
— 1:40 PM VXAlgo NQ X1DD Buy Signal
What’s are some news or takeaway from today? and What major news or event impacted the market today?
Today was a bit of a rough trading day, I missed the morning move and was a bit hesitant to make trades.
Saw a lot of MM positioning high up around 6340s and wasn't sure where to get a good entry. Wanted to go in at the MOB but they never went down there.
Sell signals were not as effective today because MM wanted to make ATH but i couldn't figure out the reasoning.
News
S&P 500 ENDS AT A NEW RECORD HIGH, VIX FALLS AS STOCKS RALLY ON SOLID EARNINGS, STRONG ECONOMIC DATA
What are the critical support levels to watch?
--> Above 6300= Bullish, Under 6290= Bearish
Video Recaps -->https://www.tradingview.com/u/WallSt007/#published-charts

Momentum to the buy sideThe S&P 500 daily chart is exhibiting momentum to the buy side with a positive reaction to earnings and economic reports. The next challenge will be a close above 6360 per Friday.

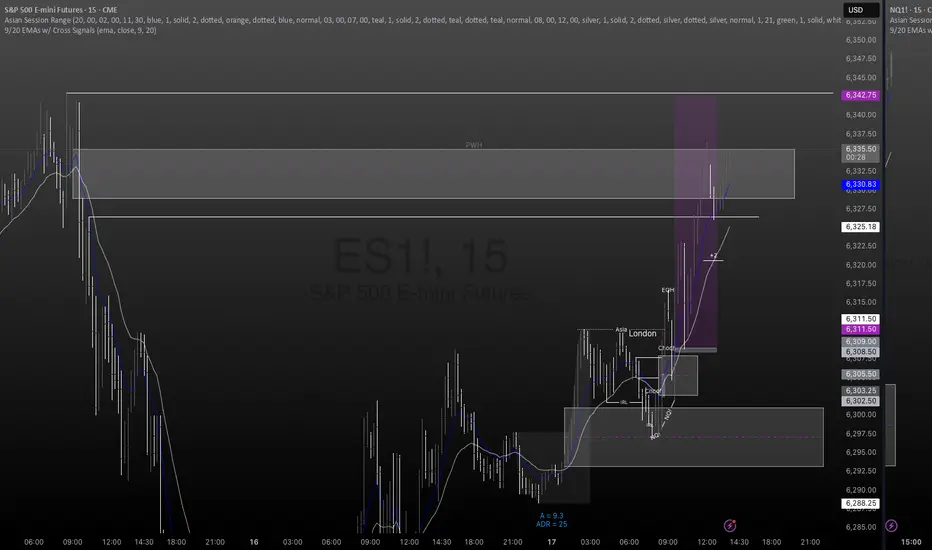
ES! Longs 7RRCRT for Bullish Daily bias
9.30 Sweep on NQ, ES failed to take lows but reacted from 15m FVG
Targets Daily CRT candle high for 7RR clean trade
Tap In!!
#EUBOOGIE
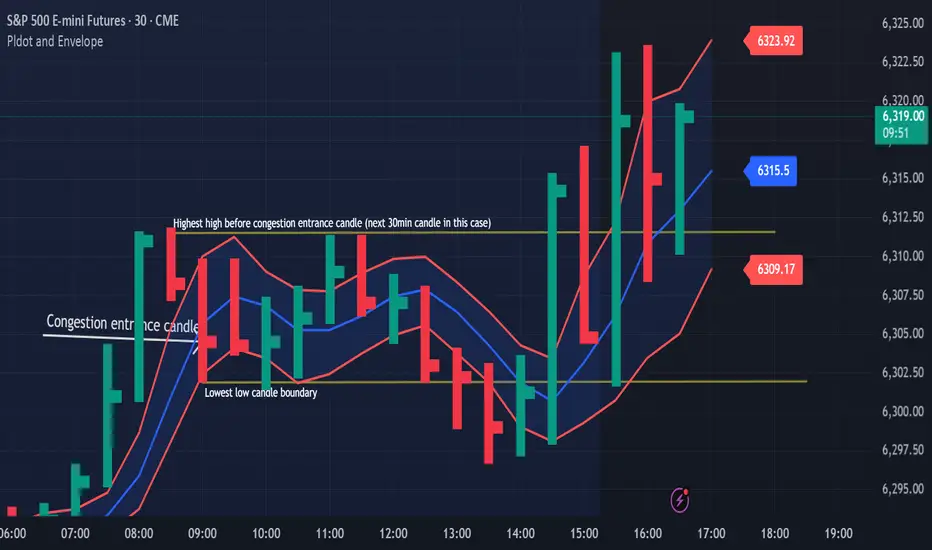
Congestion Action vs Congestion Exit – Mastering the TransitionWhen markets go quiet and churn sideways, it’s easy to get lost in the noise. But inside that congestion lies opportunity — if you understand the difference between "Congestion Action" and "Congestion Exit." Here’s how to apply Drummond Geometry to trade these phases with precision:
🔹 Congestion Action
Congestion action is when the market is not ready to trend — it's swinging back and forth within a defined range, between a strong block level and a well-established dotted line. Think of it as a "resting zone" before the next directional move.
📏 Original Confines: Highest high and lowest low after a congestion entrance as shown on the chart
🚧 Expanded Confines: Price temporarily breaks out of the range but doesn’t establish a trend (3 closes on the came side of the PLdot (blue line)).
🧲 This is where scalpers and range traders thrive. Look for setups near envelope confines and use nearby energy fields.
✅ Trade Plan: Play the range — buy support, sell resistance — until proven otherwise.
🔸 Congestion Exit
This is when the market transitions from ranging to trending — a trend run begins from within the congestion zone.
🚀 First bar of a new trend closes outside the congestion confines (either the block level (highest high on the chart) or the dotted line (the low on the chart)).
📊 The next bar must confirm with a trend run close — if not, it’s a failed breakout. You can see on the chart that price tried to trend lower but the trend was not confirmed!
⚡ Patterns to watch:
Energy pushing in the direction of the exit (PL Dot push, c-wave continuation).
6-1 lines against the breakout direction disappear.(Not visible in this version)
Resistance/support against the exit breaks.
✅ Trade Plan: Enter on breakout confirmation, not just the breakout bar. Measure energy and watch the follow-through.
🧭 Tip:
Don't get faked out. If price re-enters congestion after a breakout, re-draw the boundaries — the old congestion is no longer valid.
🔥 Bottom Line:
Congestion Action is where the market breathes. Congestion Exit is where it moves. Mastering the handoff between the two gives you a decisive edge.
SP500 ES Weekly Recap | ATH Deviation → Pullback or Powell Pump?Overview:
ES made a new all-time high last week, sweeping the previous high with strong momentum.
However, the move ended up being a deviation, and the price quickly reversed — suggesting short-term exhaustion.
Bearish Scenario (Baseline):
🔻 Rejection from ATH
🔻 Possible retracement targets:
12H Swing Low (turquoise line)
Weekly Fair Value Gap (purple zone)
I believe a pullback into those levels could provide bullish continuation setups for new highs. I’ll look for LTF confirmation once price reaches those zones.
Bullish Scenario (Catalyst-Driven):
🚨 If Fed Chair Powell resigns this week (a circulating macro rumor), the market may not wait for retracement.
This could lead to an aggressive breakout, driving ES and risk assets straight into new ATHs again.
Plan:
✅ Watch for LTF confirmation after pullback
✅ Stay open to both scenarios
✅ Focus on HTF bullish structure as long as key levels hold

Neutral zone structureThe daily chart in the S&P 500 has created a neutral zone structure. This implies a sideways move, which is what I'm looking for but with a positive close.

DIYWallSt Trade Journal: How I Navigated Powell Firing Rumors & 07/16/25 Trade Journal, and ES_F Stock Market analysis
EOD accountability report: +428.75
Sleep: 7 hours
Overall health: Good
VX Algo System Signals from (9:30am to 2pm)
— 4:17 AM Market Structure flipped bullish
— 9:50 AM Market Structure flipped bearish
— 12:00 PM VXAlgo NQ X3 Buy Signal
— 1:02 PMMarket Structure flipped bullish
What’s are some news or takeaway from today? and What major news or event impacted the market today?
Today was a crazy trading day with a bunch of wild moves because Trump said they were going to fire Powell and then cancelled the threat.
Overall health and sleep have been good this week and our trading balance is reflecting that.
News
— 10:30 AM *SCOTT BESSENT: “FORMAL PROCESS” TO REPLACE FED CHAIR POWELL UNDERWAY
— 12:11 PM
*TRUMP ASKED IF HE WILL FIRE POWELL: NOT PLANNING ON DOING ANYTHING
What are the critical support levels to watch?
--> Above 6290= Bullish, Under 6280= Bearish
Video Recaps -->https://www.tradingview.com/u/WallSt007/#published-charts

Using 1 min time frame for entries on VX algo & day tradingwhat time frames do you use to confirm entries outside of a buy signal?
If I am day trading, I will mainly use the 1 minute time frame to look for moving average support and resistance, and read the candle stick patterns as well from that chart.
However, there are times I'll switch to a 5 minute and 10 minute time frame to take a look at levels for moving averages and see what the candle stick patterns are from there.
So for example, today we had 3 of the x1 sell signals around 9:31, so we pull up the 1 min chart, we are getting confirm break of the 1st moving average support = bearish confirmation #1, follow by DHC = Bearish confirmation #2 , and the sell signal is already 3 confirmations, so we need to short ASAP.

Lack of commitmentThere was a lack of commitment from buyers on the daily chart in the S&P 500. Although the session started out with buyers moving the market to new highs, it failed to maintain that upward momentum. This volatility could continue on Wednesday with the release of PPI.

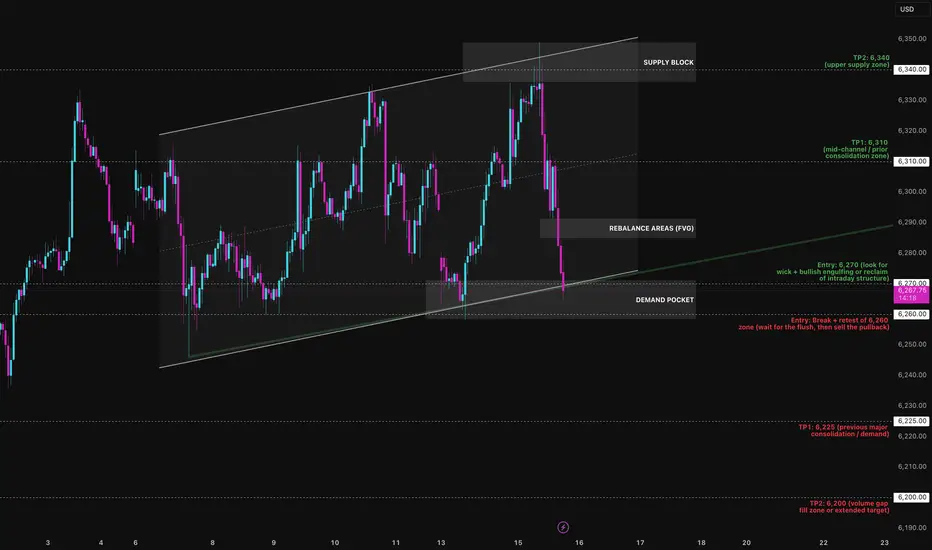
Bounce or Burial? The MES Funeral is Loading…The Micro E-mini S&P is walking a tightrope. After weeks of controlled movement within a rising parallel channel, price has now slammed into the lower boundary and the next move will define the week's direction.
I've mapped the channel from the July 2 low, with multiple precise touches on both upper and lower boundaries. Currently, MES is printing a heavy rejection from the 6360 supply zone, falling nearly 90 points back to the channel’s base near 6270.
Preferred Bias: Short-term Bearish Until Reclaimed
While the macro structure is still technically bullish (channel intact), momentum, supply pressure, and volume structure suggest sellers are gaining the upper hand:
- Mid-channel equilibrium (EQ) at 6310 was sliced without bounce
- No absorption yet at 6270 demand box
- Previous rally legs show decreasing impulsiveness — weakening buyers
Unless bulls aggressively defend 6270 with a reclaim candle or V-shape wick, this looks like a liquidity tap + structural breakdown loading up.
Bearish Play: “Channel Collapse Incoming”
Entry: Break + retest of 6,255–6,260 zone
SL: 6,275 (above retest structure)
TP1: 6,225
TP2: 6,180
Confluences:
- Channel break
- No support bounce at EQ
- Supply rejection at 6360
- Volume void below 6250
Bullish Play (Countertrend Fade): “Defend the Line”
Entry: Bounce off 6,270 with bullish engulfing or reclaim
SL: 6,255 (invalidate structure)
TP1: 6,310 (mid-channel)
TP2: 6,340–6,360 (supply reload zone)
Only valid if buyers show up with real intent don’t pre-empt.
This is a textbook inflection zone. If the lower trend line breaks and retests from below, momentum favours the bears. If bulls trap and reverse this drop at 6270, we could see a fast grind back to 6360 but as of now, all signs lean toward breakdown over bounce.
Positioning itselfThe structure in the S&P 500 daily chart implies a market with a bias to the upside positioning itself for the release of fundamental information this week.
