8752 Break Could Open Path to Retest Record HighsA clean break above the March 20 high of 8752 would generate a bullish setup, allowing for longs to be established with a stop beneath for protection, targeting a retest of the record high at 8898.
Price action has been bullish in recent days, with a break of minor downtrend resistance on Thursday triggering another wave of buying, backed by solid volumes. Combined with momentum signals that reinforce the trend, the bias remains to buy dips and breakouts.
If the price fails to sustain a break above 8752, the setup is invalidated.
Good luck!
DS
FT1U2025 trade ideas

XRP/USDT 1H: Bullish Momentum Holding – Next Stop $2.95?!XRP/USDT 1H: Bullish Momentum Holding – Next Stop $2.95?
🚀 Follow me on TradingView if you respect our charts! 📈 Daily updates!
Market Structure & Momentum:
Price: $2.73, maintaining bullish structure after breaking $2.60 resistance.
RSI at 70.39, indicating strong momentum but nearing overbought conditions.
Pattern: Bull flag consolidation after an impulse move, suggesting continuation.
Smart Money Concepts:
No significant bearish divergences, confirming strength in trend.
Market Makers accumulating within the $2.55-$2.60 zone, preparing for a potential breakout.
Price holding above key Smart Money levels, signaling sustained buying pressure.
Trade Setup (Confidence 8/10):
Entry Zone: $2.71-$2.73 (current range).
Targets:
T1: $2.80 (near-term liquidity target).
T2: $2.95 (previous swing high).
Stop Loss: Below $2.65 (under recent consolidation).
Risk Score:
7/10 – Strong setup, but elevated RSI suggests caution on aggressive entries.
Market Maker Intent:
Accumulation phase evident, Smart Money likely targeting $2.80 before a potential retracement.
Retest of $2.65 could provide a safer entry before continuation.
Recommendation:
Long entries favorable within $2.71-$2.73, but be cautious of overbought RSI.
Safer entry would be a retest of $2.65, offering better R:R.
Watch for bullish volume confirmation before scaling into positions.
🚀 Follow me on TradingView if you respect our charts! 📈 Daily updates!

FTSE 100 futures: Buy the dip for resistance retest?FTSE futures continue to coil in a triangle pattern dating back nearly a year. While that suggests we may eventually see a decisive break at some point, today’s setup looks at playing the existing range.
The price has been well supported on dips towards and through 8200 recently, bouncing on four consecutive occasions.
Considering the price action, one setup to consider would be to buy above this level with a stop beneath Tuesday’s low for protection.
Despite recent weakness, momentum indicators like RSI (14) and MACD continue to trend higher, making the preference to buy dips over selling rips.
The January 9 high is one potential target, another triangle resistance located just below 8400.
Good luck!
DS

Footsie Hasn’t Topped Yet; Shows Bullish PatternWe talked about Footsie back in May 2024, where we mentioned and highlighted an ongoing 5th wave in the weekly chart with space up to 8800 – 9400 target area.
Footsie a.k.a. FTSE100 or UK100 stock market index is still bullish with nice and clean inverted H&S pattern on a daily chart. After a higher degree A-B-C correction in wave (4), it can be getting ready for a bullish continuation within wave (5) by a new lower degree bullish setup formation. With sharp leg up into wave 1, we are actually tracking an a-b-c pullback in wave 2, where subwave »c« is coming out of subwave »b« triangle, so ideal support is at 8100 – 8000 area, from where we should be aware of a bullish resumption for wave 3 of a five-wave bullish cycle.

FTSE 100 futures reverse hard to stage bullish breakoutFrom dire to delightful in the space of two sessions – that’s was the rollercoaster ride UK FTSE 100 bulls had to endure late last week with futures taking out stops layered below 8152 before reversing hard on Friday, taking out the 50-day moving average and downtrend resistance dating back to the record highs set in May. Closing at the highest level since June 24, it looks like the move may extend further this week with MACD and RSI triggering bullish signals, hinting at a potential retest of the former highs.
Those looking for this outcome have a variety of setups to choose from depending on how the price action evolves on Monday.
Ideally, a retest and hold above the 50-day moving average would be the preferred setup, allowing for a stop to be placed below the level for protection. Potential upside targets include 8351.5 and record high of 8489.
For those itching to buy the breakout immediately, you could place a stop below 8300 for protection. Targets would be the same as those mentioned above. The final option would be to wait for a potential break and hold above 8351.5, allowing for longs to be established above the level with a stop below to protect against reversal. That setup would need to target 8489 to make the trade stack up from a risk-reward perspective.
Even though the composition of the indices is very different, you get the sense Microsoft’s earnings report after the market close on Wall Street on Tuesday will be highly influential on whether the FTSE sees record highs this week.
Should the bullish momentum be sustained, it will come down to the market reaction to the Fed interest rate decision on Wednesday and Bank of England policy decision on Thursday. The Fed is likely to leave rates on hold but signal a rate cut is likely in September. The BoE outcome is far less certain with markets deeming the outcome a coin flip.
With other central banks turning dovish, I suspect we may see the MPC do a RBNZ and reprioritise growth over the threat of an inflation reacceleration, delivering the first cut of the monetary easing cycle. If it does cut, the signal on the likely path for rates in the future is likely to be more influential on the decision itself, so keep an eye on Governor Bailey’s press conference.
DS

Footsie Is Trading In 5th WaveWe have been talking for a long time about bullish UK stock market index FTSE100 a.k.a. Footsie. We also shared the chart with our members more than a year ago, where we were tracking wave 4 correction within an ongoing five-wave bullish impulse.
After a longer sideways consolidation, it turned out to be a bullish triangle pattern in wave 4, but as you can see, it’s now finally and nicely extending higher for wave 5 as expected. There can be space even up to 8800 – 9400 target area, just watch out on short-term pullbacks.

FTSE 100 Analysis - Continuous, Just as the Markets !This is a Thread, so Follow for Technical Analysis performed with TrapZone Pro & UMVD Indicators.
* Trend is Based on TrapZone Color
* Bar Colors give us Momentum Green from strong Up Moves. Red Bars point to strong Down Moves.
* Red UMVD = Selling Pressure & Green UMVD = Buying Pressure. Purple is for Divergence = Battle of Supply & Demand
--------------------
2-1-2024
Sideways Momentum with RED TrapZone established now and GREEN UMVD continues still. Price swinging UP & DOWN around the TrapZone. Cant seem to find a direction.


FTSE 100 index Weekly chart FTSE 100 index looks like its getting ready for a breakup that can take the index to new highs in the coming weeks
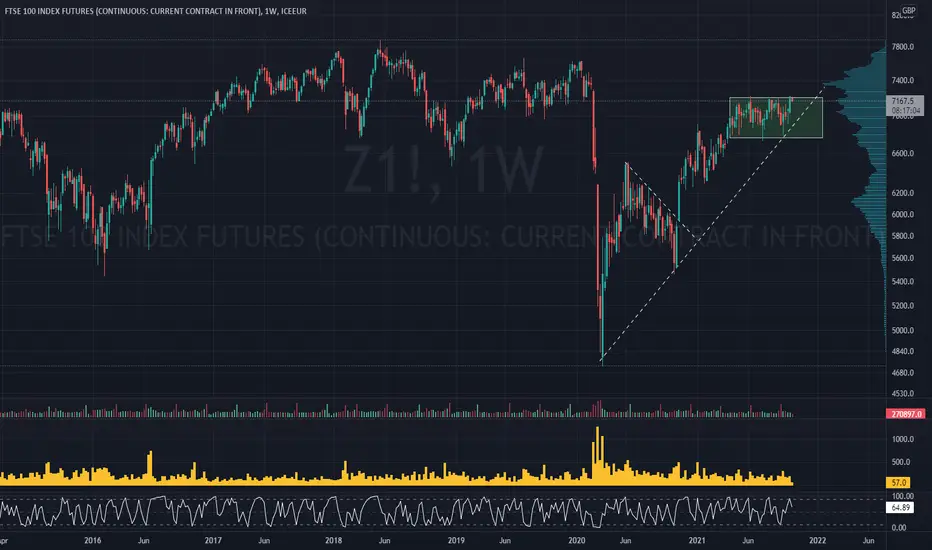
Long FTSE on break above 6290The FTSE has lagged other major indices since the March lows but could now be set to play catch up.
Price still around the 50% retracement level and in a narrow 300 point range for the past month or so.
8/21 EMAs positive and a clean break above 6290 would pave the way for a breakout.
Possible targets the 61.8% fib at 6520 or the 78.6% at 7007.
I like long entries on a break above 6290 with stops below the daily low of the breakout candle.


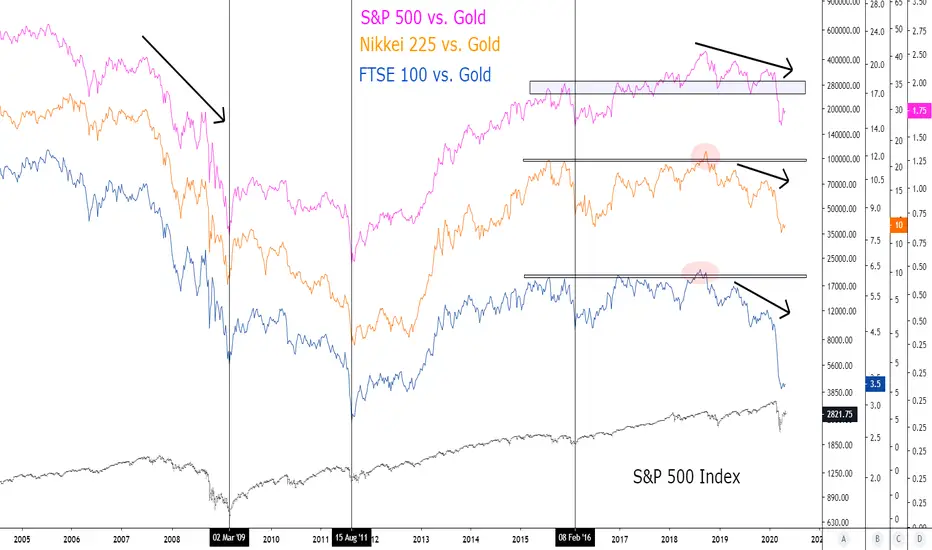
Major indices priced in GoldGiven the economic environment, these ratios are on the top of my watchlist..
Global Stock MarketLooking at the biggest equity markets in the world - let's remember to keep our eyes on stocks as an asset class, not just US equities!

FTSE 100 Futures : ShortParameters :
Position Size : %1
Risk/Reward Ratio : 2.99
Stop-Loss : 5939.5
Goal : 5636
NOTE : Zoom in :
