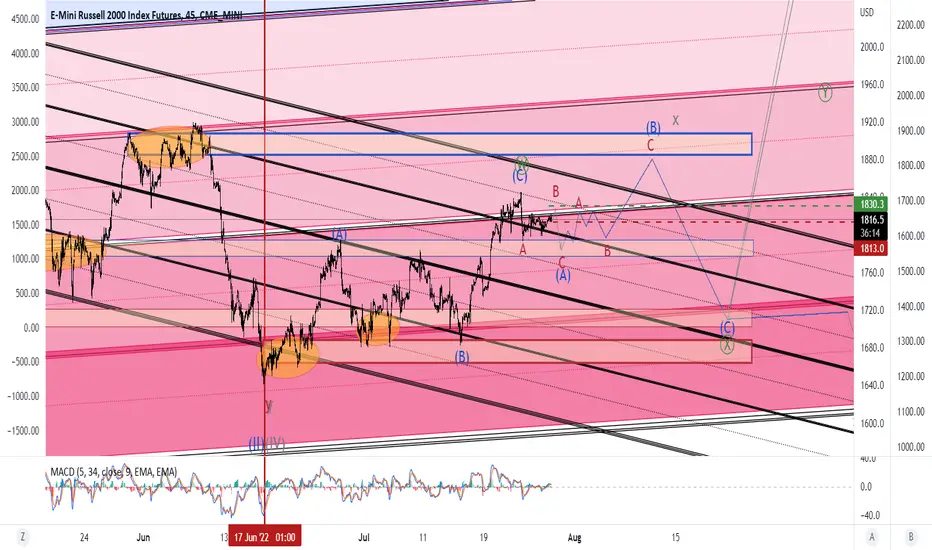
Elliott Wave View: Russell 2000 (RTY) Likely See Further UpsideShort Term Elliott Wave View in Russell 2000 suggests the rally from 6.17.2022 low is unfolding as an impulse Elliott Wave structure. Up from 6.17.2022 low, wave 1 ended at 1795.1 and pullback in wave 2 ended at 1680.6. Wave 3 higher is in progress as a 5 waves impulse structure. Up from wave 2, wave ((i)) ended at 1783.6 and pullback in wave ((ii)) ended at 1682.3. Index then resumes higher in wave ((iii)) towards 1920.7, and dips in wave ((iv)) ended at 1884.7.
Wave ((v)) is currently in progress as 5 waves in lesser degree. Up from wave ((iv)), wave (i) ended at 1959.8 and dips in wave (ii) ended at 1904.1. Index then resumes higher in wave (iii) towards 2008.7. While wave (iv) dips stay above 1884.7, Index can see 1 more leg higher to end wave (v) of ((v)). This should complete wave 3 in the higher degree. Afterwards, Index should pullback in 3 , 7, or 11 swing within wave 4 before it resumes higher again in wave 5. This should complete the cycle from 6.17.2022 low before a larger pullback happens to correct that cycle.
M2K1! trade ideas


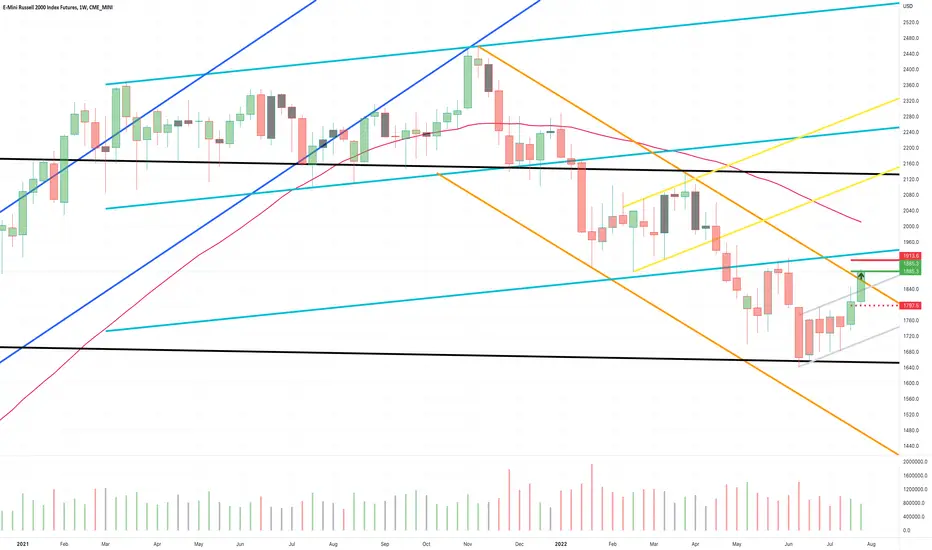
Russell2000 Targeting A 2000 TestIn this update we review the recent price action in the Russell2000 futures contract and identify the next high probability trading opportunity and price objectives to target

RTY1! - Weekly Market Update, 8/8/22Russell Futures completed countertrend BUY signal as per Ideal entry, stop and target imaged on the chart.
Support and Resistance structures have been adjusted accordingly for your reference.
Wishing you a blessed and profitable week ahead.

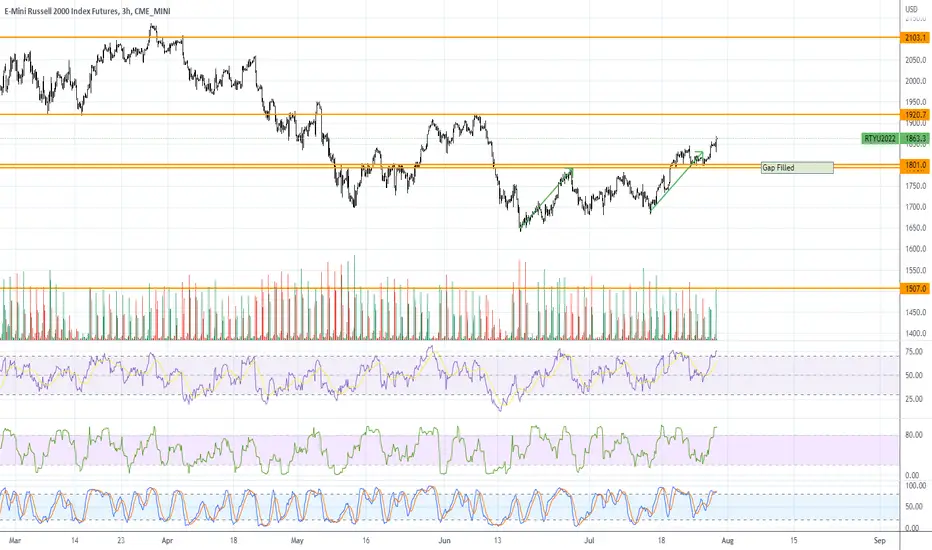
Will RTY Daily Resistance Hold?The RTY daily time frame is in a down trend. The
market is hitting the down trend line. At the same
time the market is hitting an up Fibonacci
extension price point 1890.50. Usually when this
happens. The market has a bearish reaction. If the
market continues to push bullish and breaks the
down trend line. It will be a strong sign the buyers
are taking control. If the market cannot break and
close above the down trend line. It is expected
the sellers are taking control and will push the
market back down.
As long as the market stays below the daily
down trend line. It will be a good idea to turn
to the one hour time frame and to look for
high prices in the sell zone.

RTY1! - Weekly Market Update, 8/1/22Russell 2000 Futures post a countertrend BUY signal ... Ideal entry, stop and target imaged on the chart.
Support and Resistance structures have been adjusted accordingly for your reference.
Wishing you a blessed and profitable week ahead.
HOD today, so far, is the POC from range 5/26/22 - 6/10/22See if this HOD holds and if so, I expect more downward pressure

RTY: Top of the Channel ShortSeems like we are re-testing the top of the channel; good place for good return/risk ratio to target bottom of the channel.
Fundamentally, Russell should be strongest of the major indicies - being longest dollar (versus more internationally exposed names in S&P500 and NASDAQ100); technical targets are somewhat the same across the 3 indices; each targeting 14-16% downside from here assuming the floor breaks.

RTY UpdateOverbought again after the morning dip, looks like a melt up and 4 day short squeeze so not shorting anything at the moment aside from the put leg of my BITO strangle. Calls are now in the money so hopefully crypto goes pumptarded on Ponzi payday Friday.
I'm 75% sure this is a melt up, but if you're long I suggest some protection.
7/27/22 Breakout of mid and Long term balanceWill watch today for acceptance or failure out of mid and long term range.

M2K Swing trading Micro E-mini Future Russell 2000M2K 2022-07-25 Swing trade M2K 1 contract
Trend
- At the pane below, all indicators are beginning to reverse to a down trend
- All the moving averages (Ma-18-21, 50, 100, 200) are trending down, and in a synchronize
inverse order
Special condition
-The result reports of many big companies may influence this trade
Orders
- Short executed for 1 contract of the Future M2K, at 15h59 July 25 2022
- Stop order waiting placed over the recent high
- Lmt order waiting near the Bollinger-Low-Band
Money in play
- If stop exec -168$ (1817.0 - 1851.0) *5$ * 1 ctr minus 2$ (fees, slippage)
- If Lmt exec +578$ (1817.0 - 1701.0) *5$ * 1 ctr minus 2$ (fees, slippage)

Current Range PreFOMC morningHere is where we are prior to FOMC. Will FOMC move us out of current range?

M2K - Daytrading - Micro E-mini Future Russell 2000M2K 2022-07-26 15 min Daytrading 3 wins / 4 trades +100$
Each trade is explained on the chart

RTY UpdateNQ is tanking but RTY has more of a wave 4 type pattern, so small caps probably rally on the Fed tomorrow. MFI hit oversold, but the index didn't sell off much. IWM has a bullish pattern on the daily and intraday.
Small caps are relatively strong despite most garbage and retail stocks being in the category. Strange.
Anyways, bullish on small caps tomorrow for the usual Fed pump. Will wait for tomorrow and day trade I think.

So Far, we have returned and are staying in BalanceWe rejected higher so far, how far lower do we test?

RTY Daily down channelThe RTY daily time frame is in a down channel.
The market is at the top of the channel. If
resistance holds. The research says to expect the
market to push bearish towards the bottom of
the channel price point 1554.6 about -2,620
ticks below the market.
It will be a good idea to wait for the market to
close below the short term up trend line before
turning to the one hour time frame to look for
selling ideas towards the bottom of support.

RTY1! - Weekly Market Update, 7/25Dow futures remain contained this week by the GREY channel formation.
Channel structures have been adjusted accordingly for your reference.


Daily RTY , Do We Breakout?Todays close should give clues if we breakout or if we return to balance.


RTY - Will We Break Out of Range or Fail Back Into RangeI am waiting to see if we break out of range or fall back into range.
