RTY1! Weekly Market Analysis for the week of 2/21/22Last week's price action, most importantly last weeks price settlement may be an indication of what's on the horizon.
Price continues to close below key resistance which leave the market susceptible to completing a full channel extension.
A retest of 1,892.40 is not out of the question in the near term unless something spins this market around aggressively.
The next macro area os support is at 1,800 which could be reached within several weeks time if this market sells off.
While the Russell 2000 has been grinding higher over the past several weeks, it has yet to settle above resistance.
2,025 holds the potential to contain weekly buying. It would take a settlement above for the market to grind higher.
M2K1! trade ideas

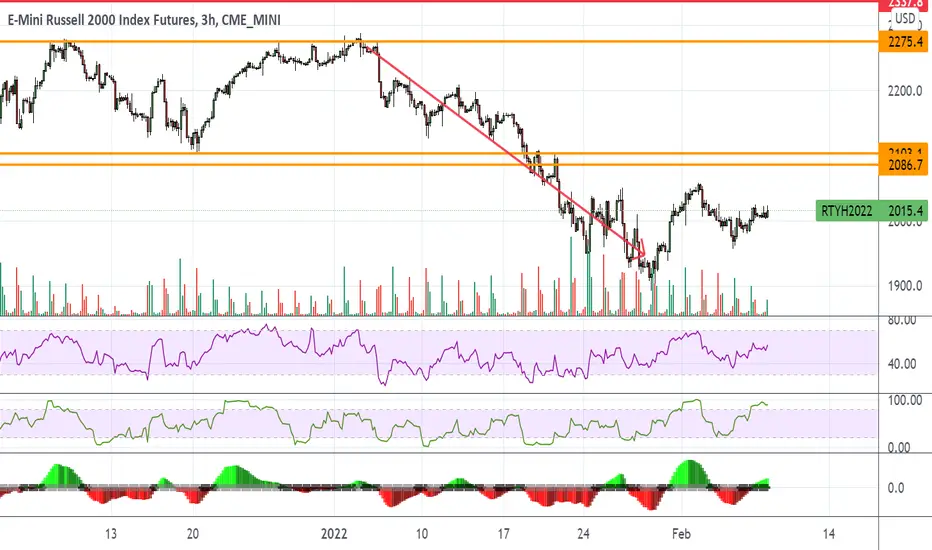
Russell 2000: Retest Pennant??Major Pattern: Weekly Rectangle
9-10 Feb Bearish Engulfing possible retest (possible anticipatory sell, low risk)
Below 2000 will confirm Pennant

$RTY Gartley x Cypher $NQ, $ES, $VIX Shorts, Incredible RR We caught a beautiful short across all indexes and a 2x short on NQ I will include those set ups, all based off $VIX Bat pattern, that gave us a reason to find asymmetrical risk shorts in $RTY, $NQ, $ES
I think $RTY will test 618 and hopefully fill 786 level, Stop against low of X, aim to. I will post my entry if it comes
tp 1 @382/ stop even, take 1/2 + profit off
tp 2 @618
tp3 @ top of pattern
These plays were next level shorts, worth checking out.
$RTY
$NQ
$ES
$NQ Pullback
$VIX

Think the Market is going to puke - RTY Down Down DownStocks are not looking good, getting warning signs like March 2020, think it's about to rug pull.

A bit Higher and then Lower?There should be a bit of upside left but then price should face a strong resistance from the prior support level and also the down trend line from the top !! Let's see

1 to 1 correction complete on IWM, looking for a 5th wave and 3kSo many growth stocks look similar in that we see large flat 3 wave corrective action that appears complete to me. This could be the blow off beginning. Typical for 12 months from tightening to top. Maybe its faster this time we shall see.

RTY OverboughtRTY now overbought on RSI and MFI as I predicted earlier this week. Looks like a melt up though, and I hate trading melt ups, no idea when it will end. Tomorrow? next week? who knows...

RTY Still OverboughtMFI overbought but it's still moving up. Maybe RSI needs to go overbought?
Market is just doing some weird stuff this week
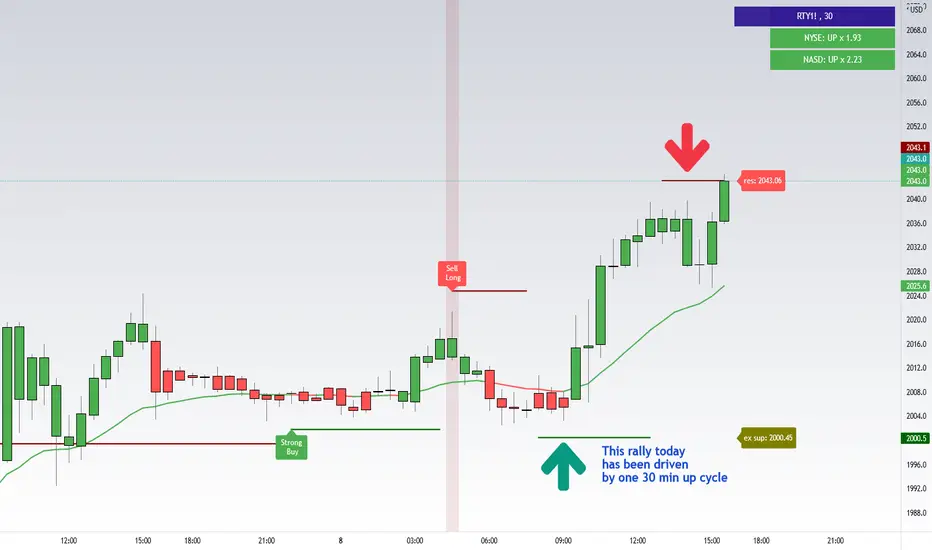
RTY - One 30 min cycle has beed driving that rally on TuesdayRTY - One 30 min cycle has been driving that rally on Tuesday
RUSSELL - LONGIf support holds we go up till the red box 1 then sideways to up till red box 2 then waterfall down.

It's been a tough yearHaven't posted much because nice setups are hard to come by. This year has been very volatile so far. I do think we will see more of that in the coming weeks. One thing I have been looking for is for market to form another higher low. /NQ tested the 20sma wasnt able to hold so for tech I am watching what happens there. We could see another test of the lows or this can form a higher low as well.
On the other side I think small caps (RTY,IWM) can be a great short. Been watching this setup develop and I dont care to guess which way it breaks. If it cracks the lower trendline I will short and use that trendline as my SL. Same goes for upper trendline, that breaks and I will go for calls.
The best strategy for right now is to not be biased on market direction. Be flexible and able to change with market sentiment. For the most part I have been scalping and will more than likely continue until we see some sort of a trend develop.

RTY1-IWM-Russell 2000The OVERALL INDICATOR As it moved last week the most to the downside out of all indices. I've highlighted the important zones to the upside (supply zone) and downside (demand zone). Overall I'm expecting a bit more downside (1 to 2% max) drop before earnings and Fed kicking back markets up for a week or two. Mid February . Once Markets go up to 100 ema, i will continue the LONG TERM view shorting. Expecting a 20% drop overall on all equities.

RTY MFI also overboughtMuch more apparent on this chart, MFI is def overbought short term.
Not chasing anything today

Russell 2000 Index - Canary in the Coal MineCurrently down nearly 20% from November 2021 ATH, $RTY1! has lost key support levels and is now below the entirety of ranges from 2021.
This futures index is signaling an increased potential for a broader market correction.


RTY Shortterm: Long
New inner cycle starts and bullish flag pattern is forming.
potential Long shortterm till max 2100~ before we see bearmarket again.
if this week dont continue to raise. we will see 1700~ this week.
prepare before its going wild this week.

RTY MFI oversoldThe other indices are not there yet but RTY MFI is oversold.
Could be the first index to reverse, we'll see. ES and NQ charts imply a reversal either this afternoon or tomorrow but everything depends on AMZN earnings so no prdictions

RNY1! daily Wolfe Wave bullish A Wolfe Wave is a chart pattern composed of five wave patterns in price that imply an underlying equilibrium price. Investors who use this system time their trades based upon the resistance and support lines indicated by the pattern.

RTY UpdateIt's a long ways down before RTY MFI hits oversold and there appears to be no buyers for small cap stocks.
As has been the case the past year, small caps will be the weakest index. I'm predicting more flight to safety

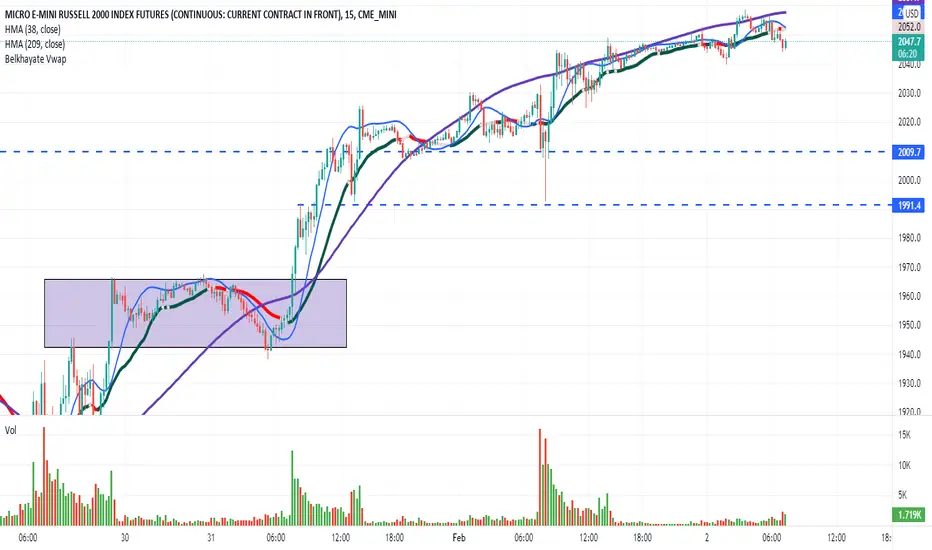
MICRO E-MINI RUSSELL 2000 INDEX FUTURES (CONTINUOUS: CURRENT CONHere's what a real target is. A very important explosion.
MICRO E-MINI RUSSELL 2000 INDEX FUTURES (CONTINUOUS: CURRENT CONThe arrow is starting to move and it's possible to get down to the designated area as the primary target.
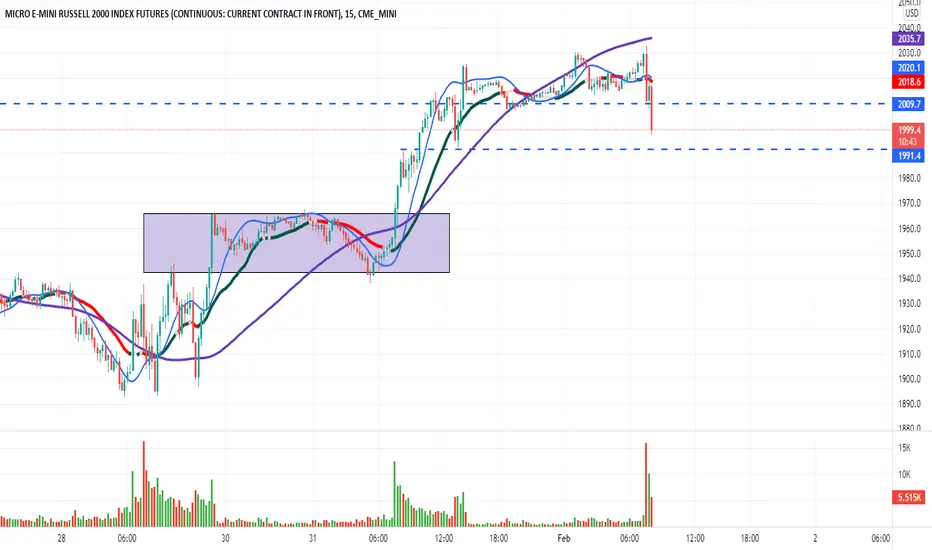
MICRO E-MINI RUSSELL 2000 INDEX FUTURES (CONTINUOUS: CURRENT CONThe arrow moves very strongly, and it's very beautiful, and every time it offers us creativity of another kind.

Russell Leading The Dax?In this update we review the recent price action in the Russell and the Dax and identify some high probability trading patterns to take advantage of
