DXY, EURUSD, ES1! Daily Trade SetupsIn this update we review the recent price action in the Dollar Index, EURUSD & E-mini SP500 and identify the next high-probability trading opportunities and price objectives to target. To review today's video analysis, click here!
MES1! trade ideas

ES, SPY, SPX will be testing key support on Sunday After a welcome rally into new highs for the s&p, there appears to be a critical crossroad forming. Using the ES continuous contract I have placed 2 anchored VWAP's. The first being anchored to the last higher low on Thursday, June 19. And the the second, being anchored to this last Thursdays high on July 3rd.
For this post we will call the anchor from June 19 - VWAP1. And for the July 3rd anchor - VWAP2
VWAP1 r1 has acted as a key support line since the higher low was set. Successfully bouncing and holding support several times.
As we headed lower on this Thursdays July 3rd session, we remained between the center and r1 of VWAP2 indicating strong selling pressure for the day. With it being a shortened trading day with less liquidity however, I have less concern over the days price action. The forming crossroads and the upcoming Sundays open will be more telling for where we likely head this week.
The blue Horizontal Line at 6266 is placed directly on VWAP1s r1 (green line) which has acted as support. If we trade into this level on the Sunday open, it's a clear signal the sellers are still in control. If however, price can consolidate at that level (6266) and form structure, a breakout of the structure would be evidence of sellers backing off and buyers stepping in creating a good buying opportunity for the week.
Another possible scenario, if we first manage to trade up into s1 of VWAP2 (orange line) around the 6300 level, I will be looking for a short scalp down to the r1 of VWAP1 at 6266. From here it would be prudent to sit and wait for more confirmation on if this is a reversal, or just another pullback in the uptrend.
These are my two trade setups and ideas for Sunday's open. Hope this analysis helps. Happy trading 🤙💰📈

2025 Q1 + 6M/12M ranges 8h interim cycling bullish.
s1 @ 5554
r1 @ 5592
macro r1 @ 5738
sustain above and macro rotation pushes higher, r2 @ 5921.
its 8 days into the trading month and we've spent the entire 1M atr with extension to the downside.
8H / 1D interim rotation is bullish and no hh on di- since feb 27, despite almost a 500pt drop.
Extended boxes for 6M / 12M, and major levels noted for annual sup/res also marked.
In the last 20+ years, 12M candles closing red still printed an avg 4.74% H above the open; and after hitting lows, closed the year with an 9.97% rebound.
The rotation is a feature not a flaw.
Accept that it's fixed, and you'll see that nothing is broken.
You'll know the signal when you see it.
Appreciate the risk.

14 day look ahead at ES spy futures
CME_MINI:ES1! I am watching fundamentals and any incoming tariff news this week (mostly for scalps on small timeframes). This is because of the Japan news reaction we saw last week which presented good opportunity.
Bear: I am watching price seek possible consolidation up here after being bullish at a strong upwards angle. I see small exhaustion being cooled off and possibly looking for more cooling until the middle of this week, I expect no serious price movement until Wednesday July 9, 2025. Watching that 4h green slanted trendline to break for scalping opportunities. If the white larger trendline is broken I will be considerably more bearish that we would likely reach a price of 5,805 or lower again, this would be a lot to ask but it is a location I would assume price would find solid support if reaching that area in the future weeks/ month. Watching horizontal lines for support this week specifically at price 6,271 to be broken or held. There looks like there is some slim price action (little support or resistance) from 6,100 to where we are now. This could push the downward volume quicker to the downside possibly presenting great opportunity for bears in the possible near future, if we break down below 6,197.
Bull: we are clearly in a macro bullish trend it is silly to decide we would all of a sudden drop significantly unless something obscene happens fundamentally. I step into this week assuming we will keep strong upward trendlines far above the macro (my white thick) trendline. watching fib extension levels for more upside since we are consolidating a bit already it would be easy to assume we will jump up to the .236 at 6,342 and even get to the .382 at 6,387 and higher. I still expect the ADX to cool down here in the beginning of the week if not all week. I also assume to see the rsi finish its bearish divergence off with a strong predicted sell off- but to reach higher highs after (buy the dip, trade the reaction, WAIT for the dip).

Stock Index: ES, NQ, YM Weekly Update📈 S&P 500, Nasdaq & Dow Jones – All-Time Highs, But Caution Creeping In
🟩 S&P 500 | Nasdaq | Dow Jones
All three indices hit new all-time highs to close out June.
Powered by:
🔋 AI optimism
💰 Solid earnings
🕊️ Dovish Fed tone and falling bond yields
SPX continued its breakout run
Nasdaq surged as big tech led the charge
Dow followed with slower but steady strength
⚠️ But Watch the Signs Beneath the Surface
Consumer confidence dropped sharply
Home sales weakened
Fed speakers remained non-committal on cuts
All three indices now look extended — particularly Nasdaq
Momentum remains bullish, but these rallies are now resting on softening macro, yield compression, and hope that the Fed stays on hold.
🧠 Key Takeaway
Price action is euphoric — but fundamentals are flashing mixed signals.
When tech leads the market at extremes, volatility risk is elevated.

ES1! S&P500 Might Lose Momentum As Tariffs Deal Not Set...price could probably be testing all time highs. Before plunging....
if the volumes comes with it and reaches the all times high levels, that could be a nice short entry point for potential profits.
Otherwise, it could probably just fill the gap on week open and keep going down in a regular pattern until August as Trumps Tariffs Deals deadline is around that time possiblily...

SPX Is Pure RiskAbsolutely insane for people to be saying things like "a new bull market" when it never ended. All of the risk is to the downside. If markets ran another 10% to the upside that gives investors a chance to determine if they want to buy a correction to see new highs or not. But to say that a bull market is coming is the antithesis of thinking when current risk is all downside.
This is risk management 101:
Lets say you have a SP:SPX target of 10,000, would you rather buy it at 6,500 where you know your downside is 7-8% or right here at 6300 with a potential downside of 22%+?
Who in the market is long right now? Everyone because all the short sellers are stopped out, and the dumbest of money the guys who just got promoted to the rank of captain in the branch of hindsight bought the "breakout."
The retracement to the highs has been one of the most hated rallies off of a bounce ever seen and why? Because it required a large amount of vibes and to a degree stupidity to buy where it bounced but it paid off. So if it was borderline stupid to do that, what does it mean to lever up at the top?
The correct method is to either be short here or be patient for a breakout with volume and a successful retest. There you can limit your downside and have nearly unlimited upside if it plays out that way.

ID: 2025 - 0084.16.2025
Trade #8 of 2025 executed. So simple, yet far from easy...
Trade entry at 93 DTE (days to expiration).
The last few weeks have been quite challenging, mostly due to increase volatility (3rd highest expansion in history), as well as widening bid/ask spreads. This trade idea will dovetail with trade id: 006 to balance delta without incurring more slippage due to spreads. This trade will hold to expiration without any adjustments until the final 30 days of trade life.
Happy Trading!
-kevin

Inside day on MondayThe structure in the daily S&P 500 chart implies an inside day for Monday. It indicates a loss of momentum and is potentially bearish.

DIYWallSt Trade Journal:$238 Lessons From Monthly Expiration07/18/25 Trade Journal, and ES_F Stock Market analysis
EOD accountability report: +238.75
Sleep: 5. hours
Overall health: Was working late last night and didn't get much sleep.
VX Algo System Signals from (9:30am to 2pm)
— 8:30 AM Market Structure flipped bullish on VX Algo X3!
— 10:30 AM Market Structure flipped bearish on VX Algo X3!
— 11:10 AM VXAlgo ES X1 Buy signal (didn't work that well)
— 12:10 PM VXAlgo NQ X1DD Sell Signal
— 12:19 PM Market Structure flipped bullish on VX Algo X3!
What’s are some news or takeaway from today? and What major news or event impacted the market today?
Today was monthly expiration for options and we got a lot of X7 Sell signals but structure was bullish so I tried to take a long at MOB and got burned. Flipped bearish and started shorting the rest of the day and ended up making money back.
News
*US STOCKS MOVE LOWER AFTER REPORT SAYS TRUMP PUSHES FOR 15-20% MINIMUM TARIFF ON ALL EU GOODS
What are the critical support levels to watch?
--> Above 6335= Bullish, Under 6315= Bearish
Video Recaps -->https://www.tradingview.com/u/WallSt007/#published-charts

ES! Daily LookWe are still in Mid-month of July and Markets is still strongly bullish. A retracement to previous pivots before completing the symmetry might be a high probability case here. Let see how it turn on in the next few days.
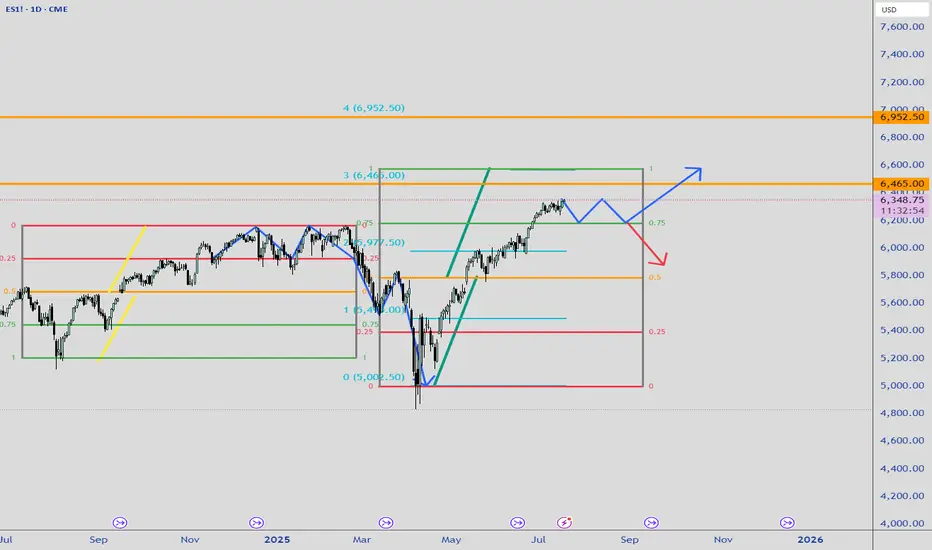
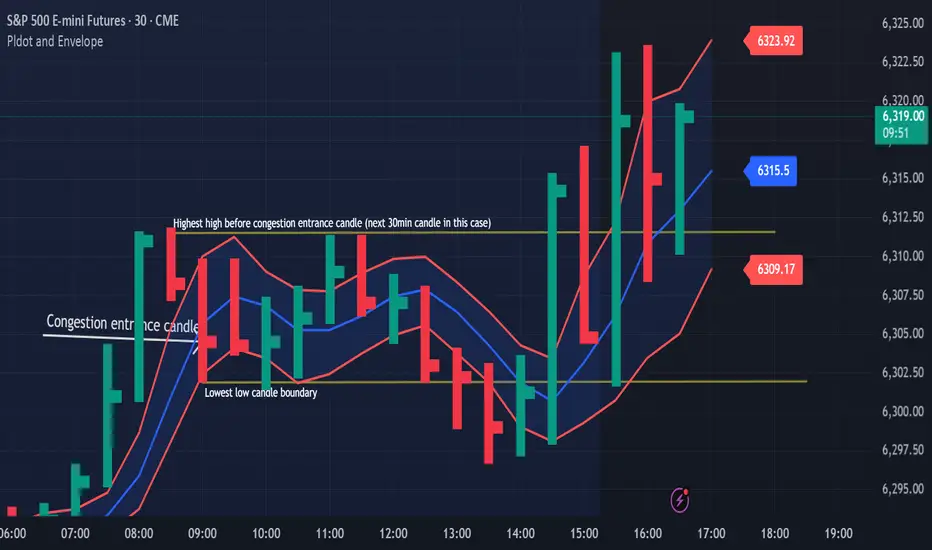
Congestion Action vs Congestion Exit – Mastering the TransitionWhen markets go quiet and churn sideways, it’s easy to get lost in the noise. But inside that congestion lies opportunity — if you understand the difference between "Congestion Action" and "Congestion Exit." Here’s how to apply Drummond Geometry to trade these phases with precision:
🔹 Congestion Action
Congestion action is when the market is not ready to trend — it's swinging back and forth within a defined range, between a strong block level and a well-established dotted line. Think of it as a "resting zone" before the next directional move.
📏 Original Confines: Highest high and lowest low after a congestion entrance as shown on the chart
🚧 Expanded Confines: Price temporarily breaks out of the range but doesn’t establish a trend (3 closes on the came side of the PLdot (blue line)).
🧲 This is where scalpers and range traders thrive. Look for setups near envelope confines and use nearby energy fields.
✅ Trade Plan: Play the range — buy support, sell resistance — until proven otherwise.
🔸 Congestion Exit
This is when the market transitions from ranging to trending — a trend run begins from within the congestion zone.
🚀 First bar of a new trend closes outside the congestion confines (either the block level (highest high on the chart) or the dotted line (the low on the chart)).
📊 The next bar must confirm with a trend run close — if not, it’s a failed breakout. You can see on the chart that price tried to trend lower but the trend was not confirmed!
⚡ Patterns to watch:
Energy pushing in the direction of the exit (PL Dot push, c-wave continuation).
6-1 lines against the breakout direction disappear.(Not visible in this version)
Resistance/support against the exit breaks.
✅ Trade Plan: Enter on breakout confirmation, not just the breakout bar. Measure energy and watch the follow-through.
🧭 Tip:
Don't get faked out. If price re-enters congestion after a breakout, re-draw the boundaries — the old congestion is no longer valid.
🔥 Bottom Line:
Congestion Action is where the market breathes. Congestion Exit is where it moves. Mastering the handoff between the two gives you a decisive edge.
SP500 ES Weekly Recap | ATH Deviation → Pullback or Powell Pump?Overview:
ES made a new all-time high last week, sweeping the previous high with strong momentum.
However, the move ended up being a deviation, and the price quickly reversed — suggesting short-term exhaustion.
Bearish Scenario (Baseline):
🔻 Rejection from ATH
🔻 Possible retracement targets:
12H Swing Low (turquoise line)
Weekly Fair Value Gap (purple zone)
I believe a pullback into those levels could provide bullish continuation setups for new highs. I’ll look for LTF confirmation once price reaches those zones.
Bullish Scenario (Catalyst-Driven):
🚨 If Fed Chair Powell resigns this week (a circulating macro rumor), the market may not wait for retracement.
This could lead to an aggressive breakout, driving ES and risk assets straight into new ATHs again.
Plan:
✅ Watch for LTF confirmation after pullback
✅ Stay open to both scenarios
✅ Focus on HTF bullish structure as long as key levels hold

Neutral zone structureThe daily chart in the S&P 500 has created a neutral zone structure. This implies a sideways move, which is what I'm looking for but with a positive close.

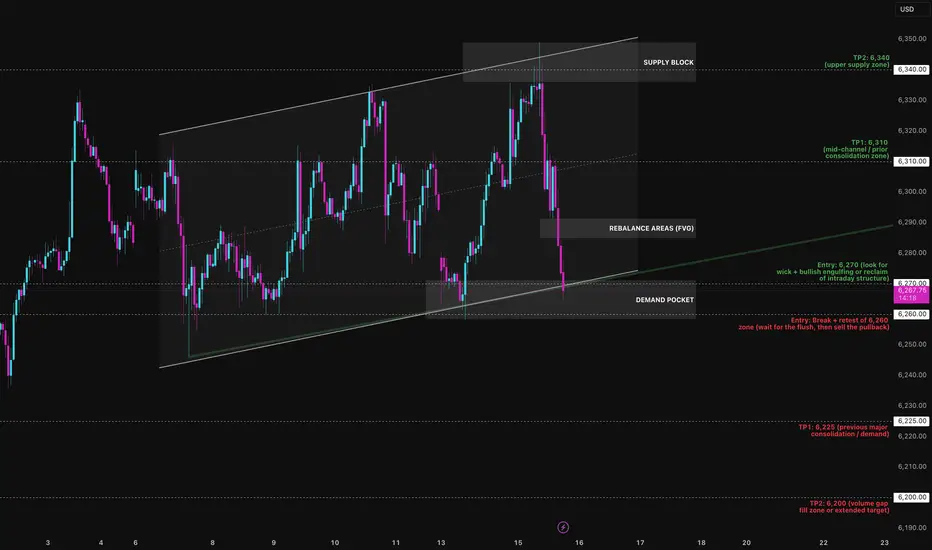
Bounce or Burial? The MES Funeral is Loading…The Micro E-mini S&P is walking a tightrope. After weeks of controlled movement within a rising parallel channel, price has now slammed into the lower boundary and the next move will define the week's direction.
I've mapped the channel from the July 2 low, with multiple precise touches on both upper and lower boundaries. Currently, MES is printing a heavy rejection from the 6360 supply zone, falling nearly 90 points back to the channel’s base near 6270.
Preferred Bias: Short-term Bearish Until Reclaimed
While the macro structure is still technically bullish (channel intact), momentum, supply pressure, and volume structure suggest sellers are gaining the upper hand:
- Mid-channel equilibrium (EQ) at 6310 was sliced without bounce
- No absorption yet at 6270 demand box
- Previous rally legs show decreasing impulsiveness — weakening buyers
Unless bulls aggressively defend 6270 with a reclaim candle or V-shape wick, this looks like a liquidity tap + structural breakdown loading up.
Bearish Play: “Channel Collapse Incoming”
Entry: Break + retest of 6,255–6,260 zone
SL: 6,275 (above retest structure)
TP1: 6,225
TP2: 6,180
Confluences:
- Channel break
- No support bounce at EQ
- Supply rejection at 6360
- Volume void below 6250
Bullish Play (Countertrend Fade): “Defend the Line”
Entry: Bounce off 6,270 with bullish engulfing or reclaim
SL: 6,255 (invalidate structure)
TP1: 6,310 (mid-channel)
TP2: 6,340–6,360 (supply reload zone)
Only valid if buyers show up with real intent don’t pre-empt.
This is a textbook inflection zone. If the lower trend line breaks and retests from below, momentum favours the bears. If bulls trap and reverse this drop at 6270, we could see a fast grind back to 6360 but as of now, all signs lean toward breakdown over bounce.
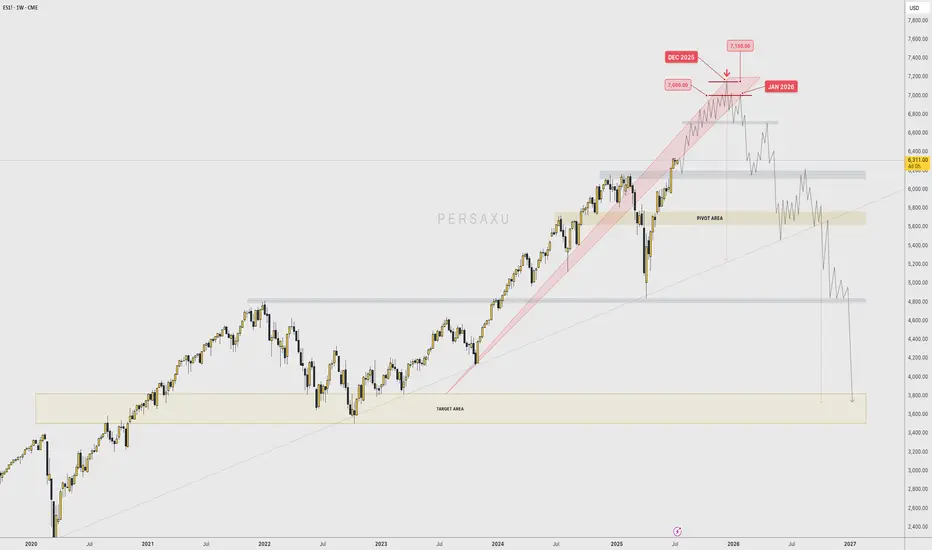
BEAR WITH ME... First of all, I'm getting into the field of other players and trying to call their type of shots.
I don't intend to come across as ignorant when it comes to this market, since I only trade gold and I have seen FOREX traders try to predict gold and get it completely wrong.
I have NO ARGUMENTS WHATSOEVER with which I could back this PREDICTION up; NOT PROJECTION...
As a matter of fact, Technically speaking , the " PROJECTION " would actually be BULLISH , because price is entering a "discovery" phase, In which there is no previous high to "top" a potential impulse with.
When price is making ATH, YOU CAN'T CALL THE TOP UNTIL THE TOP IS FORMED.
That being said, I only want to have this on my profile for personal use and see if my "prediction" comes a reality between December 2025 and February 2026.
--
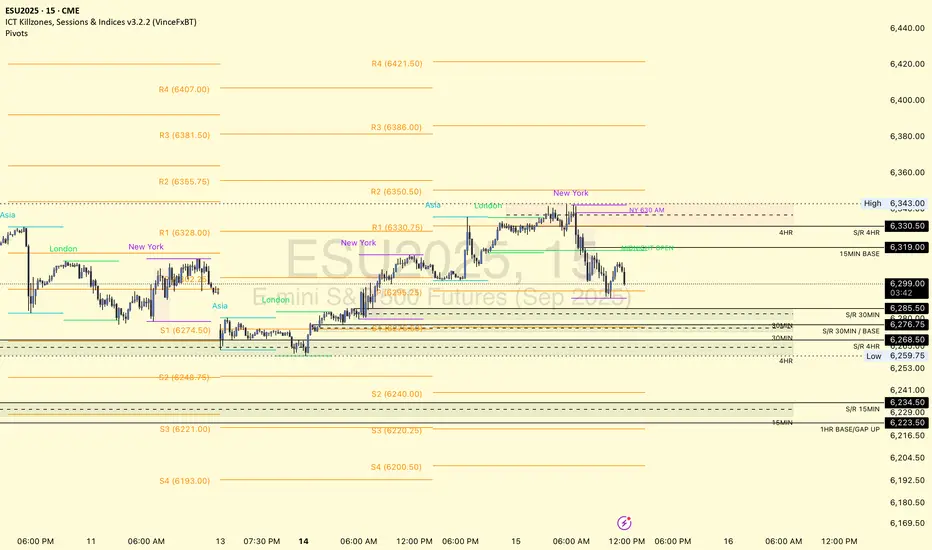
Live Setup for ES NY am session (14 July, 2025)MY bias: I expect price to make move lower at NY am session and target 6,259 price level.


DIYWallSt Trade Journal: Starting Down $400 & Patience Pays Off 07/09/25 Trade Journal, and ES_F Stock Market analysis
EOD accountability report: -271
Sleep: 4.5 hours
Overall health: Good
VX Algo System Signals from (9:30am to 2pm) 4/4 success
10:00 AM VXAlgo ES X1 Sell Signal
10:36 AM VXAlgo ES X3 Sell Signal
11:00 AM Market Structure flipped bearish on VX Algo X3!
1:33 PM Market Structure flipped bullish on VX Algo X3!
What’s are some news or takeaway from today? and What major news or event impacted the market today?
I took some short positions overnight and got caught in the big push up this morning and started the day with -400, I was very tempted to go big and tried to trade it back but decided it was better off just to wait for a better day to recover the account instead.
Consider yesterday was a big manipulation day and today was another one but squeezing to the upside for a rug pull downwards.
News
*(US) FOMC JUN MINUTES: COUPLE OF PARTICIPANTS NOTED THEY WOULD BE OPEN TO CONSIDERING A RATE CUT AS SOON AS THE JULY MEETING IF DATA EVOLVE AS THEY EXPECTED (Bowman and Waller have said as much since the FOMC meeting)
What are the critical support levels to watch?
--> Above 6290= Bullish, Under 6280= Bearish
Video Recaps -->https://www.tradingview.com/u/WallSt007/#published-charts

Backtest $ES 15 minTest for analysis of trend with OBR in 15 min. Testing the possibility to OBR in NYSE:ES

MES Futures – ORB Strategy Long from London Open Range BreakDescription:
Executed a clean ORB long trade on MES during the London session, with confirmation from the 5-min chart and structure mapped on the 15-min.
Setup Breakdown:
Session: London Open
Strategy: Opening Range Breakout (ORB)
Entry: Break of ORB high with confluence from 15-min demand zone + EMA support
Stop: Below session low and structural demand
Target: Previous session high & key 1HR supply zone
T echnical Context:
Price rejected from previous session low and formed a clear ORB range.
After consolidation, a strong bullish candle broke above the range high with increasing volume and EMA cross.
Trade was managed up to the previous session high and partials secured before price met the diagonal resistance trend line.
Key Zones:
✅ Entry Zone: 6270.00
🟥 Stop Loss: ~6260.25
🎯 Target Area: 6287.75 (Previous Session High)
🟥 15-min Supply overhead could pose resistance
Staakd Rating: ★★★★☆
(Rated 4/5 for textbook ORB play, clean risk:reward, and structure alignment)

Wait and seeThe S&P 500 daily chart structurally is in a “wait and see”mode. It is waiting for additional information regarding tariffs and the Fed minutes coming out on Wednesday. I think the bias is still for moved to the upside.
